Nov 25, 2014 - ... their help in algo- rithm development and infrastructure support. We also thank. Bobby Kasthuri, Daniel Berger, and Jeff Lichtman for provid-.
AN AUTOMATED IMAGES-TO-GRAPHS PIPELINE FOR HIGH RESOLUTION CONNECTOMICS
arXiv:1411.6880v1 [q-bio.QM] 25 Nov 2014
William Gray Roncal†‡? , Dean M Kleissas‡∗ , Joshua T Vogelstein † , Priya Manavalan † , Randal Burns † , R Jacob Vogelstein ‡ , Carey E Priebe † , Mark A Chevillet †‡ , Gregory D Hager † † Johns Hopkins University, Baltimore, Maryland ‡ Johns Hopkins University Applied Physics Laboratory, Laurel, Maryland ABSTRACT Reconstructing a map of neuronal connectivity is a critical challenge in contemporary neuroscience. Recent advances in high-throughput electron microscopy have produced massive images of nanoscale brain tissue for the first time. This resolution allows for individual neurons and their synaptic connections to be directly observed. Manually tracing each neuronal process at this scale is unmanageable, and therefore researchers are developing automated image processing modules. Thus far, state-of-the-art algorithms focus only on the solution to a particular task (e.g., neuron segmentation or synapse identification). We have created the first fully automated images-tographs pipeline (i.e., a pipeline that begins with an imaged volume of neural tissue and produces a brain graph without any human interaction). To evaluate overall performance and select the best parameters and methods, we also develop a metric to assess the quality of the output graphs. We demonstrate our pipeline by selecting a set of algorithms and parameters, and search possible operating points to identify the best available brain graph. New algorithms can be easily integrated into our scalable pipeline, and used to improve results and facilitate analysis.
brain graphs at an unprecedented level of detail. Each neuron is represented in the graph as a node, and each synapse is represented as an edge connecting these nodes. Unfortunately, relying on humans to trace individual neurons and find synapses is unrealistic as volumes scale. A recent study estimated that manual annotation of a cortical column requires hundreds of thousands of person-years [3]. We introduce a fully automated images-to-graphs pipeline and an assessment metric for the resulting graphs. This metric allows us to directly assess the connectivity properties of the graph, rather than relying on intermediate measures (e.g., synapse precision-recall or segmentation error). We run a grid search over a collection of parameters (i.e., both individual modules and their settings) using our pipeline to determine the best available result for analysis and interpretation.
Index Terms— Pipeline, Connectomics, Graph Error, Computer Vision, Images to Graphs 1. INTRODUCTION Brain tissue volumes imaged using electron microscopy contains many thousands of cells that can be resolved at the scale of a single synapse. The amount of information is daunting: in just 1 mm3 of brain tissue, we expect petabytes of data containing 105 neurons and 109 synapses [1]. While this region is very small in physical volume, compared to an entire brain, it is roughly the scale of a cortical column, a hypothetical fundamental organizing structure in the cortex [2]. Our goal is to transform large 3D electron microscopy volumes of neural tissue into a detailed connectivity map, called a connectome. This approach will directly estimate ∗ Authors
contributed equally.
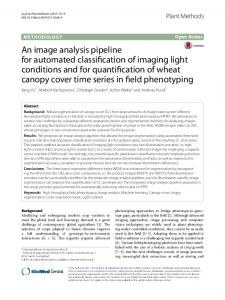
Fig. 1. An illustration of the images-to-graphs pipeline. Detected synapses are shown in green (left); these are combined with multicolored neuron segments (middle) into a graph (right). Nodes are represented by neurons and edges by synapses.
2. PREVIOUS WORK Previous research has produced methods that advance the field of connectomics in important ways, but none have provided an end-to-end, automated, scalable approach. Several manual or semi-automated approaches have been used to construct brain circuits [4, 5, 6]. Other groups have produced automated algorithms [7, 8, 9] that solve important pieces of
Fig. 2. An overall view of the Images-to-Graphs Pipeline, beginning with image data and ending with graph creation. Modules in white are executed each time, modules that are gray (darkly shaded) are executed once and not varied in our analysis, and modules lightly shaded represent our parameter space. the overall puzzle (e.g., neuron segmentation, synapse detection). These modules have generally been evaluated on small subvolumes without considering the overall graph result; additional work is needed to improve algorithm accuracy and scalability. In building our images-to-graphs pipeline, we leveraged previous work whenever available. To detect cell membranes, we reimplemented the ISBI 2012 challenge-winning approach [10], which framed membrane detection as a per-pixel classification problem and obtained state-of-the-art results using a small ensemble of Deep Neural Networks (DNN). We segment the neuronal structures by incorporating Rhoana [7], an open-source algorithm, which selects and fuses candidate 2D contours into 3D objects using conditional random fields (CRFs) and Integer Linear Programming (ILP). Scalable synapse detection (i.e., the edges in our graph) is still an open problem. While solutions exist [11, 12], they were either developed for a dataset with different properties (e.g., isotropic, poststained), or have demanding computational requirements. Therefore, we developed our own lightweight, scalable synapse detector. 3. APPROACH To extract graphs from images, we first detect synapses and segment neural processes at a desired operating point, and link the results together to generate a graph. This result is evaluated using a new graph metric, which we describe below. 3.1. Processing Framework Our tools are built on a distributed processing framework which leverages the LONI Pipeline [13], and interfaces with the data and annotation services provided by the Open Connectome Project (OCP) openconnecto.me [14]. It includes an application programming interface (API) which implements our data standard for high resolution connectomics, and tools to enable rapid algorithm development while simplifying the challenge of running at scale. Our framework enables researchers to focus on developing novel image processing techniques without considering data management and processing challenges.
By leveraging our reusable, distributed computing tools, we are able to efficiently incorporate new methods by extracting only core algorithm code (often a small fraction of the original code base). This capability enables image processing researchers to build state-of-the-art algorithms without addressing cluster integration or scalability details. 3.2. Graph Estimation Pipeline Our approach transforms a image volume of cortical tissue into a wiring diagram of the brain. To assemble this pipeline, we begin with membrane detection [10], and then process those results to assemble neuron segments, using either Rhoana [7] or a watershed-based approach. These are the nodes in our graph. To find the graph edges, we develop a lightweight, scalable Random Forest synapse classifier. We combine texture (i.e., intensity measures, image gradient magnitude, local binary patterns, structure tensors) with biological context (i.e., membranes and vesicles). Synapse and neuron association is completed by mapping synapses (i.e., graph edges) to neurons (i.e., graph nodes) by finding the neuron labels that overlap most frequently with the paint from each synapse object. Metadata assigned to each object can be traversed to construct a graph [14], or the graph can be built directly at small scales. Output graphs are converted via a web-interface to a community compatible format of choice using MROCP [15], such as GraphML. This graph construction, optimization and assessment tool was implemented in LONI Pipeline and exists as a one-click pipeline. 3.3. Assessment Measures A variety of error measures have been proposed for connectomics (e.g., warping error, adjusted Rand index, variation of information [9]), but are limited by their focus on an individual subtask of the entire images-to-graphs pipeline. As we demonstrate, the optimal results for a subtask may not translate to optimal results for the overall pipeline. As shown in Figure 3, even small neuron segmentation errors that affect graph connections are potentially very significant in terms of the resulting graph, while large errors not
affecting topology may be much less significant. These small, significant errors occur frequently on narrow, fragmented spine necks, breaking connectivity between the synapse on the spine head and the parent dendritic shaft [7].
Fig. 4. A demonstration of the methods used to construct a line (edge-based) graph from a conventional node based network, by finding paths between edges in the original graph.
4. RESULTS
Fig. 3. Yellow objects represent synaptic junctions; other colors are different neurons. The left panel shows true connectivity; the right panel shows the effect of fragmenting neurons at the dendritic spine necks, which produces a very small change in segmentation error, but a dramatic impact to graph error. To assess graph error, we first form the line graph, which is the dual of the traditional graph, and represents connections (i.e., paths) between terminals. In this formulation, the synapses become the graph nodes and the graph edges are constructed from the neurons (Figure 4). Line graphs are constructed for both the estimated L{Gestimated } and true L{Gtrue } neuronal graphs, resulting in square, undirected, binary upper triangular matrices. To directly compare the graphs, we augment both matrices so that every node (i.e., synapse) in both graphs has a direct correspondence. We first find synapses in common by overlapping synapse annotations, and then add synapses absent in one graph, but present in the other, to both the true and test graphs. This graph correspondence is much easier to determine in the line graph (since synapses are small, compact objects) than in the traditional graph formulation (which often contains many neuron fragments). We compute our graph error by finding the Frobenius norm of the difference between the estimated and true augmented line graphs (Eqn 1). Gerr = ||L{G∗true } − L{G∗estimated }||F
(1)
Our metric is interpretable, because true connections are the non-zero common entries. Furthermore, each incorrect entry represents a false positive (spurious connection) or false negative (missed connection). A connection between two synapses in a line graph is equivalent to those synapses being coincident on a neuron. This metric has scalability advantages over voxel-based metrics, because it can be easily computed on large volumes and can be used to characterize common errors.
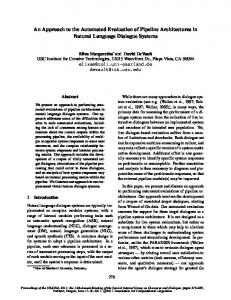
The images-to-graphs pipeline allows us to address the question of graph quality and begin to optimize results. We take a systems view of the connectomics problem and evaluate a set of hyper-parameters (i.e., both entire algorithms and parameters within algorithms) to determine the best operating point. In principle, parameters across all modules can be explored; we limited our experiment to variations in neuron segmentation and synapse detection methods for simplicity. 4.1. Data Our experiments utilize a publicly available volume of mouse somatosensory (S1) cortex, imaged using scanning electron microscopy [16]. All images were color corrected [17] and downsampled by a factor of two in the imaging plane. Although we restricted our experiments to a small region with existing ground truth (1000×1000×100 voxels), the pipeline is built into a scalable framework capable of processing larger volumes. 4.2. Results We used our pipeline to examine the interaction and optimal settings of the segmentation algorithm and the synapse detector. Our evaluation varied neuron segmentation parameters (e.g., membrane strength, thresholds, number of segmentation hypotheses). Our synapse operating points were chosen by sweeping over size and probability thresholds. All combinations of these parameters were tested, and the results are displayed as a matrix in Figure 5. We examined 1300 possible graphs, requiring approximately 5,400 cluster jobs and 3TB of data manipulation. After synapses and neurons were combined to construct a graph, we evaluated the line graph error. A permutation test was run to compute the null distribution of this test statistic. Specifically, we calculate the graph error by uniformly sampling a random graph with the same line graph density as the observed graph for B=10,000 samples. The p-value
Fig. 5. Experimental Graph Based Error. 1300 graphs were created by combining 13 synapse detector operating points (rows) with 100 neuron segmentation operating points (columns). The rows are ordered by synapse F1 score, and the columns by segmentation adjusted Rand index. The first row and column represent truth, and the upper left corner of the matrix has an error of 0. Cell color reflects graph error (clipped to show dynamic range), with a dark blue indicating lowest error and red indicating highest error. Values shaded in gray are not significant; the optimal points (tie) are circled in black. is then the value of the resulting cumulative distribution function, evaluated at the test-statistic value of the observed graph. We chose a p-value significance threshold of less than 0.0001; non-significant operating points are shown in gray in Figure 5. The results in Figure 5 show all the results, in sorted synapse and segmentation error order. Each cell in the matrix represents a single graph, and the optimal result is circled in the table. It is clear that constructing the best graph is more complicated than simply choosing the point with the best synapse F1 score and lowest segmentation error. Figure 6 further demonstrates the non-linear relationship between graph error and intermediate measures. By considering the overall problem context, we can select and tune the available algorithms to determine the best result.
5. DISCUSSION We have demonstrated the first framework for estimating brain graphs at scale using automated methods. We recast the problem as a graph estimation task and consider algorithm selection and parameter tuning to optimize this objective by leveraging a novel graph error metric. This work provides a scaffolding for researchers to develop and evaluate methods for the overall objective of interest. We evaluate our pipeline across a set of parameters and modules, leveraging a combination of published methods and novel algorithms. Additional insights may be gained at larger scales and through additional optimization. Although our error metric currently considers only binary, unweighted graphs, there are opportunities to extend this to apply to attributed graphs, as well as to weight the metric by error types (e.g., number of false positives or false negatives). Automated results do not need to be perfect to draw statistical conclusions, and errorful graphs may be used as the basis for inference and exploitation of “big neuroscience” challenges [18]. Bias in errors is another important factor in constructing exploitable graphs that is not fully explored in this manuscript. With the ability to efficiently compare combinations of different algorithms and operating points, we can begin to answer the question of graph quality and how to optimize the results. Supplementary material can be found at http://www.openconnecto.me/i2g/ 6. ACKNOWLEDGEMENTS
Fig. 6. Plots showing the variability of graph error with segmentation error (top) and synapse error (bottom), for the rows and columns associated with the best operating point.
The authors wish to thank Dennis Lucarelli, Michael Pekala, Aurora Schmidt, and Kunal Lillaney for their help in algorithm development and infrastructure support. We also thank Bobby Kasthuri, Daniel Berger, and Jeff Lichtman for providing electron microscopy data and truth labels.
7. REFERENCES [1] V. Braitenberg and A. Sch¨uz, Anatomy of the cortex: Statistics and geometry. Springer-Verlag Publishing, 1991. [2] V. B. Mountcastle, “Modality and topographic properties of single neurons of cat’s somatic sensory cortex.” Journal of neurophysiology, vol. 20, no. 4, pp. 408–34, Jul. 1957. [3] M. Helmstaedter, K. L. Briggman, and W. Denk, “Highaccuracy neurite reconstruction for high-throughput neuroanatomy,” Nature Neuroscience, vol. 14, no. 8, pp. 1081–1088, 2011. [4] D. D. Bock et al., “Network anatomy and in vivo physiology of visual cortical neurons,” Nature, vol. 471, no. 7337, pp. 177–182, 2011. [5] S.-y. Takemura et al., “A visual motion detection circuit suggested by Drosophila connectomics,” Nature, vol. 500, no. 7461, pp. 175–181, Aug. 2013. [6] Y. Mishchenko et al., “Ultrastructural Analysis of Hippocampal Neuropil from the Connectomics Perspective,” Neuron, vol. 67, no. 6, pp. 1009–1020, 2010. [7] V. Kaynig-Fittkau et al., “Large-scale automatic reconstruction of neuronal processes from electron microscopy images,” In Review, vol. 1, 2013. [8] C. Sommer, C. Straehle, U. Koethe, and F. Hamprecht, “ilastik: Interactive Learning and Segmentation Toolkit,” 8th IEEE International Symposium on Biomedical Imaging (ISBI 2011), 2011. [9] J. Nunez-Iglesias et al., “Machine learning of hierarchical clustering to segment 2D and 3D images.” PloS one, vol. 8, no. 8, p. e71715, Jan. 2013. [10] D. D. Ciresan, A. Giusti, L. M. L. Gambardella, and J. Schmidhuber, “Deep neural networks segment neuronal membranes in electron microscopy images,” in Advances in neural information processing systems, 2012, pp. 2843–2851. [11] A. Kreshuk et al., “Automated detection of synapses in serial section transmission electron microscopy image stacks.” PloS one, vol. 9, no. 2, p. e87351, Jan. 2014. [12] C. Becker, K. Ali, G. Knott, and P. Fua, “Learning Context Cues for Synapse Segmentation in EM Volumes,” Medical Image Computing and Computer Assisted Intervention, vol. 7510, no. Pt 1, pp. 585–592, Jan. 2012.
[13] D. E. Rex, J. Q. Ma, and A. W. Toga, “The LONI Pipeline Processing Environment,” NeuroImage, vol. 19, no. 3, pp. 1033–1048, Jul. 2003. [14] R. Burns et al., “The Open Connectome Project Data Cluster : Scalable Analysis and Vision for HighThroughput Neuroscience Categories and Subject Descriptors,” 2013. [15] D. Mhembere et al., “Computing Scalable Multivariate Glocal Invariants of Large (Brain-) Graphs,” IEEE GlobalSIP, 2013. [16] K. Hayworth, N. Kasthuri, R. Schalek, and J. Lichtman, “Automating the Collection of Ultrathin Serial Sections for Large Volume TEM Reconstructions,” Microscopy and Microanalysis, vol. 12, no. S02, pp. 86–87, Jul. 2006. [17] M. Kazhdan et al., “Gradient-Domain Processing for Large EM Image Stacks,” vol. 1, pp. 1–7. [18] C. C. E. Priebe, D. L. D. Sussman, M. Tang, and J. T. Vogelstein, “Statistical inference on errorfully observed graphs,” arXiv preprint arXiv: . . . , pp. 1–30, Nov. 2012.