An Automated Image Processing Pipeline for High-Throughput Phenotyping with Unmanned Aerial Systems. Xu Wang, Daljit Singh, Richard Brown, Jesse ...
An Automated Image Processing Pipeline for High-Throughput Phenotyping with Unmanned Aerial Systems Xu Wang, Daljit Singh, Richard Brown, Jesse Poland Department of Plant Pathology, Kansas State University, Manhattan, KS
METHODOLOGY
BACKGROUND High-throughput phenotyping (HTP) can provide orders of magnitude more measurements than traditional phenotyping practices. Using a low-cost Unmanned Aerial Vehicle (UAV) integrated with imaging devices can generate high geospatial and temporal resolution of plant measurements through multiple crop stages. Current commercial software or image processing providers, especially for photogrammetry processing, lack functions of automatic geo-correction using ground control points (GCP), radiometric calibration, or require human intervention to implement the complete image processing procedures.
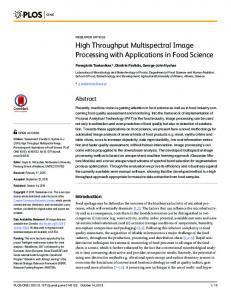
Radiometric Calibration
Use the MicaSense Calibrated reflectance panel (CRP) with designated Albedo values and the MicaSense RedEdge camera radiometric calibration model1 to convert the pixel value to reflectance value.
GCP detection and geo-coordinates assignment
OBJECTIVE Develop an automated image processing pipeline for photogrammetry processing of aerial images captured by the MicaSense RedEdge multispectral camera. Table 1. Comparisons between commercial software and the proposed pipeline for photogrammetry processing MicaSense Atlas Pix4D Mapper Agisoft PhotoScan Proposed Pipeline Radiometric calibration Ground control Multi-band Orthomosaic Photo
Calibration panel, Calibration panel, Will be available in v1.4, Calibration panel, detected at uploading, manually selected the manually generate masks automatically detected, multiple images supported panel area, single image of panels, single image multiple images supported Not supported
Manually imported
Manually imported
Multi-band geo-Tiff of Multi-band geo-Tiff, georeflectance, pre-selected Multi-band, uncalibrated Tiffs of RGB and specific geo-Tiffs of VIs and single geo-Tiffs VIs by requirement channels
Automatically detected and imported Multi-band, calibrated geo-Tiffs
Digital Elevation Relatively low resolution Model (DEM)
Resolution customizable
Resolution customizable
Resolution customizable
Automation and customization
Automated by commands (only Enterprise version), customizable
Automated by Python scripts, customizable
Automated by Python scripts, customizable
Fully automated, not customizable
Use the 12 in square white tiles as GCPs arranged around the field. Detect the square shapes in the binary images converted from the blue-band raw images. Convert the detected GCP pixel coordinates to the real-world coordinates. Assign the closest surveyed GCP coordinates to the detected GCP. After assigning all GCPs to the aligned sparse point cloud model, remove the GCPs with high pixel error values, leaving the correct GCPs for camera position optimization.
Image alignment, orthophoto and DEM generation Use the PhotoScan Python library2 (Version 1.3.2).
Pipeline source code – github.com/xwangksu/uaBatch
VALIDATION Materials
Grain sorghum population field (666 2-row plots) on Ashland Farm in Manhattan Kansas, in 2017
Methods
Field mapping using DJI M100 with MicaSense RedEdge camera. Select the images collected on 11, 27, and 49 days after planting (DAP). Generate orthophotos by Pix4D and the pipeline program. Extract plot-level Normalized Difference Vegetation Index (NDVI).
Results
METHODOLOGY
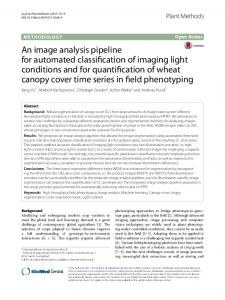
11 DAP
49 DAP
27 DAP
Figure 2. Comparison of plot-level NDVI values generated by Pix4D and the pipeline program. Images left to the diagrams were the RGB orthophotos of 11, 27, and 49 DAP. The diagrams presented the correlation (upper triangle), scatter plot (lower triangle) and histogram (diagonal) of the plot-level NDVI.
CONCLUSION The pipeline program is able to implement photogrammetry processing automatically. The plot-level vegetation indices (VIs) extracted from the ortho-photos generated by the pipeline were highly correlated with the VIs generated by the commercial software. The pipeline structure can be applied to process aerial images captured by other cameras (i.e., thermal cameras).
REFERENCES 1. 2.
Figure 1. Pipeline modules and workflow
RedEdge Camera Radiometric Calibration Model, November, 2017. https://support.micasense.com/hc/enus/articles/115000351194-Rededge-Camera-Radiometric-Calibration-Model PhotoScan Python Reference Version 1.3.2, May, 2017. http://www.agisoft.com/pdf/photoscan_python_api_1_3_2.pdf