An automatic and rapid system for grading palm bunch using a Kinect camera. 1. 2. Burawich Pamornnak1, Somchai Limsiroratana1, Thanate Khaorapapong2,.
1
An automatic and rapid system for grading palm bunch using a Kinect camera
2 3
Burawich Pamornnak1, Somchai Limsiroratana1, Thanate Khaorapapong2,
4
Mitchai Chongcheawchamnan1 and Arno Ruckelshausen3
5 6
1
7
Agrotonics and Biotronics Research Unit, Prince of Songkla University, 90112, Thailand 2
8
3
Faculty of Engineering, Prince of Songkla University, 90112, Thailand
Faculty of Engineering and Computer Science, Hochschule Osnabrueck, 49076, Germany Keywords : Depth image, NIR reflectance, multi-sensing, field work, phenotyping
9 10 11
Abstract
12
Oil palm, one of the most important economics crop, provides crude palm oil (CPO) which produces
13
edible oil and several consumer products. Palm price is negotiated depending on some key parameters of fresh
14
fruit bunch (FFB). These parameters are bunch appearances (such as color or size) and weight which have been
15
presumably related to oil extraction rate (OER). In a trading market, inspectors have been hired by a buyer to
16
grade palm bunches in two groups, accept or reject. These inspectors classify a palm bunch with visual inspection
17
based on their experience. The classification result is skeptical and very low reliable if much workload.
18
A automatic system design for trading market to grade FFB depending on its quality is developed. Several
19
palm features are extracted from RGB, near infrared, and depth images capturing with a Microsoft Kinect camera
20
version 2.0. The camera is installed in a light-controlled environment on the conveyor line. To make a system
21
operate automatically, algorithms for object detection and conveyor controlling have been developed . Two
22
algorithms for classification are developed. The first algorithm is called a volume integration scheme (SVIS) to
23
measure the relative volume of palm bunch. Based on three features collected from Kinect camera, RGB, near
24
infrared snapshots, and calculated relative volume. The second algorithm is developed to classify palm bunch into
25
three grades (L-Grade, M-Grade and H-Grade) based on oil content from Soxhlet extraction. The accuracy
26
performance of the system for grading palm bunch achieves 83% accuracy within 6 seconds per one sample. This
27
shows the possibility to use the system in a trading market for pricing by quality. This shows the possibility to use
28
the system in a trading market. The system can also applied to mobile systems, such as agricultural machines or
29
autonomous robots in the future.
30 31
1.
Introduction
32
Oil Palm (Elaeis guineensis) is an important oil plant since it provides the highest yield per unit area of
33
vegetable oil compared to other sources. Main product of oil palm is palm fruit which forms in a bunch. Crude
34
palm oil (CPO) and crude palm kernel oil (CPKO) are produced by milling palm fruit. These CPO and CPKO are
35
used in various consumer products such as food and oleochemical industry (Basiron, 2007). CPO can also be
36
produced biodiesel substrate (Bari et al., 2002; Nikhom and Tongurai, 2014) which will reduce consumption of
37
fossil energy.
38
Though oil palm has been planted in several countries around the world, the supply chain of palm in
39
these countries are different. In Malaysia and Indonesia which have been two most cropped countries for many
40
years, each plantation area is rather large and owned by entrepreneurs. Crop management is very well performed.
41
Fresh fruit bunches (FFBs) have continuously been supplied to milling factories owned by the same entrepreneurs.
42
Unlike two countries mentioned above, small plantations in Thailand or some countries in Africa have been
43
individually owned by agriculturists. A plantation area is then small and normally is less than 50 hectares.
44
Therefore, upstream activities in the supply chain such as FFBs transportation and milling factory have been
45
operated by different agencies, not agriculturist group a middle-man. During harvest time, agriculturists collect
46
FFBs from their plantations and take to a nearby trading market called a palm yard market. A yard market owner,
47
a middlemen, buy FFBs from agriculturists. These middlemen store FFBs in agriculture warehouses. When the
48
stock of FFBs in each warehouse is sufficiently large or reach to a certain point which is worth to sell, they will
49
transport their stock to milling factories for selling. Pricing of FFBs is determined by its qualities. The inspector
50
will check history record of these agriculturists where the pricing mechanism is mainly related to FFB appearances
51
such as color, size, etc., and weight of FFB. These inspectors have experiences and knowledge to justify whether
52
each FFB should be “accept” or “reject” for trading. Everyday inspectors have a large workload because there are
53
several thousands of FFBs. With these reasons, inspectors have to spend a short time to classify each group of
54
FFBs. Because of large load, tense, and stress from workload, human classification results are prone to be biased
55
as well as unreliable (Abbas et al., 2005; Pamornnak et al., 2013; Yeow et al., 2010).
56
Generally there are several key qualities of FFBs. The key quality that milling and refinery factories
57
desire to know is OER in each FFB. This is because it relates to yield for producing CPO and CPKO. Currently
58
OER of FFB is determined by repeated washing the mesocarp fiber in glassware with boiled hexane solvent. The
59
OER can determined by the ratio between weight of washed and unwashed fiber, called “Soxhlet extraction”
60
technique. This technique has been settled as the standard method and widely accepted in palm industry as the
61
most accurate technique to measure OER (Luque de Castro and Garcıá -Ayuso, 1998; Luque de Castro and Priego-
62
Capote, 2010). However, it takes 24 hours or more, requires chemical material (hexane solvent), expensive
63
equipment (soxhlet glassware, heating machine and etc.), and well-trained laboratory staffs. Hence it is not
64
suitable for palm trading. Hence this is not suitable to some countries that have a middle-man system in the supply
65
chain of palm.
66
In the past decade, a rapid and non-destructive technique based on analyzing crop appearances called
67
phenotype technique was proposed to investigate bio-chemical interaction in crop. Imaging processing technique
68
and artificial intelligence are the core technologies used for observing, determining the characteristics of plants
69
e.g. leaf and fruit color and so on (Kumar et al., 2015), and making decisions. Several research works applying
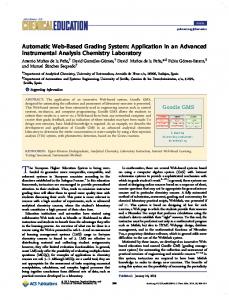
70
image processing to palm problem were proposed. Among these, there are research works proposed for grading
71
palm fruit and determining OER in fruit using mathematics model and artificial intelligence technique. Image
72
processing based on RGB and HSI color models were proposed (Abdullah et al., 2001; Balasundram et al., 2006;
73
Choong et al., 2006; May, Z. and Amaran, M. H., 2011). Recently, an application for determining OER in palm
74
fruit with an automatic color correction was developed for a mobile device platform (Pamornnak et al., 2015).
75
Based on hue-saturation color model, a neural network classifier was proposed for palm grading. There are
76
research works using image processing for palm bunch. An algorithm based on hue color model for predicting
77
harvest time (Razali et al., 2009, 2011) was developed for a mobile device. Several authors proposed algorithms
78
for grading palm bunch based on several color models; RGB color model (Alfatni et al., 2008), HSI model (Tan
79
et al., 2010), and RGB color model with multi-layer neural network classifier (Fadilah et al., 2012). A simple
80
classification system, accept or reject, for palm bunch based on an image color model was designed. The system
81
was specifically designed to compatible with a conveyor line (Makky and Soni, 2013). Hyperspectral imaging
82
technique working with invisible light and NIR sensors were used for classifying palm bunch (Junkwon et al.,
83
2009). A fiber optic probe equipped with a NIR spectrometer was proposed to estimate oil and moisture content
84
(Rittiron, R. et al., 2012). A portable NIR spectrometer was proposed for estimating ripeness degree and oil
Commented [BP1]: [1]
85
content in palm bunch. A neural network and sum of weighted-wavelength reflectance (Makky and Soni, 2014)
86
were proposed for bunch classification. These works use only one feature to determine the quality.
87
In the field work, various environment affected to agriculture product such as light, moisture, weather
88
and so on. So the phenotyping features from a visible range RGB sensor such as color and texture may not enough.
89
A phenotyping system needs multiple data from difference sensors to compensate these varying, for example, 3D
90
cameras, RGB cameras, spectrums cameras and so on (Busemeyer et al., 2013; Li et al., 2014; Ruckelshausen et
91
al., 2009; Ruckelshausen and Busemeyer, 2015). For 3D camera, the 3D time-of-flight (ToF) camera is
92
appropriate in various research area with minimized error, low computation time, compact design and low power
93
consumption (Foix et al., 2011). For agricultural product the ToF cameras has been continuously applied for
94
phenotyping and quality inspection. For example, leaf segmentation applications (Kazmi et al., 2012; Shao et al.,
95
2014; Xia et al., 2015), 3D image reconstruction system to determining a sugar beet taproot shape volumetric
96
and leaf area (Paulus et al., 2014), Ground based crop localization by using point cloud data (Wong and Lim,
97
2012) and so on. The cheap price ToF depth sensor, RGB and Infrared image sensors have been integrated in
98
RGB-D camera, Microsoft Kinect (Zhang, 2012), which was designed for gaming application (Leyvand et al.,
99
2011). The 3D applications in various research areas have been proposed with Kinect. For example, the
100
transformed Kinect coordinate system to real world common coordinate and the 3D structure was combined with
101
stereo vision image (Smisek et al., 2011), a virtual 3D model construction from physical object (Jota and Benko,
102
2011), 3D model reconstruction based on GPU pipeline processing (Izadi et al., 2011), human shape scanning
103
(Cui and Stricker, 2011; Tong et al., 2012; Weiss et al., 2011), human detecting by calculating head parameters
104
(Xia et al., 2011) and hand tracking and gesture recognition (Frati and Prattichizzo, 2011; Ren et al., 2011), robot
105
control and localization (Ganganath and Leung, 2012; Stowers et al., 2011) and so on.
106
Though many research works have been proposed but none of them suits for field applications such as a
107
trading market case. In such applications, several disturbances from environment such as light, moisture,
108
temperature and so on, do affect to sensing parameters and need to be encounter. On one hand the functionality
109
of sensors with different selectivities (such as 3D and spectral characteristics) is required, on the other hand the
110
integration of these multi sensor option in a single sensor system would reduce complexity (Strothmann et al.,
111
2017). In this paper, we first propose an automatic system based on three sensing parameters for grading palm
112
bunch. Parameters relating to quality in palm bunch of interest will be measured from multiple sensors which are
113
integrated in a single device. A Microsoft Kinect 2.0 camera not only fits this but also is a low-cost solution. The
114
proposed parameters obtaining from this camera are volume, color appearances, and reflectance intensity of palm
115
bunch.
116
Section 2 illustrates algorithms for camera calibration and volume computation and the design detail of
117
the proposed system. The mechanism and performances of these algorithms with several palm bunches will be
118
discussed in Section 3. The system is implemented and experimented. Finally, the paper will be concluded in
119
Section 4.
120
2. Materials and Methods
121
In this section, the palm grading system will be described. Microsoft Kinect camera is the main sensor
122
for acquire three features, RGB image, infrared image and point cloud. An algorithm for camera calibration and
123
computing bunch volume will be described first, following by hardware-software system design and the algorithm
124
for grading an oil palm bunch into three groups (L-Grade, M-Grade and H-Grade), respectively.
125
2.1 Camera Calibration and Coordinate Conversion
126
Due to the real world coordinate of palm bunch object is needed for the bunch volume computation. We
127
can get real world depth value ( z ( x , y ) in millimeters) for each pixel
128
of Kinect camera directly. The transformation of the position from image space
129
( x, y) is needed. In this subsection, we present the scheme, which calibrates a camera and transforms the position
130
of image
131
rows of white and black squares of 24 mm (OpenCV dev team, 2017) is used. The transformation can be explained
132
using the thin lens and pinhole camera model (Favaro and Soatto, 2007; Wöhler, 2012) as shown in Fig. 1. The
133
image distance from the image plane (camera array sensor) to the lens of a camera, ( s ' ) can be calculated from,
134
c( px) s ' ( px) o(mm) s (mm)
135
where o is the width (or length) of an object in millimeters, c is the width (or length) of object in pixels, and s
136
is the object distance (in mm.) from lens to the object.
( x' , y ' ) in image coordinate from depth value ( x' , y ' ) to real world space
( x' , y ' ) to real world coordinate ( x, y) . In the calibration, a chessboard which has 10 columns and 7
(1),
Commented [BP2]: [2]
137 138
Fig 1. Thin lens model applied to the calibration and conversion scheme
139
For the calibration setup. A chessboard of 10x7 squares is used. Each row of the chessboard consists of
140
5 black and 5 white squares. Each side of a square, either white or black, has length 24 mm. A Kinect camera 2.0
141
was mounted on a camera stand as shows in Fig. 2(a). The camera lens was specifically set up such that the camera
142
is positioned over a calibration chessboard with reference depth ( d 0 ). It is very crucial that the camera has to
143
align in parallel with the chessboard. Fig. 2(b) shows a snapshot of a chessboard in an isometric view. A set of
144
corner pairs in the chessboard is defined. There are 48 corner pairs as shown in Fig. 2(b). The vector length (in
145
pixel) of any corner pair n of a chessboard snapshot
cn has to be determined.
146 147
(a)
148 (b)
149 150
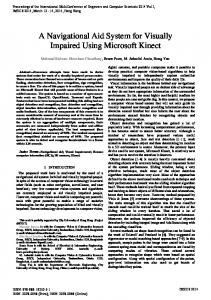
Fig 2. Calibration and conversion scheme: (a) calibration setup and (b) parameters definition.
151
In our experiment, the complete procedure in this scheme is illustrated in Fig. 3. We use the average
152
value of the image distances from 48 corner pairs as the calibrate parameter for the coordinate transformation
153
process for a whole image scene. From Fig. 1, the average image distance, N
s'
154
cn sn l
s' , is calculated from,
(2),
n 1 sq
N is the number of corner pairs which is 48, l sq is the length of each square side which is 24 mm., c n is
155
where
156
the length for each corner pair in pixel, and
157
each corner pair. This parameter defined in Fig. 2 (b) can be measured from the depth value of the Kinect camera
158
directly.
s n is a distance (in mm.) between the chessboard and the camera for
159 160
Fig 3. The procedure of calibration and conversion scheme.
s , any image pixel ( x' , y ' ) in the image space is transformed with 1-1 mapping to a real-world
161
After obtaining
162
space ( x, y ) as follow,
z' x s' y 0
163
164
Where
0 x' z ' y ' s'
(3),
z ' is the depth value which is measured from Kinect camera for each pixel.
165
2.2 Volume Computation
166
In this subsection, a simple scheme called Simple Volume Integration Scheme (SVIS)for computing
167
volume using a Kinect camera is proposed. The algorithm computes a volume of any object in the real-world
168
space data from the procedure illustrated in Fig. 3. The scheme calculates volume by considering that any object
169
is formed with several small cuboids. All cuboids have top and bottom rectangle facets with
170
long as shown in Fig. 4.
x wide and y
171 172
Fig 4. Principle of SVIS algorithm
173 174 175
From Fig. 4, a Kinect camera is positioned above the object of interest along the z-axis. The volume of the
i th cuboid, v(i ) , is computed from, v(i ) x y z (i )
176
(4),
z (i ) is the height of the considering cuboid.
177
where
178
Based on numerical integration technique, the SVIS algorithm calculates volume by summing the volumes of all
179
small cuboids. Hence
VT , a total volume of the object of interest, is defined by VT i v(i )
180 181
where i =1 to N.
182
Let
(5),
N is the number of cuboids in the integrated volume, from (4) and (5), VT (x y )i z ( i )
183
184
In Fig. 5, the top facet of the
(6)
i th cuboid has four vertexes, ( x, y ) , ( x x, y) , ( x, y y) , and
185
( x x, y y) . Let d 0 be the reference depth which is defined in Fig. 5 and d x, y be the depth value of a
186
vertex
187
the Kinect camera by,
( x, y ) . The height of the i th cuboid, z (i ) , can be determined from depth value measured by sensors in
hx , y d 0 d x , y
188
(7)
189
hx x , y , hx , y y , and hxx , yy can be similarly computed using (7). Based
190
The heights of three other vertexes,
191
on trapezoidal rule, we propose to choose z (i ) from the minimum height among these values,
192
z(i ) min( hx , y , hxx , y , hx, yy , hxx , y y )
193 194 195
With (8), the SVIS algorithm will determine
(8)
z (i ) for all cuboids. After obtaining z (i ) , the volume
VT will be computed from (6).
196 197
Fig 5. Height calculation for each cuboid.
198
2.3. Palm Grading Hardware and Software System
199
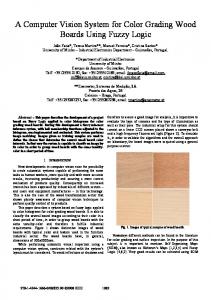
In this subsection, the hardware and software design of system for grading palm bunch is presented. The
200
design is developed based on the algorithm presented in subsection 2.2. Fig. 6(a) shows a hardware diagram of
201
the design. It consists of three basic parts, a conveyor belt, a module for image acquisition, and a control module
202
for the conveyor. A conveyor belt is proposed for interfacing a conveyor line in a milling plant. A V-shaped belt
203
made of rubber is driven with a 90W AC motor with a chain-drive system to allow 75 kg maximum load. For an
204
image acquisition module, a Microsoft Kinect 2.0 (1920×1080 pixels for RGB and 512×424 pixels for point cloud
205
and infrared images) is installed above the conveyor line for 1 meter to capture a top view. The system detail is
206
shown in Fig. 6(b). Three image types; RGB, infrared and point cloud; are simultaneously recorded. Two light
207
bulbs (6500K 783 Lumens, CRI 80) were installed beside the Kinect 2.0 camera to provide a light-controlled
208
environment. The brightness condition is controlled by the control module. A light dimmer is used to turn the
209
light on and off as well as lightness adjustment. The third part is a conveyor control module. It consists of a motor
210
speed control module and a microcontroller. An emergency stop button is added for safety issue.
211
212 213
(a)
214 215
(b)
216 217
(c)
218
Fig 6. A system details, (a) hardware design, (b) hardware-software system diagram and (c) photographs.
219
We designed the system to be a personnel computer (PC) based design as shown in Fig. 6(b). The Kinect
220
camera interfaces the PC via USB 3.0. The control module for conveyor interfaces the PC via a serial port. The
221
software was programmed using Microsoft Visual C# 2015 on a Microsoft Windows 10 platform. We develop
222
algorithms using two libraries, OpenTK 1.1.4 for 3D point cloud drawing and EmguCV (OpenCV 2.4.10) for
223
RGB and IR image processing. The system software contains three modules. They are modules for detecting palm
224
bunch, controlling feeder and grading palm bunch. Fig. 6(c) shows two photographs of the complete system. The
225
top-view photograph shows the Kinect camera is installed 1 meter over the conveyor belt. The camera is installed
226
between two light bulbs. A computer as shown in the side-view is for controlling and classifying palm bunch.
227 228
2.4. Bunch Detector and Feeding Control
229
For the image processing view, the object detection is the important process. In this subsection, we
230
propose a simple algorithm for bunch detection on the conveyor line. The algorithm is developed based on an
231
image processing technique. Due to the difference color responsibility between oil palm bunch and conveyor line
232
and low light interference of near infrared sensor, we selected the near infrared feature for oil palm bunch detector.
233
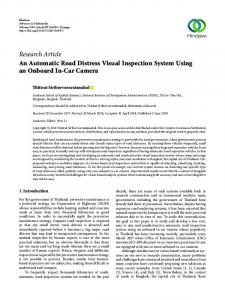
Fig. 7(a) shows 4 algorithm steps. First, we use the near infrared sensor in the Kinect camera to capture an infrared
234
image of palm bunch. This infrared image is converted to a binary image with 10% threshold value for split the
235
region of interest (ROI) from the image scene in the second step. White color pixel means the bunch object
236
captured from the camera. Spikes around palm bunch and some part inside palm bunch image in Fig. 7(a) are
237
eliminated by erosion technique in the third step. After this step, small black areas inside bunch image are filled
238
with white area using the dilation technique. This completes the whole volume of the bunch. The final image at
239
the last step in Fig. 7 (a) is obtained called “mask image”.
240
To make sure that the system takes a whole bunch snapshot, a centroid position of the mask image is
241
shown in Fig. 7(b) was used to as a reference point referred to the vertical line of Kinect camera view. From this
242
point, a zone for capturing an image and the frame width are set. The conveyor belt is controlled at optimum speed
243
of 0.125 m/s. Palm bunch loaded by the conveyor belt moves and stops at the “stop zone”. This stop zone is a
244
region which is 5% of the frame width. Then an image snapshot of palm bunch is taken within 5 seconds and the
245
belt will load a new bunch to the “stop zone”. In addition, the mask image is used ROI extraction. The ROI
246
images, RGB and near infrared bunches were extracted by AND or multiply operation between image mask and
247
image scene as shows in Fig. 7(c). These images are ready for the feature extraction in the next step.
Commented [BP3]: [3]
Commented [BP4]: [4]
248 249
(a)
250 251
(b)
252 253
(c)
254
Fig 7. Conveyor feeding control procedure, (a) a bunch detector process, (b) conveyor control process
255
and (c) ROI snapshots.
256 257 258
259
2.5. Features for Grading
260
This subsection describes algorithms for grading palm bunch. Ripening mechanism in palm bunch will
261
be first described, following with the algorithms for determining features and grading palm bunch using features
262
extracted from three images at a time. In this work, we propose to classify palm bunch into three groups with
263
different weights. The weight of a palm bunch is one of the parameters to be determined. We propose to predict
264
weight from volume because a weighing system installed at a conveyor line is complicated while weighing a palm
265
bunch before loading to a conveyor line has to interrupt. The volume and other parameters are determined to for
266
a function called quality processing function (QPF). This function is for classification and will be programmed
267
with MATLAB® R2016a (MathWorks, Natick, MA).
268
Relative volume index
269
This part describes the relationship between weight and volume (density) of palm bunch which relate to
270
the quality of palm bunch. The fruit ratio of a bunch, which is the weight of all fruit in a bunch and the weight of
271
the whole bunch is determined (Harun, M.H., and Noor, M.R.M., 2002). To investigate the relationship of weight
272
and fruit ratio, 45 palm bunches of three groups were experimented where each group with three different sizes
273
(small, medium, and large) has 15 bunches. The weights of three groups are 4-10 kg, 10-18 kg, and >18 kg for
274
small, medium, and large respectively. From the experiment, the fruit ratios of these groups are listed in Table 1.
275
Table 1. Fruit ratios of 45 bunches Group
Bunch weight (kg)
Average Fruit ratio (%)
S.D.
small
4-10
68
0.073
medium
10-18
70
0.092
large
>18
73
0.069
276 277
To determine the relationship between weight and volume of palm bunch, we apply the SVIS algorithm
278
to determine a volume of palm bunch. Let
279
bunch is symmetric over
280
obtained from the Kinect camera. We propose a parameter called relative volume index which is a number of unit
281
cubes in a targeted bunch. Volume of a unit cube is 0.005
( x0, y0 , z0 ) is the centroid of palm bunch, we assume that a palm
z z1 plane. Fig. 8 shows a 2.5D point cloud image of a half-section of palm bunch
m3 .
282
The SVIS was tested with 90 training sample bunches of three bunch groups. Fig. 9 shows the calculated
283
volume index related to the weight of palm bunch. From Fig. 9, the weight of a palm bunch correlates well with
284
the relative volume index. The correlation coefficient is
285
can be used to predict weight of a palm bunch.
R 2 = 0.911. This means that the relative volume index
286 287
Fig 8. An 2.5D point cloud view of oil palm bunch.
288 289 290
Fig 9. The relationship between the relative volume index and bunch weight.
Average Hue and Average Infrared Intensity
291
Grading palm bunch from its volume or weight is not sufficient. In many cases, a ripe palm bunch with
292
small weight contains oil content more than palm bunches with larger weight. Some physical profiles of palm
293
bunch should be utilized. It is well known that light reflectance of palm fruit is related to its ripening interval
294
which in turn the oil content (Abdullah et al., 2002; Makky and Soni, 2014). Ripening mechanism of oil palm
295
depends on the biological processes. During maturation, chlorophyll and anthocyanin in unripe fruit absorbs
296
visible light at 430, 530 and 670 nm wavelength (Tan et al., 2010). Therefore the color of palm fruit becomes
297
deep violet-black. During ripening, oil and carotenes which contribute yellow-orange-red colors (Mortensen,
298
2006) in the mesocarp layer increase (Tranbarger et al., 2011) while anthocyanin in the fruit drops (Hazir et al.,
299
2012). This makes color of palm fruit bunch becomes reddish-orange in -10 to 70 degree hue range (Tan et al.,
300
2010). Color gradient of fruit is specific which its characteristics can be described into small fruit part (Junkwon
301
et al., 2009; Pamornnak et al., 2015). Fig. 10 shows the example of ripe and underripe oil palm bunches, the
302
average hue value from RGB image achieves 36 degree which lower than underripe bunch which achieves 46
303
degree.
304 305
Fig 10. The hue value from RGB image of ripe and underripe bunch.
306
With the camera setup as shown in Fig. 6, a top-view image of palm bunch is taken. The difference in
307
reflectance index of invisible light in 800-1,000 nm wavelength for each ripeness duration is clearly observed.
308
We measured the wavelength of Kinect 2.0 infrared source using a miniature fiber optic spectrometer from
309
StellarNet Inc. It was found that the wavelength of infrared sensor in a Kinect camera responses in this wavelength.
310
Therefore infrared and RGB images obtained from a Kinect 2.0 camera can be applied to determine parameters
311
for QPF.
312 313
(a)
314 315
(b)
316
Fig 11. The relationship between bunch OER and average (a) hue and (b) infrared intensity.
317
The experiment starts with loading palm bunches to the system. Infrared and RGB images were obtained
318
from the Kinect camera. For each bunch, the average hue and average infrared intensity were computed from both
319
image types. Fruit samples obtained from different part of each bunch were collected and Soxhlet Extraction
320
method were used to measure their OER values. The average value of these OER were calculated and to represent
321
the OER of the bunch.
322
Fig 11(a) and (b) show average hue color (degree) and average infrared intensity with the average OER
323
of palm bunches. There are 90 bunches, from small to large size (7-28 kg). From both figures, it is shown that the
324
characteristics of both graphs are difficult to describe with a simple function.
325
Three features
326
In this part, three features which are average hue color (H), average infrared intensity (IR) and relative
327
volume index (V), are used to form a two-variable function for grading palm bunch. In this paper, we formulate
328
a classification function by averaging three multivariable functions. These three functions denoted with
329
OER1 ( H ,V ) , OER2 ( H , IR) and OER3 (V , IR ) are second-order polynomial functions of two feature
330
variables as shows in Fig.10. They are given by,
331
OER1 ( H , V ) a11 a12 H a13V a14 H 2 a15 H V a16V 2
(9)
332
OER2 ( H , IR) a21 a22 H a23 IR a24 H 2 a25 H IR a26 IR 2
(10)
333
OER3 (V , IR) a31 a32V a33 IR a34V 2 a35V IR a36 IR 2
(10)
334
Based on our experiment, OER values of all bunches were determined by Soxhlet method. Three features
anm of these multivariable functions were
335
of each bunch were collected from our system. The coefficients
336
obtained by the nonlinear regression techniques. These coefficients and the correlation coefficients R2 are shown
337
in Table 2.
338 339
(b)
(a)
340 341 342 343 344 345 346
(c) Fig 10. Relationship between bunch OER and (a) H-V, (b) H-IR and (c) V-IR.
Table 2. Coefficient 𝑎𝑛𝑚 and 𝑹𝟐
347 anm
1
2
3
4
5
6
𝑹𝟐
1
2.382
-0.031
1.937
-0.001
-0.034
-0.042
0.807
2
-58.300
1.181
2.036
-0.006
-0.025
-0.011
0.522
3
-7.447
0.811
0.299
0.169
-0.035
0.001
0.543
348 349
The coefficients of Eq. 9 (hue and volume) are a11 to
a16 . For the coefficients of relative volume, a13
350
achieves 1.937. The larger volume produces the oil more than the small one. For the coefficients of average hue,
351
a12 achieves -0.031. The lower degree of hue value produces the bunch OER more than higher degree. The
352
coefficients of Eq. 10 (hue and infrared) are a21 to
353
2.036. The higher infrared intensity produces the oil more than the lower one. This equation also combines with
354
average hue feature. The coefficients of Eq. 11 (volume and infrared) are
355
same direction, the bigger values of volume and infrared produce the bunch OER more than the smaller one.
a26 . For the coefficients of average infrared, a23 achieves
a31 to a36 . Both features are going
356 357
3. Results and Discussions
358
3.1. SVIS Performances
359
In this subsection, the validity of SVIS algorithm is demonstrated. The Kinect camera was set up for 1
360
meter distance and initially calibrated. Based on the calibration algorithm presented in Section 2.1, the average
361
sensor-lens distance,
362
11(b) shows the perspective point cloud images of the objects taken from Kinect camera, Fig. 11(c) shows the top
363
view. Different color means different depth value (Red color represents furthest and violet color represents
364
nearest). The black color shown in Fig. 11(c) is reserved for “no object” area.
365 366 367 368
s' , is 385 pixel. Three objects shown in Fig. 11(a) with known volumes were tested. Fig.
369 370
(a)
371 372
(b)
373 374
(c)
375
Fig 11. Images of test objects in (a) perspective view, (b) perspective point cloud domains and (c) point cloud
376
top view with represent color.
377
We computed volumes of these three object with the SVIS algorithm applied to point cloud images in
378
Fig. 11(b). To reduce noise and obtain more reliable results, we calculate volume by average over 10 frames of
379
point cloud images for each object. The proposed algorithm for volume computation using a Kinect camera is
380
compared with Time-of-Flight (ToF) camera and laser scanner, ifm-O3D201 and Nippon FX8, for 1 meter
381
distance. The specifications and their prices of these cameras are shown in Table 3. A Kinect camera 2.0 has
382
highest resolution and most sophisticated sensors compared to other cameras while its price is cheapest .
383 384 385 386 387
388
Table 3. Comparisons of SVIS obtained from Kinect and another ToF camera and laser scanner Kinect 2.0
ifm-O3D201
Nippon FX-8
Device Features
RGB + Depth + IR
Depth + Intensity
Depth + Intensity
Resolution (pixels)/fps
512×424
64×48
100×60
Maximum Frame Rate (fps)
30
20
20
Detecting Range (m)
0.5-8.0
0.5-6.0
0.3-5.0
Average sensor-lens distance (px)
385
77
84
SVIS Processing Time (ms)
23
14
17
Price (EUR)
200
850
4,500
389 390
Computation errors of each object and all objects obtained from three cameras are shown in Table 4. The
391
volume errors for all objects obtained from the ifm-O3D201 and Nippon FX-8 are 11.10% and 10.67%,
392
respectively. Both devices have pixel resolution 64×48 and 100×60, which are around 36 times lower than Kinect
393
2.0. The detecting range of 3 systems are cover in the working range (1 m). The SVIS processing time, Kinect
394
achieves 23 ms which enough for 10 bunches/min in our system design. Technically, ifm-O3D201 has high level
395
of noise floor, therefore a software filter, e.g. median or mean filer, is needed to correct noise. On the other hand,
396
Nippon FX-8 equips with a strong laser beam. Therefore, it suits for an uncontrolled light condition despite its
397
large distortion. The proposed algorithm with a Kinect 2.0 camera achieves error for only 2.36%, which is lowest
398
among other cameras.
399 400
Table 4. Performances of volume computation of the proposed algorithm Volume 𝑽𝑻 (𝒄𝒎𝟑 )
Error (%)
Real Sample
Kinect 2.0
ifm-
Nippon
O3D201
FX8
Kinect 2.0
ifm-
Nippon
O3D201
FX8
Volume
401
1
4286
4200
3825
2662
2.01
10.76
37.89
2
6116
5969
7315
6045
2.40
19.60
1.16
3
9274
9043
8750
8869
2.49
5.65
4.37
Sum
19676
19212
19890
17576
2.36
11.10
10.67
402
3.2. Classification function performances
403
The classification function for grading palm bunch is the mean function computed from the feature
404 405
functions presented in the previous subsection. This is given by, 𝑂𝐸𝑅𝐴𝑉𝐺 =
𝑂𝐸𝑅1 (𝐻,𝑉)+𝑂𝐸𝑅2 (𝐻,𝐼𝑅)+𝑂𝐸𝑅3 (𝑉,𝐼𝑅)
(12),
3
406
We use this function to classify a palm bunch into three grades. These grades indicate oil quantity of a palm bunch.
407
Table 5 shows the oil quantity (in kg) of each grade of bunch. They are L, M, and H grade which has oil quantity
408
of 8 kg, respectively.
409
Table 5. The quality of acceptable oil palm bunch. Grade
L-Grade
M-Grade
H-Grade
𝑶𝑬𝑹𝑨𝑽𝑮
< 4kg
4-8 kg
> 8 kg
410 411
To evaluate the performance of the function for grading, other 200 bunches were tested. The grading
412
results obtained from applying the function is shown in Table 6. We have found that the system can grade 10 palm
413
bunches within 1 minute. The overall success rate for grading 200 bunches is 83%. In Table 6, the function is able
414
to grade L, M and H bunches with 81%, 85% and 83% success rate, respectively. For the target L, we found the
415
misclassify to M grade 19% without H grade misclassify also the target H grade we found the misclassify to M
416
grade 17% without L grade misclassify. For target M grade, this grade is the middle grade between L and H grade,
417
the boundary value of this grade is possible to make the misclassify to L and H grade. These error achieves 11%
418
and 5%, respectively.
419
Table 6. The QPF Performances. Target
QPF Predicted
420 421
L
M
H
L
81%
11%
0%
M
19%
85%
17%
H
0%
4%
83%
422
4. Conclusions
423
An automatic system for grading palm bunch has been presented. The system consists of a continuous belt
424
with a control module, a Kinect camera installed in a light-controlled environment, and a computer with the
425
grading software. Three features for grading pam bunch are obtained from sensors in a Kinect camera. These
426
features are H value from RGB snapshot, volume index from point-cloud snapshot, and infrared intensity from
427
infrared snapshot. We developed the programs for the system based on EmguCV (OpenCV) and OpenTK library
428
function sets. One of the key technology proposed is an algorithm to evaluate volume index. This algorithm is
429
called a Simple Volume Integration Scheme (SVIS). Based on the results obtained from the algorithm, we achieved
430
2.49% volume error for 9200 c𝑚3 object. We have tested this algorithm with several palm bunches while their
431
weights were measured. We have found that the volume index values of the palm bunch are linear correlated with
432
bunch weights for 𝑅2 = 0.911. This proves that the SVIS can be applied to determine bunch weight. We also
433
propose to apply other two more features to grade palm bunch. Three features of a palm bunch have been applied
434
to formulate a grading function. The function is obtained by averaging three second-order polynomial functions.
435
Each function is formed with two features, either hue and volume index, hue and infrared intensity, and volume
436
index and infrared intensity. We proposed to grade quality of palm bunch into three grades. These three grades;
437
low, medium and high grade; depend on the quantity (in kg) of oil in palm bunch. The system with the grading
438
function was applied to test 200 palm bunches. The system can grade 10 palm bunches per minute with 83%
439
success rate. This shows the possibility to use the system in a trading market. The system can also applied to
440
mobile systems, such as agricultural machines or autonomous robots.
441
Acknowledgement
442
This research is financially supported by the Thai Research Fund (TRF) and Prince of Songkla University (PSU)
443
under the Royal Golden Jubilee PhD. D. Program No. PHD/0046/2552, TRF research career development grant
444
number RSA5680056, PSU grant number ENG540598S, PSU Science Park and Erasmus+ Staff Mobility
445
(Erasmus code : D OSNA BRU02) from Hochschule Osnabrueck, Germany. We would like to acknowledge Palm
446
Thong Thai Co., Ltd., Mr.Teerapong Juntaraniyom from Faculty of Natural Resources, PSU and all valuable
447
suggestions and comments from the anonymous reviewers and editor to improve this work.
448 449 450
451
References
452
Abbas, Z., Yeow, Y.K., Shaari, A.H., Khalid, K., Hassan, J., Saion, E., 2005. Complex permittivity and moisture
453
measurements of oil palm fruits using an open-ended coaxial sensor. IEEE Sens. J. 5 (6), 1281–1287.
454
http://doi.org/10.1109/JSEN.2005.859249
455
Abdullah, M.Z., Guan, L.C., Mohamed, A.M.D., Noor, M. a. M., 2002. Color Vision System for Ripeness
456
Inspection of Oil Palm Elaeis Guineensis. J. Food Process. Preserv. 26 (3), 213–235.
457
http://doi.org/10.1111/j.1745-4549.2002.tb00481.x
458
Abdullah, M.Z., Guan, L.C., Mohd Azemi, B.M.N., 2001. Stepwise Discriminant Analysis for Colour Grading of
459
Oil
460
http://doi.org/10.1205/096030801753252298
Palm
Using
Machine
Vision
System.
Food
Bioprod.
Process.
79
(4),
223–231.
461
Alfatni, M.S.M., Shariff, A.R.M., Shafri, H.Z.M., Saaed, O.M.B., Eshanta, O.M., 2008. Oil palm fruit bunch
462
grading system using red, green and blue digital number. J. Appl. Sci. 8 (8), 1444–1452.
463
http://doi.org/10.3923/jas.2008.1444.1452
464 465 466
Balasundram, S.K., Robert, P.C., Mulla, D.J., 2006. Relationship between oil content and fruit surface color in oil palm (Elaeis guineensis Jacq.). J. Plant Sci. 1 (3), 217–227. http://doi.org/10.3923/jps.2006.217.227 Bari, S., Lim, T.H., Yu, C.W., 2002. Effects of preheating of crude palm oil (CPO) on injection system,
467
performance
468
https://doi.org/10.1016/S0960-1481(02)00010-1
469 470
and
emission
of
a
diesel
engine.
Renew.
Energy.
27
(3),
339–351.
Basiron, Y., 2007. Palm oil production through sustainable plantations. Eur. J. Lipid Sci. Technol. 109 (4), 289– 295. http://doi.org/10.1002/ejlt.200600223
471
Choong, T.S.Y., Abbas, S., Shariff, A.R., Halim, R., Ismail, M.H.S., Yunus, R., Ali, S., Ahmadun, F.-R., 2006.
472
Digital Image Processing of Palm Oil Fruits. Int. J. Food Eng. 2 (2). http://doi.org/10.2202/1556-
473
3758.1090
474
Fadilah, N., Mohamad-Saleh, J., Abdul Halim, Z., Ibrahim, H., Syed Ali, S.S., 2012. Intelligent Color Vision
475
System for Ripeness Classification of Oil Palm Fresh Fruit Bunch. Sensors 12(10), 14179–14195.
476
http://doi.org/10.3390/s121014179
477 478 479
Favaro, P., Soatto, S., 2007. 3-D Shape Estimation and Image Restoration: Exploiting Defocus and Motion-Blur. Springer Science & Business Media. Harun, M. H., Noor, M.R.M, 2002. Fruit set and oil palm bunch components. J. Oil Palm Res. 14 (2), 24–33.
480
Hazir, M.H.M., Shariff, A.R.M., Amiruddin, M.D., 2012. Determination of oil palm fresh fruit bunch ripeness—
481
Based
482
http://doi.org/10.1016/j.indcrop.2011.10.020
on
flavonoids
and
anthocyanin
content.
Ind.
Crops
Prod.
(1),
36
466–475.
483
Junkwon, P., Takigawa, T., Okamoto, H., Hasegawa, H., Koike, M., Sakai, K., Siruntawineti, J., Chaeychomsri,
484
W., Vanavichit, A., Tittinuchanon, P., Bahalayodhin, B., 2009. Hyperspectral imaging for nondestructive
485
determination of internal qualities for oil palm (Elaeis guineensis Jacq. var. tenera). Agric. Inf. Res. 18
486
(3), 130–141.
487
Kumar, J., Pratap, A., Kumar, S., 2015. Plant Phenomics: An Overview, in: Kumar, J., Pratap, A., Kumar, S.
488
(Eds.), Phenomics in Crop Plants: Trends, Options and Limitations. Springer India, pp. 1–10.
489
http://doi.org/10.1007/978-81-322-2226-2_1
490
Luque de Castro, M.D., Garcıá -Ayuso, L.E., 1998. Soxhlet extraction of solid materials: an outdated technique
491
with a promising innovative future. Anal. Chim. Acta 369 (1), 1–10. http://doi.org/10.1016/S0003-
492
2670(98)00233-5
493 494 495
Luque de Castro, M.D., Priego-Capote, F., 2010. Soxhlet extraction: Past and present panacea. J. Chromatogr. A, Extraction Techniques 1217 (16), 2383–2389. http://doi.org/10.1016/j.chroma.2009.11.027 Makky, M., Soni, P., 2014. In situ quality assessment of intact oil palm fresh fruit bunches using rapid portable
496
non-contact
497
http://doi.org/10.1016/j.jfoodeng.2013.08.011
498
and
non-destructive
based
500
http://doi.org/10.1016/j.compag.2013.02.008
502
J.
Food
Eng.
120,
248–259.
Makky, M., Soni, P., 2013. Development of an automatic grading machine for oil palm fresh fruits bunches (FFBs)
499
501
approach.
on
machine
vision.
Comput.
Electron.
Agric.
93,
129–139.
May, Z., Amaran, M. H., 2011. Automated oil palm fruit grading system using artificial intelligence. Int. J. Eng. Sci. 11, 30–35.
503
Mortensen, A., 2006. Carotenoids and other pigments as natural colorants*. Pure Appl Chem 78 (8), 1477–1491.
504
Nikhom, R., Tongurai, C., 2014. Production development of ethyl ester biodiesel from palm oil using a continuous
505
deglycerolisation process. Fuel 117, 926–931. http://doi.org/10.1016/j.fuel.2013.10.018
506
OpenCV dev team, 2017. Camera calibration With OpenCV [WWW Document]. OpenCV 24132 Doc. URL
507
http://docs.opencv.org/2.4/doc/tutorials/calib3d/camera_calibration/camera_calibration.html (accessed
508
1.9.17).
509
Pamornnak, B., Limsiroratana, S., Chongcheawchamnan, M., 2015. Oil content determination scheme of
510
postharvest
511
http://doi.org/10.1016/j.biosystemseng.2015.03.010
oil
palm
for
mobile
devices.
Biosyst.
Eng.
134,
8–19.
512
Pamornnak, B., Limsirorattana, S., Chongcheawchamnan, M., 2013. Oil Extraction Rate Determination
513
Technique Based on Dielectric Constant of Palm Fruit. Appl. Mech. Mater. 303, 498–501.
514
http://doi.org/10.4028/www.scientific.net/AMM.303-306.498
515
Razali, M.H., Ishak, W., Ismail, W., Ramli, A.R., Sulaiman, M.N., Harun, M.H.B., 2011. Prediction Model for
516
Estimating Optimum Harvesting Time of Oil Palm Fresh Fruit Bunches. J. Food Agric. Environ. 9, 570–
517
575.
518
Razali, M.H., Wan Ismail, W.I., Ramli, A.R., Sulaiman, M.N., Harun, M.H., 2009. Development of Image Based
519
Modeling for Determination of Oil Content and Days Estimation for Harvesting of Fresh Fruit Bunches .
520
Int. J. Food Eng. 5 (2), 1633-1637. http://doi.org/10.2202/1556-3758.1633
521
Rittiron, R., Thanapatay, D., Narongwongwattana, S., Sridaw, P., Penthisan, P., Ngowsakul, W., 2012.
522
Development of Diode Array Near Infrared (NIR) Spectrometer for Determination of Oil and Moisture
523
Content in Oil Palm Fruit. Agricultural Sci. J. (Suppl.). 43 (3), 127-130.
524
Strothmann, W., Ruckelshausen, A., Hertzberg, J., Scholz, C., Langsenkamp, F., 2017. Plant classification with
525
In-Field-Labeling for crop/weed discrimination using spectral features and 3D surface features from a
526
multi-wavelength
527
http://doi.org/10.1016/j.compag.2017.01.003
528 529
laser
line
profile
system.
Comput.
Electron.
Agric.
134,
79–93.
Tan, Y.A., Low, K.W., Lee, C.K., Low, K.S., 2010. Imaging technique for quantification of oil palm fruit ripeness and oil content. Eur. J. Lipid Sci. Technol. 112 (8), 838–843. http://doi.org/10.1002/ejlt.201000020
530
Tranbarger, T.J., Dussert, S., Joët, T., Argout, X., Summo, M., Champion, A., Cros, D., Omore, A., Nouy, B.,
531
Morcillo, F., 2011. Regulatory Mechanisms Underlying Oil Palm Fruit Mesocarp Maturation, Ripening,
532
and Functional Specialization in Lipid and Carotenoid Metabolism. Plant Physiol. 156, 564–584.
533
http://doi.org/10.1104/pp.111.175141
534
Wöhler, C., 2012. 3D Computer Vision: Efficient Methods and Applications. Springer Science & Business Media.
535
Yeow, Y.K., Abbas, Z., Khalid, K., 2010. Application of microwave moisture sensor for determination of oil palm
536 537
fruit ripeness. Meas. Sci. Rev. 10 (1), 7–14. http://doi.org/10.2478/v10048-010-0002-x