Jan 14, 2015 - (RBBB), paced beat (PACE), and PFUS beats. Some industry .... Power line noise comes from electronic circuits of ECG sen- sors, it is a ...
An ECG Monitoring System For Prediction Of Cardiac Anomalies Using WBAN Medina Hadjem, Osman Salem, Farid Na¨ıt-Abdesselam
To cite this version: Medina Hadjem, Osman Salem, Farid Na¨ıt-Abdesselam. An ECG Monitoring System For Prediction Of Cardiac Anomalies Using WBAN. 2014 IEEE 16th International Conference on e-Health Networking, Applications and Services (Healthcom), Oct 2014, Natal, Brazil. pp.441446, 2014, .
HAL Id: hal-01101938 https://hal.archives-ouvertes.fr/hal-01101938 Submitted on 14 Jan 2015
HAL is a multi-disciplinary open access archive for the deposit and dissemination of scientific research documents, whether they are published or not. The documents may come from teaching and research institutions in France or abroad, or from public or private research centers.
L’archive ouverte pluridisciplinaire HAL, est destin´ee au d´epˆot et `a la diffusion de documents scientifiques de niveau recherche, publi´es ou non, ´emanant des ´etablissements d’enseignement et de recherche fran¸cais ou ´etrangers, des laboratoires publics ou priv´es.
An ECG Monitoring System For Prediction Of Cardiac Anomalies Using WBAN Medina Hadjem, Osman Salem and Farid Naït-Abdesselam LIPADE, Paris Descartes University, France {firstname.lastname}@parisdescartes.fr
Abstract—Cardiovascular diseases (CVD) are known to be the most widespread causes to death. Therefore, detecting earlier signs of cardiac anomalies is of prominent importance to ease the treatment of any cardiac complication or take appropriate actions. Electrocardiogram (ECG) is used by doctors as an important diagnosis tool and in most cases, it’s recorded and analyzed at hospital after the appearance of first symptoms or recorded by patients using a device named holter ECG and analyzed afterward by doctors. In fact, there is a lack of systems able to capture ECG and analyze it remotely before the onset of severe symptoms. With the development of wearable sensor devices having wireless transmission capabilities, there is a need to develop real time systems able to accurately analyze ECG and detect cardiac abnormalities. In this paper, we propose a new CVD detection system using Wireless Body Area Networks (WBAN) technology. This system processes the captured ECG using filtering and Undecimated Wavelet Transform (UWT) techniques to remove noises and extract nine main ECG diagnosis parameters, then the system uses a Bayesian Network Classifier model to classify ECG based on its parameters into four different classes: Normal, Premature Atrial Contraction (PAC), Premature Ventricular Contraction (PVC) and Myocardial Infarction (MI). The experimental results on ECGs from real patients databases show that the average detection rate (TPR) is 96.1% for an average false alarm rate (FPR) of 1.3%. Index Terms—WBAN, ECG, CVD, Bayesian Network Classifier.
I. I NTRODUCTION Cardiovascular diseases (CVD) provoke serious anomalies that involves the heart or the blood vessels. According to the World Health Organization [1], these diseases are the leading causes of death worldwide. In 2008, an estimated 17.3 million people died from CVD and almost 23.3 million people will die annually from CVD by 2030. Prevention and early detection are key factors in reducing the number of victims and the associated healthcare costs. Recent technological advances in wireless networks, sensors conception and miniaturization can revolutionize the way how healthcare services are deployed and delivered. In fact, several manufacturers propose today sensors with wireless transmission capabilities able to collect various physiological parameters in real time such as Heart Rate, Temperature, Blood Pressure, Oxygen Saturation etc. These sensors are non-invasive and allow remote in-home, outdoor or ambulatory monitoring. Also, they can be deployed in a Wireless Body Area Network (WBAN) where several sensors are attached to the human body and transmit collected data to a gateway device (Smartphone, Tablet, PDA, etc.) which processes and transmits gathered
information in real time to remote healthcare databases so professionals can access and analyze these data and make appropriate medical decisions. An example of a WBAN architecture for ECG monitoring is shown in figure 1.
ECG
Remote Monitoring Center
Fig. 1. A WBAN Architecture For ECG Monitoring
WBAN systems is a new promising technology and various applications can be considered but it’s still very challenging and several issues are open. One of the major one is the automatic and early detection of medical anomalies symptoms in a WBAN environment, especially in the case of CVD, this issue is of utmost importance for patients and health professionals and is highly supported by governments and research. One of the most frequent CVD is arrhythmia which is a trouble of the cardiac rhythm that can take many forms, the most common are Premature Ventricular Contractions (PVC) and Premature Atrial Contractions (PAC). These two anomalies are due to the premature discharge of an electrical impulse in the atrium of the heart in the case of PAC [2] and the ventricles of the heart in the case of PVC [3]. This results in an extra heartbeat that occurs earlier than the next regular beat should have occurred. Another serious heart anomaly is Myocardial Infarction (MI) commonly known as heart attack. MI is an acute ischemic heart disease that happens when the arteries that supply blood to heart muscle become hardened and narrowed and can’t provide correctly the blood and oxygen to the heart muscle which can suffer from permanent damages. Many other CVD exist and are detailed in [4]. Symptoms of CVD can be observed and confirmed by various medical examinations made by doctors, the principal one is the Electrocardiogram (ECG). The ECG represents the contraction and relaxation of cardiac muscle resulting from the
depolarization and re-polarization of myocardial cells. These electrical changes are recorded via electrodes placed on the limbs and chest wall and are transcribed on a graph paper. The most widely used ECG recording technique is the 12lead ECG. This technique uses 10 recording sites from which are recorded 12 signals called leads among which 6 Precordial Leads (V1, V2, V3, V4, V5, V6), 3 Limb leads (I, II, III) and 3 augmented Limb leads (aVR, aVL, aVF). Each lead views the heart from a different angle and is composed of 5 waves that refer to a depolarization or re-polarization of some region in the heart, these waves, are symbolized P , Q, R, S, and T and are separated by intervals and segments. Figure 2 illustrates a typical one-cycle ECG waveform with the 5 waves and the main intervals and segments.
QRS Complex
R
PR Segment
ST Segment
T
P
Q ST Interval
PR Interval
S QT Interval
Fig. 2. A typical one-cycle ECG (Heartbeat)
ECG should be acquired and correctly interpreted as soon as possible. In practice, traditional techniques record ECG for a relatively short time (minutes in hospitals to 24h or 48h hours with a Holter ECG) and some episodic symptoms my not occur during the monitoring. Furthermore, ECG is generally recorded after first symptoms so heart damages may already have occurred. Therefore, It is needed to have a sufficiently prolonged ECG recording systems with real time monitoring and analysis capabilities. The aim of this paper is to introduce an efficient WBAN ECG monitoring system with the ability to distinguish between normal ECGs from three cardiac anomalies discussed above: PAC, PVC and MI. The rest of this paper is organized as follows: Section II surveys related work. Section III presents the proposed approach and Section IV discusses experimental results. Finally, Section V concludes this paper. II. R ELATED WORK During the last decade, a lot of out-hospital wireless ECG monitoring systems have been proposed by researchers and industries. From our study, we found that the majority of which capture, process and send ECG data to specialists in order to remotely follow their patients, but they generally
don’t detect cardiac anomalies within the collected data or achieves a basic ECG analysis like heart rate variability. This is the main limitation of these systems like CodeBlue [5], LiveNet [6], MyHeart [7], MEDISN [8] or industrial products like AliveCor [9], PhysioMem [10] or LifeMonitor [11]. More recently, some works start to address the problem of ECG anomalies detection in a wireless or mobile environment, such as in [12], a system named HeartSaver is proposed, this system analyzes ECG in real time and includes automated detection of three cardiac pathologies (Atrial fibrillation, Myocardial infarction, and Atrio-ventricular block) but this system was tested using Matlab simulated pathological ECG instead of real ECG data that is affected by various environment parameters and much more complex to analyze. In [13], a heart attack detection application using Smartphone is proposed, this system is based on placing index fingers on mobile camera, the application will calculate the heart rate based on detection of peaks of blood but this technique is limited and simplistic because detection of heart attacks is complex and needs analyzing specific features in ECG. In [14], the RECAD system is designed, it is a real-time wireless monitoring ECG system for Arrhythmia detection. The system in [15] is a wearable Smartphone based platform for real-time heart beat anomaly detection as normal, PVC, right bundle branch block beat (RBBB), paced beat (PACE), and PFUS beats. Some industry devices for arrhythmia detection are available on the market like CardioNet [16], Smartheart [17] and BodyGuardian [18]. In this study, we also review works that propose algorithms and models for ECG analysis and anomalies detection. In most cases, classification algorithms are used to classify ECG into normal or abnormal : In [19], Jovic et al. proposed a classification method based on analysis of a combination of Heart Rate Variability and approximate entropy features in order to classify ECG in four classes (normal heart rhythm, arrhythmia, supra-ventricular arrhythmia, and congestive heart failure). ECG records from online databases were analyzed by seven clustering and classification algorithms. Results show that the top 3 accurate classification methods are Random Forest (RF) with 99.6%, Bayesian Networks with 99.4% and Support Vector Machines (SVM) with 98.4%. In [20], Jadhav et al. proposed an arrhythmia disease diagnosis method using Artificial Neural Network (ANN) classifier of 12-lead ECG recordings data. Their model classifies ECG as normal or abnormal, they used UCI Arrhythmia data set to train and test three different Multilayer perceptron ANN models. They obtained an accuracy and sensitivity of 86.67% and 93.75% respectively with the two first models and a specificity of 93.1% for the third model. In [21] a methodology is proposed for the automatic detection of normal and Coronary Artery Disease conditions bu testing different combinations of data reduction techniques (PCA, LDA, ICA) and four different classifiers (SVM, GMM, PNN, KNN). Their results showed that the combination of ICA with GMM resulted in highest accuracy of 96.8% compared to other combinations. These models achieve a good accuracy but they are generally
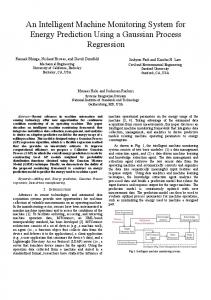
not suitable for a WBAN environment due to their high computational complexity. In this contribution, a methodology has been developed to combine the WBAN technology with statistical classification technique to design a new ECG monitoring system with cardiac anomaly detection capabilities that: – Monitors real time ECG in a WBAN environment. – Predicts 3 cardiac anomalies : PVC, PAC and MI. – Uses numerically efficient algorithms. III. P ROPOSED APPROACH We consider a real deployment scenario where wireless sensors send ECG measurements to a Smartphone in real time. The proposed system is composed of of 5 layers : – A SensorLayer composed of ECG sensors able to capture, sample and transmit ECG wirelessly. Unlike the 12-lead ECG used at hospitals, these sensors are designed for ambulatory applications and generally captures a subset of 2 or 3 leads. – A CommunicationLayer where the digitized ECG is received wirelessly from sensors via bluetooth and alerts are sent to healthcare professionals along with the captured ECG and the position of the patient. These tasks are achieved by a Smartphone playing the role of a gateway. – An ApplicationLayer designed as a mobile application running on a Smartphone that pre-processes the ECG, extracts ECG features (P , Q, R, S, T ) and analyzes the extracted features using a Bayesian Network model, in order to predict the presence of PAC, PVC or MI anomaly. The model is built based on a training set of real ECG data and applied on each new ECG features extracted to classify it and decide whether to raise an alarm or not. This model is updated with the new data whenever a new ECG is received. – A DataLayer containing databases used to save the patient data (general information, medical background, ECG captured, features extracted, alerts raised, etc.). – A U serLayer for patients and remote healthcare professionals who will receive alerts and patients data in real time and take appropriate decisions about the patient condition. In this paper, the proposed approach focuses only on the application layer of our system. This layer is described in Figure 3 and achieve 3 main steps detailed bellow. ECG Received From Wireless Sensors
Bayesian Network Model built from a Training Set Normal ECG Apply
ECG PreProcessing
ECG Features Exraction
Update
Classification of new ECG in real time based on the built model
Myocardial Infarction ECG
PAC ECG
domain, specifically in the range [0.01-150]Hz. The most important are: – The power line interference around 50Hz or 60Hz. – The baseline wandering with a frequency bellow 0.5Hz. – Electrodes motion artifacts ranging from 1Hz to 10Hz. – Electromyographic (EMG) noise from 25Hz to 100Hz. Power line noise comes from electronic circuits of ECG sensors, it is a narrow-band signal centered at a frequency of 50Hz or 60Hz with a bandwidth of less than 1Hz, it has a form of a sinusoid with a significant amplitude compared to the magnitude of the digitized signal. Generally this noise is filtered by ECG signal acquisition hardware. The baseline wandering usually comes from patient movements and respiration at frequencies between 0.15Hz and 0.5Hz and causes changes in iso-electric line position of the measured ECG. It can be suppressed without loss in the original signal. It is possible to remove it by a high-pass digital filter or by the use of a standard Wavelet Transform (WT). We choose to use a 0.5Hz FIR (Finite Impulse Response) high-pass digital filter. Other noises are more difficult to remove because they may be a complex stochastic processes within a wideband and traditional digital filters can’t remove them. Instead, Discrete Wavelet Transform (DWT) technique is widely used or more recently Undecimated Wavelet Transform (UWT) which has a better balance between smoothness and accuracy than the DWT and ensures no loss of signal sharpest features. More details on its use for ECG denoising can be found in [22]. In our system, we use UWT for both pre-processing and features extraction stage where this technique will be further detailed. Once the signal cleaned and denoised, the system extracts the main ECG features. In this step, we first detect all QRS complex peaks and then detect other waves P and T . As previously mentioned, the features extraction algorithm uses UWT, a variant of Wavelet Transform (WT) which is one of the most popular methods for time frequency transformations. It can provide the frequencies of a signal and the time associated to those frequencies, making it very convenient for its application in numerous fields. WT should allow only changes in time extension but not shape. This is performed by choosing suitable basis functions ψ. Generally, the WT can be expressed with the following equation: � Z ∞ � 1 x−b p [Wψ f ] (a, b) = f (x)dx (1) ψ a |a| −∞ The wavelet coefficients cjk are then given by: � cjk = [Wψ f ] 2−j , k2−j −j
ecg.png
PVC ECG
Fig. 3. Design steps of the application layer
The pre-processing stage aims to remove different types of noise present in the digitized ECG received from sensors. These noises overlap with the cardiac components in the frequency
(2) −j
a = 2 is called the binary or dyadic dilation and b = k2 is called the binary or dyadic position. The basis function ψ can be regarded as an impulse response of a system with which the function x(t) has been filtered. Two implementations of WT are commonly known : Discrete Wavelet Transform (DWT) and Continuous Wavelet Transform (CWT). Detailed information about WT and its applications can be found in [23].
The UWT is an improved design of DWT, it is implemented in our system based on the method proposed in [24]. The method first decomposes the ECG signal by 8 level Daubechies wavelets and then reconstructs the signal from approximation coefficients and detail coefficients of all frequency bands. After, peaks detection step is performed to detect QRS complex, P and T peaks by properly setting a threshold that specifies the value which the algorithm uses to reject peaks of a particular amplitude, and a windows width that specifies the current number of samples of the signal for the detection of onsets and offsets. The steps performed by each QRS, P and T peak detector algorithm are described bellow : – Perform UWT with the Daubechies wavelet on input ECG. – Detect the zero crossing points in the detail coefficients. – Set the zero crossing points at the largest scale as the coarse estimation of the real peaks. – Searches the fine scale for the corresponding nearest zero crossing point for each detected point. – Repeats step 4 until it reaches the finest scale, which is the first level. Once all peaks detected, the onsets and offsets are calculated by selecting an optimum window width and using the peaks as references inside the windows in order to scan the waves on both the sides of the peaks to get the zero crossing points for obtaining onsets and offsets. If the signal is not crossing zero line, then the minimum values in that window are considered as onsets and offsets. At the end of these two steps, the 6 features bellow are extracted from each one-cycle ECG (heart-beat): – P onset: Onset of the P wave of ECG. – P of f set: Offset of the P wave of ECG. – QRSonset: Onset of the QRS complex of ECG. – QRSof f set: Offset of the QRS complex of ECG. – T onset: Onset of the T wave of ECG. – T of f set: Offset of the T wave of ECG. From these features, amplitudes and durations of each ECG wave, segment and interval (see Figure 2) can be calculated easily. We choose to calculate the 9 most relevant parameters used by cardiologists [4] : – P amp : Amplitude of the P wave of ECG. – P dur : Duration of the P wave of ECG. – QRSamp : Amplitude of the QRS complex of ECG. – QRSdur : Duration of the QRS complex of ECG. – T amp: Amplitude of the T wave of ECG. – T dur: Duration of the T wave of ECG. – P Rdur: Duration of the P R Interval – ST amp: Amplitude of ST Segment. – QT dur: Duration of the QT Interval. These 9 parameters are used as the random variables of our Bayesian Network (BN) Classifier discussed bellow. A Bayesian network is a statistical model that represents a set of random variables and their conditional dependencies via a Directed Acyclic Graph (DAG), this is why it can be defined as a probabilistic directed acyclic graphical model. In a medical context, a Bayesian Network could represent
the probabilistic relationships between diseases and symptoms. Given symptoms, the network can be used to compute the probabilities of the presence of various diseases. In a Bayesian Network, the nodes of the graphs represent random variables (they may be observable quantities, latent variables, unknown parameters or hypotheses) and the edges represent conditional dependencies. Nodes which are not connected represent variables which are conditionally independent of each other. Each node is associated with a probability function that takes as input a particular set of values for the node’s parent variables and gives the probability of the variable represented by the node. Bayesian Networks that model sequences of variables are called Dynamic Bayesian Networks. Let G = (H, E) a Directed Acyclic Graph (or DAG) where H are the nodes and E the edges and let X = (Xh )h∈H a set of variables indexed by H. X is a Bayesian Network if its joint probability density function can be written as a product of the individual density functions, conditional on their parent variables: p(x) =
Y
h∈H
p xh |xpa(h)
�
(3)
where pa(h) is the set of parents of h. For any set of random variables, the probability of any member of a joint distribution can be calculated from conditional probabilities using the chain rule as follows: P(X1 = x1 , . . . , Xn = xn ) = n Y P (Xh = xh | Xh+1 = xh+1 , . . . , Xn = xn )
(4)
h=1
In our model, the 9 parameters extracted represents the nodes of the Bayesian Network. Details about application of Bayesian network approach can be found in [25]. Algorithm 1 summarizes all steps achieved by the application layer of our system. IV. E XPERIMENTAL RESULTS In order to evaluate our proposed approach we used 3 medical databases from the Physionet [26]. The European ST-T Database (EDB) used for subjects with Myocardial Infarction, the St. Petersburg Institute of Cardiological Technics 12-lead Arrhythmia Database (INCARTDB) for subjects with PVC and PAC and the MIT-BIH Arrhythmia Database (MITDB) for normal subjects. Figure 4 shows various ECG signals including normal ECG from MITDB, MI ECG from EDB which is characterized by an elevation of the ST Segment as shown on the figure, PVC and PAC ECG from INCARTDB. Figure 5 shows the previous signals processed by the 0.5Hz FIR high pass digital filter and UWT. We can see that the resulting ECG signals contain little baseline wandering but keeps the main characteristics of the original ECG signals, we can see also that the wideband noises are suppressed while almost all the information of the ECG signal are maintained.
−4.5
2.41
1.2341.23451.2351.23551.236 5 ECG Samples x 10
4
x 10
ECG with MI
Normal ECG
200
400 600 800 1000 ECG Number ECG with PVC
−0.5 Pamp 200 400 600 800 1000 QRSamp ECG Number Tamp ECG with PAC STamp Amplitude (mV)
3 2 1 0 −1 200
400 600 800 1000 ECG Number
0
0.5
0.4 0.3 0.2 0.1 200
400 600 800 1000 ECG Number ECG with PVC
0.5
2 1
0.6
0.5
0.4 0.3 0.2 0.1
200
400 600 800 1000 ECG Number
Fig. 7. Extracted amplitudes for each ECG
2.41
0.3 0.2
0.1 Pdur QRSdur 200 400 600 800 1000 ECG Number Tdur ECG with PAC PRdur 0.6 QTdur 0.5 0.4 0.3 0.2 0.1
200
400 600 800 1000 ECG Number
200
400 600 800 1000 ECG Number
Fig. 8. Extracted durations for each ECG
Algorithm 1 ECG Pre-Processing and Classification Algorithm Derive the classification model by applying the Bayesian Network (BN) Model on an initial stored training set T S ; Set the windows size w; i = 0; while Captured ECG k do Denoise ECG k with 0.5Hz High-Pass filter and UWT; Extract P, QRS, T Peaks, Onsets and Offsets; Calculate the 9 ECG parameters; if i = w then Apply the derived BN Model on each set of 9 parameters extracted for each ECG of the windows w; if (Number(Class 6= N ormal) > M in) then Raise an alarm; end if Update the Training Set T S with the new captured data; i = 0; else i = i + 1; end if end while
Figure 6 shows the extracted features P onset, P of f et, Rpeak, QRSonset, QRSof f et, T onset and T of f et for two previous ECGs (normal and MI). As described in Section III, these values were obtained by applying UWT to first extract QRS complex peaks and then deduct P and T peaks and their
2.55
2.56 2.57 ECG Samples ECG with MI
2.58
2.59
2.6 4
x 10
2900 3000 3100 3200 3300 3400 3500 3600 3700 3800 ECG Samples
4
x 10
0.4
2.54
3.8 3.6 3.4 3.2 3 2.8 2.6
Fig. 6. ECGs after Features Extraction
ECG with MI
0.6 duration (s)
0
duration (s)
0
duration (s)
Amplitude (mV)
0.5
1 0.5
2.37 2.38 2.39 2.4 ECG Samples
Fig. 5. ECGs after Pre-Processing
1.5
1
Amplitude (mV)
Amplitude (mV)
0
duration (s)
Normal ECG 1.5
2.53
−0.5 2.37 2.38 2.39 2.4 ECG Samples
Fig. 4. Various ECGs from Physionet DB
Amplitude (mV)
0 −0.5
0.5
−5 1.2341.23451.2351.23551.236 5 ECG Samples x 10
Amplitude (mV)
0.5
1 0.5
3000 3200 3400 3600 3800 ECG Samples ECG with PAC
1
−4
2 1.5
Normal class
MI class
1
True Positive Rate
−4
−0.2
2.56 2.58 2.6 4 ECG Samples x 10 ECG with PVC
Amplitude (mV)
−3 −3.5
0
2.54
Amplitude (mV)
Amplitude (mV)
Amplitude (mV)
−2
0.2
−0.4 3000 3200 3400 3600 3800 ECG Samples ECG with PAC
−3.5 −2.5
0
0.4
True Positive Rate
2.56 2.58 2.6 4 ECG Samples x 10 ECG with PVC
P Onset P Offset QRS onset R peak QRS offset Tonset Toffset
Normal ECG 2.5
0.8 0.6 0.4 0.2 0
True Positive Rate
2.54
1 0.5
Amplitude (mV)
1 0.5
ECG with MI 0.6
Amplitude (mV)
Amplitude (mV)
Amplitude (mV)
2 1.5
Normal ECG
3.8 3.6 3.4 3.2 3 2.8 2.6
0
0.5 False Positive Rate PVC class
1 0.8 0.6 0.4 0.2 0
0
0.5 False Positive Rate
1
1 0.8 0.6 0.4 0.2 0
1
True Positive Rate
ECG with MI
Normal ECG 2.5
0
0.5 False Positive Rate PAC class
1
0
0.5 False Positive Rate
1
1 0.8 0.6 0.4 0.2 0
Fig. 9. ROC curves for each class
corresponding onsets and offsets. Figure 7 shows the calculated amplitude parameters P amp, QRSamp, T amp, ST amp for the previous normal, MI, PVC and PAC ECGs during 15 minutes, representing about 1000 ECG cycles or heart beats. As we can see in the figure, the amplitudes are stable enough for normal ECG but vary significantly from one anomaly to another. For example, ECG with MI has ST amp parameter greater than 0.5mV while it is negative or around 0mV for PVC and PAC. Figure 8 shows the calculated duration parameters P dur, QRSdur, T dur, P Rdur, QT dur for the previous ECGs during the same period (1000 ECG cycles). We can also see differences between normal and abnormal ECG, especially for QT dur and T dur which are almost greater than 0.45s and 0.3s for ECG with MI while are generally less than 0.4s and 0.25s in other cases. To evaluate the performance of our BN prediction model, we first pre-processed and extracted parameters of all records of the 3 databases EDB, MITDB and INCARTDB. Then, we selected a data set of 4451 ECG consisting of 896 ECG with MI, 1207 ECG with PVC, 1238 ECG with PAC and 1110 normal ECG. Each ECG is characterized by the 9 parameters mentioned above. 5% of the data set was used as a training set (TS) and the remaining 95% as a test set. We are interested for each class to measure the accuracy parameters bellow : True Positive Rate (Sensibility) =
TP TP + FN
(5)
FP (6) FP + TN TN True Negative Rate (Specificity) = (7) FP + TN TP Positive Predictive Value (Precision) = (8) TP + FP Where T P , F P , T N , F N are respectively, the number of true positives, false positives, true negatives and false negatives. The table I synthesizes the results obtained for each class. False Positive Rate (False Alarm Rate) =
TABLE I ACCURACY PARAMETERS PER C LASS Class MI PVC PAC Normal Average
TPR 89.8% 99.7% 93.9% 99.5% 96.1%
FPR 2% 0.3% 2.8% 2% 1.3%
TNR 98% 99.7% 97.2% 98% 98.7%
PPV 92% 99.2% 92.8% 99.4% 96.1%
If we increase the size of the TS to 30%, we obtain an average TPR of 98.7% with 0.5% FPR. For a TS of 50%, we obtain an average TPR of 99.3% with 0.3% FPR. We deduct that the size of the TS is important for the performance of the classification, this is why we update the TS of our system with the new ECG data captured. Finally, we use the Receiver Operating Characteristic (ROC) curve to represent the fraction of True Positive Rate (TPR) vs. False Positive Rate (FPR) with different threshold. Figure 9 shows the ROC curve of each class. The results obtained show that the average rates of T P R and F AR for all the 4 classes are T P R=96.1% and F AR=1.3% respectively. V. C ONCLUSION In this paper, we present a new WBAN system for ECG monitoring and prediction of cardiac anomalies. We designed our system in five layers and detailed in this paper the application layer that performs three main tasks : pre-process captured ECG signal using a digital high-pass filter and Undecimated Wavelet Transform (UWT) to remove various noises, extract 9 main ECG features and classify ECGs using a Bayesian Network Classifier as normal or abnormal among MI, PVC or PAC anomaly. We applied our proposed approach using 3 medical databases of real ECG data and experimental results show that our system achieves an average True Positive Rate of 96.1% with an average False Alarm Rate of 1.3%. We are currently working on an end-to-end prototype using market sensors to validate our experimental results in a user environment. R EFERENCES [1] “World health organisation,” Last visited August 2014. [Online]. Available: http://www.who.int/en/ [2] L. Nainggolan, “Risk factors identified for premature atrial contractions,” 2014. [Online]. Available: http://www.medscape.com/viewarticle/772475 [3] E. K. James and D. D. Aseem, “Premature ventricular contraction,” 2014. [Online]. Available: http://emedicine.medscape. com/article/761148-overview
[4] F. Morris, W. J. Brady, and J. Camm, ABC of clinical electrocardiography. John Wiley & Sons, 2009, vol. 93. [5] D. Malan, T. Fulford-Jones, M. Welsh, and S. Moulton, “Codeblue: An ad hoc sensor network infrastructure for emergency medical care,” in International workshop on wearable and implantable body sensor networks, vol. 5, 2004. [6] M. Sung and A. Pentland, “Livenet: Health and lifestyle networking through distributed mobile devices,” Proceedings WAMES, 2004. [7] J. Luprano, J. Solà, S. Dasen, J.-M. Koller, and O. Chételat, “Combination of body sensor networks and on-body signal processing algorithms: the practical case of myheart project,” in Wearable and Implantable Body Sensor Networks, 2006. BSN 2006. International Workshop on. IEEE, 2006, pp. 4–pp. [8] J. Ko, J. H. Lim, Y. Chen, R. Musvaloiu-E, A. Terzis, G. M. Masson, T. Gao, W. Destler, L. Selavo, and R. P. Dutton, “Medisn: Medical emergency detection in sensor networks,” ACM Transactions on Embedded Computing Systems (TECS), vol. 10, no. 1, p. 11, 2010. [9] L. A. Saxon, “Ubiquitous wireless ecg recording: a powerful tool physicians should embrace,” Journal of cardiovascular electrophysiology, vol. 24, no. 4, pp. 480–483, 2013. [10] “Physiomem pm 1000,” Last visited August 2014. [Online]. Available: http://www.getemed.net/en/telemonitoring/physiomemr-pm-1000/ [11] “The eq02 lifemonitor,” Last visited August 2014. [Online]. Available: http://www.equivital.co.uk/products/tnr/sense-and-transmit [12] Z. Sankari and H. Adeli, “Heartsaver: A mobile cardiac monitoring system for auto-detection of atrial fibrillation, myocardial infarction, and atrio-ventricular block,” Computers in biology and medicine, vol. 41, no. 4, pp. 211–220, 2011. [13] M. Ashrafuzzaman, M. M. Huq, C. Chakraborty, M. R. M. Khan, T. Tabassum, and R. Hasan, “Heart attack detection using smart phone,” International Journal Of Technology Enhancements And Emerging Engineering Research, vol. 1, pp. 23–27, 2013. [14] H. Zhou, K. M. Hou, J. Ponsonnaille, L. Gineste, and C. De Vaulx, “A real-time continuous cardiac arrhythmias detection system: Recad,” in Engineering in Medicine and Biology Society, 2005. IEEE-EMBS 2005. 27th Annual International Conference of the. IEEE, 2006, pp. 875–881. [15] J. J. Oresko, Z. Jin, J. Cheng, S. Huang, Y. Sun, H. Duschl, and A. C. Cheng, “A wearable smartphone-based platform for real-time cardiovascular disease detection via electrocardiogram processing,” Information Technology in Biomedicine, IEEE Transactions on, vol. 14, no. 3, pp. 734–740, 2010. [16] “Mcot cardionet,” Last visited August 2014. [Online]. Available: http://www.cardionet.com [17] “Smartheart tm,” Last visited August 2014. [Online]. Available: http://www.shl-telemedicine.com/portfolio/smartheart/ [18] “Bodyguardian remote monitoring system,” Last visited August 2014. [Online]. Available: http://www.preventice.com/products/bodyguardian/ [19] A. Jovic and N. Bogunovic, “Electrocardiogram analysis using a combination of statistical, geometric, and nonlinear heart rate variability features,” Artif. Intell. Med., vol. 51, no. 3, pp. 175–186, 2011. [20] S. M. Jadhav, S. L. Nalbalwar, and A. A. Ghatol, “Artificial neural network models based cardiac arrhythmia disease diagnosis from ecg signal data,” International Journal of Computer Applications, vol. 44, no. 15, pp. 8–13, April 2012. [21] D. Giri, U. Rajendra Acharya, R. J. Martis, S. Vinitha Sree, T.-C. Lim, T. Ahamed VI, and J. S. Suri, “Automated diagnosis of coronary artery disease affected patients using lda, pca, ica and discrete wavelet transform,” Knowledge-Based Systems, vol. 37, pp. 274–282, 2013. [22] V. P. Raj and T. Venkateswarlu, “Ecg signal denoising using undecimated wavelet transform,” in 3rd IEEE International Conference on Electronics Computer Technology (ICECT), vol. 3, 2011, pp. 94–98. [23] A. N. Akansu, W. A. Serdijn, and I. W. Selesnick, “Emerging applications of wavelets: A review,” Phys. Commun., vol. 3, no. 1, pp. 1–18, 2010. [24] C. Bhyri, V. Kalpana, S. Hamde, and L. Waghmare, “Estimation of ecg features using labview,” International Journal of Computing Science and Communication Technologies, vol. 2, no. 1, pp. 320–324, 2009. [25] E. Barbini, P. Manzi, and P. Barbini, “Bayesian Approach in Medicine and Health Management,Current Topics in Public Health,” InTech, 2013. [26] A. Goldberger, L. Amaral, L. Glass, J. Hausdorff, P. Ivanov, R. Mark, J. Mietus, G. Moody, C.-K. Peng, and H. Stanley, “PhysioBank, PhysioToolkit, and PhysioNet: Components of a New Research Resource for Complex Physiologic Signals,” vol. 101, no. 23, pp. 215–220, 2000.