Session: Brain Computer Interfaces
CHI 2014, One of a CHInd, Toronto, ON, Canada
An EEG-based Approach for Evaluating Audio Notifications under Ambient Sounds Yi-Chieh Lee1 , Wen-Chieh Lin1 , Jung-Tai King2 , Li-Wei Ko2,3 , Yu-Ting Huang1 , Fu-Yin Cherng1 1 Dept. of Computer Science, 2 Brain Research Center, 3 Dept. of Biological Science and Technology National Chiao Tung University, Taiwan
[email protected],
[email protected], {jtchin2, lwko.brc, tinahuang79, fufu22710}@gmail.com ABSTRACT
Audio notifications are an important means of prompting users of electronic products. Although useful in most environments, audio notifications are ineffective in certain situations, especially against particular auditory backgrounds or when the user is distracted. Several studies have used behavioral performance to evaluate audio notifications, but these studies failed to achieve consistent results due to factors including user subjectivity and environmental differences; thus, a new method and more objective indicators are necessary. In this study, we propose an approach based on electroencephalography (EEG) to evaluate audio notifications by measuring users’ auditory perceptual responses (mismatch negativity) and attention shifting (P3a). We demonstrate our approach by applying it to the usability testing of audio notifications in realistic scenarios, such as users performing a major task amid ambient noises. Our results open a new perspective for evaluating the design of the audio notifications. Author Keywords
audio notifications; usability testing; human cognition; electroencephalography (EEG); mismatch negativity ACM Classification Keywords
H.1.2 User/Machine Systems: J.3Life and Medical Sciences General Terms
Human Factors; Design; Measurement. INTRODUCTION
Auditory icons, earcons, and warning sounds have been widely used in computers, consumer electronics, and trafficcontrol devices. Audio notifications also play critical roles in assistive technologies for the visually impaired; they are a powerful tool for human computer interfaces and can be used to assist users to work more effectively [3]. Generally speaking, the design goals of audio notifications are that they should be short and clear, and allow users to recognize and Permission to make digital or hard copies of all or part of this work for personal or classroom use is granted without fee provided that copies are not made or distributed for profit or commercial advantage and that copies bear this notice and the full citation on the first page. Copyrights for components of this work owned by others than the author(s) must be honored. Abstracting with credit is permitted. To copy otherwise, or republish, to post on servers or to redistribute to lists, requires prior specific permission and/or a fee. Request permissions from
[email protected]. CHI 2014, April 26–May 1, 2014, Toronto, Ontario, Canada. c 2014 ACM 978-1-4503-2473-1/14/04..$15.00. Copyright http://dx.doi.org/10.1145/2556288.2557076
3817
understand their meanings easily [3, 29]. However, a notification’s effectiveness at attracting users’ attention is also important. An inappropriate audio design may distract users’ concentration, even to the point of danger. Hence, a good audio notification design should take into account not only users’ preferences but also the notification’s perceptual effects upon users’ cognitive states. Existing approaches for evaluating the preference and effectiveness of audio notifications often rely on questionnaires, or measures of users’ performance, such as response time and hit rate [26]. While these approaches provide means of evaluating various audio notifications, they are limited with regard to analysis of users’ cognitive states, such as alertness level and attention shifting. Previous studies [14, 24] have shown that humans’ behavioral performance is a rather indirect indicator of their cognitive state and may not be consistent with it at all. Hence, failure to assess cognitive state in usability testing might lead to an incorrect evaluation [24]. Despite the wide applications of audio notifications, there has been little research aimed at developing objective measurement of perceptual or cognitive activities for audio-notification evaluation. Moreover, as an audio notification often plays a supporting role in our interaction with machines, its influence to the major task on auditory perception and cognitive state should not be ignored. Recently, brain-sensing technologies have been used to evaluate users’ cognitive state directly [7, 28] and research attempts have been made to integrate them into usability testing in the HCI field [12, 24]. Nevertheless, previous work of using EEG or other brain-sensing technologies [12, 24, 31] focused on investigating users’ workload or visual tasks, and these techniques have rarely been used to measure auditory tasks. As auditory stimulation is attention-grabbing [3] and humans can hardly avoid hearing it, it is thus very important to assess the perceptual effects of sound and users’ cognitive state when we evaluate audio notifications for HCI design. In this paper, we propose to apply EEG technology to evaluate human auditory perception and attention allocation in usability testing. We exploit two types of neural responses, called mismatch negativity (MMN) and P3a, which can be detected in our brains when we hear novel sounds. Depending on the characteristics of a sound and a user’s cognitive state, different degrees of the MMN and P3a responses would be induced. While various studies in cognitive science have
Session: Brain Computer Interfaces
CHI 2014, One of a CHInd, Toronto, ON, Canada
investigated MMN and P3a, most still use simplified sounds, such as pure tones and beeps, in their experiments. Although some research used repetitive tones and natural sounds [20], there is still a significant gap between MMN/P3a studies and HCI applications. Therefore, we conducted two experiments to determine whether MMN and P3a could be new indicators to enhance the usability testing of audio notifications. If so, this would allow audio designers to use our approach to objectively assess the impact of their audio design upon users, and to improve their design accordingly. In addition, we suggest some possible future applications of MMN and P3a research to HCI. This paper makes three primary research contributions: (1) Extending prior studies and verifying that MMN and P3a can be induced by complex audio stimuli. This extension is critical for applying MMN and P3a to HCI research as MMN and P3a experiments have rarely been conducted on stimuli in daily life such as audio notifications and ambient noises. (2) Suggesting a new method for objectively evaluating audio notifications. Existing paradigms for verifying the effectiveness of audio notifications mostly require subjects to pay attention to the stimuli. However, Sussman et al. [30] have shown that if subjects expect audio notifications to occur, the impact on their sound perception is the same but the influence on their attention state is clearly different. Therefore, we introduce an objective approach for audio evaluation that can be conducted without users’ attention, i.e., a passive and unobtrusive way to evaluate audio notifications. (3) Demonstrating that MMN and P3a could enhance the audio usability testing in scenarios where the evaluated task is supporting. Users operate across a wide variety of environments in their daily lives, and this certainly influences the perceptual effects of audio notifications. Moreover, users undertake tasks that require different amounts of mental workload, and this too would tend to affect the evaluation results. We introduce an appropriate approach for considering these complex factors in usability testing of audio notifications. RELATED WORK AND BACKGROUND Audio Notifications
Auditory icons and earcons are audio notifications commonly used in consumer products and by mobile services. Gaver [13] first introduced auditory icons, which map a specific event to a sound heard in everyday life such that users can easily remember the icon without learning. In contrast to auditory icons, earcons [2] are nonverbal messages represented by abstract musical tones that users have to learn and memorize. Brewster [3] suggests that auditory interfaces should avoid annoying sounds because they may disturb other people in the same environment. Furthermore, one should avoid basing the meaning of an audio notification on its intensity, since a loud sound may grab too much of a users’ attention and could even cause a delay in their handling the problem. Hence, it is necessary to carefully evaluate the perception and effectiveness of audio designs.
3818
Graham [11] compared the effectiveness of auditory icons and earcons as vehicle collision warnings. He found that auditory icons had shorter reaction time but higher risk of false-positive responses. Edworthy [5] also suggested that the real-world sounds are more suitable for monitoring tasks, while earcons are more appropriate for the warning systems as they can effectively attract the user’s attention. Lemmens et al. [17] studied whether audio notifications help subjects react faster in a picture categorization task. Their results showed that both auditory icons and earcons reduce subjects’ response time, as compared to the quiet condition. Conventionally, response time, hit rate, and questionnaires have been used to evaluate the effectiveness and impact of auditory icons and earcons. However, these prior audioevaluation approaches have some limitations. Fagerl¨onn et al. [8] indicated that non-expert users do not necessarily feel comfortable about giving suggestions or feedback on a detailed level. Other studies [24, 28] also pointed out that performance measurement could not take into account users’ changing cognitive state, such as mental workload during an interactive process. In fact, previous studies [1, 18] had suggested that audio-notification designers should consider the context of use, especially when the users are under complex and high mental-workload conditions. Nevertheless, measuring human perception is difficult because users’ experiences and perceptions vary from time to time [18]. To help designers objectively measure the perceptual effectiveness of their audio designs, we need a method to complement prior evaluation approaches. Brain-Sensing for Evaluation
Several studies [28, 31] have applied brain-computer interface (BCI) to HCI. Zander and Kothe [33] proposed passive BCI, which records human cognitive state without the purpose of voluntary control. Using passive BCI can enrich HCI and help monitor actual user states during interaction. To understand the perceptual influence and the degree of attention shifting associated with particular audio notifications, we need a more efficient evaluation method. One possible solution is to make use of physiological indicators, such as functional near-infrared spectroscopy (fNIRS) or eventrelated potentials (ERPs) via EEG device. fNIRS is a noninvasive imaging method involving the quantification of chromosphere concentration resolved from the measurement of near-infrared light attenuation, or temporal or phasic changes. Although fNIRS is an adequate tool for monitoring cognitive states, it is not suitable for quick perceptual tasks [24]. In contrast, as ERPs are brain responses directly related to specific sensory, motor, or cognitive events, they provide higher temporal resolution in analyzing the various stages of neural processing associated with related behaviors [20]. Therefore, in this study, we utilize ERPs to analzye the effectiveness of various audio notifications. Mismatch Negativity
An ERP component well known to be related to sound processing is the MMN, which is a change-specific negative potential over fronto-central sites. The latency of MMN is about
Session: Brain Computer Interfaces
CHI 2014, One of a CHInd, Toronto, ON, Canada
100-250 ms, and it is elicited by a subject’s preattentive discrimination between a recurring standard sound and a deviant sound [20]. For example, when subjects are seeing a movie and hearing an oddball sequence of sounds, in which a rare deviant sound is interspersed among a series of frequent standard sounds, the repetitive standard sound forms a memory trace and MMN will be evoked if a new (deviant) sound does not match this auditory memory. This means that humans’ auditory system can use preattention to distinguish the differences between two sounds, including intensities, pitches, locations, and durations [23, 16]. Moreover, MMN reflects not only the physical characteristics of deviant sounds (e.g., intensity, frequency, duration), but also more abstract representations of complex auditory rules, such as melody, speech, and rhythm [20]. The amplitude and latency of MMN depend on the differences between the deviant and standard sounds, with larger differences inducing larger amplitudes and shorter latencies [20]. MMN amplitude may also positively correlate with hit rate [22], where the correlation between MMN response and behavioral performance is investigated across various frequencies of the same sound. These studies suggest that MMN is a good indicator for audio perception and an objective measurement for the discriminability of a sound. P3a
A fronto-central positive component, P3a, often occurs around 200 ms to 300 ms after the stimulus onset, i.e., somewhat later than MMN, and is related to the orienting responses towards deviant stimuli [6]. When deviant stimuli attract more of a subject’s attention, the amplitude of P3a becomes larger. Although increasing the difference between the deviant and standard stimuli often enlarges the MMN and P3a amplitudes at the same time [20], this tendency holds under proper conditions [22]. Previous research has indicated that P3a would also be modulated according to different cognitive states such as workload and attention [25, 30]. Based on these studies, MMN is more likely related to involuntary attention switching, while P3a is more likely to reflect the level of active attention orienting. Oddball Paradigm
A common task used in MMN and P3a studies is the oddball paradigm, in which a series of auditory or visual stimuli with different occurrence probabilities are used to assess neural reactions to unpredictable events [20]. An auditory oddball paradigm usually includes a frequent tone as standard stimuli and a less frequent tone as deviant or novel stimuli. When infrequent stimuli are inserted in the series of standard stimuli, MMN and P3a – which as we have seen are associated with novelty detection and attention-switching towards deviant events – will be evoked [6], and the occurrence probability of frequent and infrequent stimuli will influence the level of MMN and P3a. Typically, the cumulative duration ratio of deviant stimuli is controlled at 10%-30% of the cumulative duration of standard stimuli [20]. However, some studies still found stable MMN when 50% of deviant stimuli were used [27].
3819
RESEARCH GOALS
Our goal is to explore the possibility of applying EEG to the evaluation of the effectiveness of audio notifications under more realistic conditions that are suitable for HCI applications. In the first experiment, we used ambient noises and audio notifications as stimuli to gain an understanding of how these auditory stimuli affect users’ perception. Though prior studies have found that MMN can be evoked under complex standard stimuli such as repetitive tones or natural sounds [20], these cannot represent real conditions. Thus, a novelty of our experiment design was that we used ambient noises instead of repetitive sounds as the standard stimuli, and audio notifications as the deviant stimuli. This brought our experimental conditions closer to real-world scenarios, thus potentially extending the applications of MMN and P3a for audio evaluation. In the second experiment, we explored the benefits of MMN and P3a for analyzing subjects’ perception of sounds and their attention shifting while evaluating audio notifications in a more complex and realistic situation, where subjects simultaneously performed multiple tasks with auditory and visual modalities. We manipulated each subject’s cognitive state by controlling the difficulty of the game (the card game Pairs in this case), to test if human perception of sound and attention shifting could be affected by users’ mental workload, and if these influences resulted in the deflection of MMN and P3a. METHODS
We modified the oddball paradigm to evaluate the effectiveness of six audio notifications in two sets of ambient noises. Deviant Stimuli: Audio Notifications
Six audio notifications were used as deviant stimuli: Dev1 (Do, 500 ms), Dev2 (Do, 500 ms), Dev3 (Tri-tone, 500 ms), Dev4 (Ding, 500 ms), Dev5 (Horn, 700 ms) and Dev6 (Bell, 700 ms). All deviants were presented via loudspeakers. The intensity of each deviant was set at 72 dB SPL, except that of Dev2 which was set at 78 dB SPL. Dev1 and Dev2 were the same digitally generated piano chords, but with different intensities, to allow us to assess the effect of intensity on audio notification. Dev3-Dev6 were four of the default audio notifications used on Apple iPhones to notifying their users about incoming messages. Standard Stimuli: Ambient Noises
Two sets of ambient noises recorded at real-life venues were used as the standard stimuli: the first was recorded in a club, and included conversations of males and females, some music, and background noise; the other was recorded on a city street and included traffic sounds and other street noise. The intensities of the two ambient noises were controlled to between 70 to 75 dB SPL, which was a comfortable level for the subjects in our test scenarios. The experimental setting and information regarding auditory stimuli are presented in Figure 1. Procedure
We set a period of 700 sec as a testing block (Figure 1). The total time of all deviants appearing in each block was controll-
Session: Brain Computer Interfaces
CHI 2014, One of a CHInd, Toronto, ON, Canada
Testing Block, Exp. 1: 700 sec , Exp. 2: 350 sec
…
Deviant Standard Stimuli Deviant 3. 4 sec - 6.8 sec
Standard Stimuli Experiment 1 Club Ambient
corrections were applied to verify if the data violated the assumption of sphericity. Repeated-measures (RM) ANOVAs were conducted, and the Tukey’s method for multiple comparisons was applied in post-hoc tests.
…
Deviant Stimuli
EXPERIMENT 1: AUDIO EVALUATION BY MMN AND P3A
Dev1 – Dev6
City Street Ambient Dev1 – Dev6 Experiment 2 Club Ambient Dev1, Dev2 City Street Ambient Dev1, Dev2 Figure 1. List of experimental procedures and auditory stimuli. All deviant stimuli are randomly scattered in a testing block. The occurrence probability of each deviant is equal.
ed so as to not exceed 30%, i.e., 210 sec. The interval between each deviant stimulus was at least 3.4 sec. To avoid subjects generating expectations of the audio notifications, and to collect enough trials, the interval between any two consecutive deviant stimuli was randomly varied in the range of 3.4 to 6.8 sec. In each block, all six deviant stimuli were randomly scattered with equal probability of occurrence and played as an overlay to the ambient noise while the chosen set of standard stimuli (i.e., either city street noise or club noise) was played continuously. Figure 1 shows our paradigm design. We took the EEG data recorded between each pair of consecutive deviants as the standard trials and those recorded while each audio notification appeared as the deviant trials. We obtained approximately 120 deviant trials in each testing block. At the beginning of each block, standard stimuli (ambient noise) would be played for 10 sec, data from which was not recorded. EEG Recording and Data Analysis
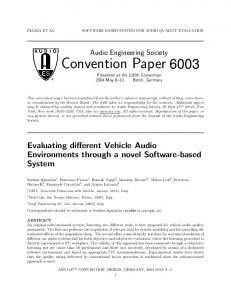
We used a non-invasive EEG cap as measurement equipment. The EEG was recorded using a NeuroScan system with 32 Ag-AgCl electrodes and a bandpass filter of 0.01-100 Hz. Although 32-channel EEG data were recorded, we only used single-channel (Fz) ERP information for analysis as previous studies had shown that MMN has its maximal amplitude at Fz which is usually treated as the representative location of the MMN source [20, 22]. Additionally, for practical considerations of usability testing, it would be advantageous if fewer EEG channels (implying a cheaper, portable EEG device) are proved to be sufficient for a quick evaluation. We adopted an open-source Matlab toolbox, EEGLAB, to process EEG data, which was digitized with a 1000 Hz sampling rate and bandpass filtered at 1-50 Hz off-line. The epochs used for averaging were 600 ms long, starting 100 ms before and ending 500 ms after the stimulus onset. The pre-stimulus period (100 ms) was set as a baseline. All epochs with voltage variations exceeding 100µV were automatically rejected; the rejection rate varied from 5%-10%. Then, all epochs of the same standard (or deviant) stimuli were averaged. For MMN and P3a analysis, the response to the standard stimuli was subtracted from the response to each deviant stimuli. The peak amplitudes and latency of MMN and P3a were measured separately from the most negative peak occurring at 100-220 ms and the most positive deflection within 220-320 ms at the location of electrode Fz (Figure 2). Mauchly’s test and Greenhouse-Geisser
3820
The goal of this experiment was to extend prior MMN and P3a studies to the evaluation of audio notifications in the HCI field, by bringing the experiment design closer to real-life scenarios. Figure 1 indicates the procedure and auditory stimuli involved this experiment. Participants and Device
Thirty healthy, right-handed subjects (12 females; 20-25 years old) with normal or corrected-to-normal vision participated in this experiment. None of the subjects had any history of brain disease, drug use, or hearing problems. None had any musical expertise. After completing the entire experiment (about 2 hours), subjects were rewarded with 16 USD for their time. We used an LCD monitor (22 inches, 1920×1080 pixels) to show videos and visual tasks. Audio stimuli were presented via loudspeakers (Altec Lansing 2.0 ch, VS2620), which were placed at a distance of 60 cm in front of the subjects, at 30◦ to their left- and right-hand sides. A decibelmeter was used to adjust the intensity of audio stimuli before all experiments. Task
There were two sessions intended to test the relationship between the MMN, P3a and behavioral performance in experiment 1. All subjects attended both sessions. Session 1. We only recorded the subjects’ behavioral data for the audio notifications. The subjects were seated in a comfortable chair and instructed to visually stare on a white cross sign in the center of the screen before the experiment began. Once the experiment started, they watched a subtitled silent video pre-chosen by themselves, and continuously heard an ambient noise. They needed to respond via the keyboard as fast as possible once they heard any of the six audio notifications. Session 2. The subjects watched the same silent video along with the same ambient noise as in Session 1, but they were asked to ignore all auditory stimuli while their EEG data were recorded during the entire session. Each session comprised four testing blocks: two using club ambient noise and two using city street ambient noise as standard stimuli. Between any two consecutive blocks, subjects had three minutes to rest. The order of the four blocks for each subject were randomly arranged. During each session with a given subject, at least 40 trials were collected for each audio notification in a session. Results of Experiment 1 Session 1: Behavioral Performance
Behavioral responses were defined as ’hit trials’ if subjects pressed the keyboard within 2 sec after a deviant stimulus had played. We computed the average reaction time and hit rate for each audio notification. Only the reaction time of the hit
Session: Brain Computer Interfaces
MMN
−8
−8 −6
−4
−4 Potential (µV)
−6 Potential(μV) (µV) Potential
sults closely replicated those of previous studies [32], it seems appropriate to use MMN amplitude and latency to explore the discriminability of audio notifications in the context of different ambient noises.
−10
−10
−2 0 2
Standard Dev1 Dev2 Dev3 Dev4 Dev5 Dev6
4 6
P3a
8 10 −100
CHI 2014, One of a CHInd, Toronto, ON, Canada
0
100
200
300
Time (ms)
(a) Club
400
Time (ms)
−2 0 2
Standard Dev1 Dev2 Dev3 Dev4 Dev5 Dev6
4 6 8 10 −100
0
100
200
300
Time (ms)
(b) City Street
400
Time (ms)
Figure 2. MMN (100-220 ms) and P3a (200-320 ms) curves in the context of two ambient noises: (a) Club; (b) City Street.
trials were used to compute the averaged reaction time. We performed a two-way RM-ANOVA (2 ambient noises × 6 deviant stimuli) to analyze the relationship between each audio notification. Mauchly’s test indicated that the sphericity was not violated. Figure 3(a)(b) shows the average reaction time (RT) associated with each audio notification within each type of ambient noise. The results did not reveal significant effects of the type of ambient noises (F=.056, p=.812). We found Dev5 had statistically significant differences with the other deviants under both types of ambient noises (p Dev6 > Dev4 > Dev5 (p