Feb 27, 2008 - 2169-3536 (c) 2016 IEEE. ..... sketch the policy implications of using health social networks and how ...... Conference on Computer Vision and Pattern Recognition, 2013, pp. ..... served as external examiner for many theses.
This article has been accepted for publication in a future issue of this journal, but has not been fully edited. Content may change prior to final publication. Citation information: DOI 10.1109/ACCESS.2017.2685531, IEEE Access
> REPLACE THIS LINE WITH YOUR PAPER IDENTIFICATION NUMBER (DOUBLE-CLICK HERE TO EDIT)
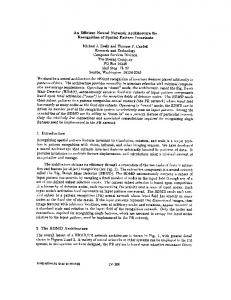
REPLACE THIS LINE WITH YOUR PAPER IDENTIFICATION NUMBER (DOUBLE-CLICK HERE TO EDIT) < temporally align different activities from multiple subjects performing similar behaviors. Traditional data preprocessing, segmentation, feature extraction and classification techniques [3] are required to be adapted in an environment infrastructure that enforces nontraditional data acquiring mechanism, in which a sensor event might be associated with more than one activity. For this reason, many solutions have been proposed to handle the situation in which overlaps exist during the segmentation task. In smart home environment, temporal and spatial characteristics are key features to perform such task. Figure 2 shows an example of some situations in which segments interleaving with each other’s, where "Begin" and “End" indicate the start and the end of an activity.
Watch_TV
2
Begin
Bathroom
Begin
Bathroom
Medication Medication
Watch_TV
End
Begin End
End Time
Fig. 2. Illustrative Example
Another important issue that has a direct effect on the performance of data mining techniques, such as classification, is the extraction and representation of the significant features. During the implementation of the experiments, in this work, researchers found that not all entries from sensors are the same in terms of effectiveness; i.e. the effect of the sensor readings on recognizing some specific activities. For this reason, we developed a probabilistic model to weigh the readings from different sensors by taking into account the contextual features of data segments. Therefore, the effect of out-of-context events will be minimized.
Fig. 2. Possible Forms of Segments in a Smart Home Environment
Consider the following situation that represents simple containment segmentation: the patient has started watching the TV, and then she had to go to the bathroom. After this, the patient took his/her diabetes medication. The patient, then, came back and completes her favorite show on TV. Such scenario can be represented as shown in Figure 2:
On the other hand, sharing of personal data introduces many privacy concerns since several sensitive behaviors can be identified. The challenge is to find versions of health data that can preserve the privacy while still data mining tasks can be applied on it in an efficient manner. With today's high speed networks and health smart applications, it is becoming a necessity to collect, process, disseminate, anonymize and then store data as electronic medical records. From the privacy and security perspectives, two questions have to be answered: 1) is the collected data is private enough so that no one can misuse it? 2) How to examine whether the data is still useful enough to be used by researchers in the health domain if the data is deidentified? Achieving this balance between data usefulness (utility) for researchers and the privacy is a main objective of several e-health providers. It is not a straightforward task to anonymize health related data while keeping it useful for research objective when conventional encryption techniques are used. This paper proposes an efficient classification technique that resolves the problem of segmenting health data that have been collected from smart homes and utilizes a probabilistic feature extraction technique that weight the readings from the sensory networks. Moreover, we propose a novel generalization technique, which aims to guarantee the utility of the anonymized health data. We proved that the proposed privacy technique works in an effective manner when applied to classify the anonymized health data without a significant degradation in the achieved accuracy.
2169-3536 (c) 2016 IEEE. Translations and content mining are permitted for academic research only. Personal use is also permitted, but republication/redistribution requires IEEE permission. See http://www.ieee.org/publications_standards/publications/rights/index.html for more information.
This article has been accepted for publication in a future issue of this journal, but has not been fully edited. Content may change prior to final publication. Citation information: DOI 10.1109/ACCESS.2017.2685531, IEEE Access
> REPLACE THIS LINE WITH YOUR PAPER IDENTIFICATION NUMBER (DOUBLE-CLICK HERE TO EDIT)
REPLACE THIS LINE WITH YOUR PAPER IDENTIFICATION NUMBER (DOUBLE-CLICK HERE TO EDIT) < knowledge (such as health systems) as neural networks cannot incorporate them dynamically. Matching sequence of actions related to an inhabitant has been investigated in [27, 28]. This methodology depends heavily on repetitive actions. Such technique is effective in specific domains (such as manufacturing) but it is difficult to apply in environments where the user behavior is not supposed to be repetitive. In addition it is not efficient in a noisy environment with multiple and heterogeneous sensors. Traditional clustering and classification techniques for syntactic structure, time intervals, domain specific such as [29, 30, 31, 32, 33, 34] are also difficult to be applied in this domain since in-home human activities are ad hoc. A more sophisticated approach has been proposed in [35] where a nearest neighbor and decision trees algorithms are applied for activity recognition. This approach is efficient but suffers from scalability problems, especially when large number of sensors is used. It requires incorporating all sensor features to apply prediction. Many algorithms have been proposed to measure the effect of activity recognition on power consumption such as [36, 37, 38]. In addition several other techniques have been proposed to study how spatial and temporal feature selection affects the performance of activity recognition such as [39, 40, 41]. Another research direction is the embedding of domain knowledge to formulate ontology for the activities [42, 43]. Unfortunately, maintaining such a complex structure (with new training data) resulted in high time complexity. B. Privacy Preserving Data Analytics Research in e-Health has revealed that dealing with patients' data is by no means an easy task. Healthcare providers are investigating new techniques to share health-related data for research and practical experience. Nevertheless, when it comes to medical records, including Electronic Health Records (EHR), health sensors (e.g. ECG monitors) and demographic data, privacy and security are major concerns. In several countries such as the United States there are specific standards to protect electronic health records. These standards are used to provide guidelines for healthcare providers who may share patients' data. HIPAA is one of those standards from the US Department of Health and Human services [44]. Most of the proposed approaches focus mainly on the sensing and health monitoring services, but ignore the data privacy issues. There have been several techniques applied to encrypt (anonymize) medical data such as using Semantic Marginality [45] which has been proposed for nominal attributes; does not anonymized numerical attributes. The use of sensing activities is important to monitor smart environments including smart homes. However, users’ privacy is considered one of the major challenges that need to be considered [46]. For example several behavior inferences including occupancy detection can be discovered by monitoring
4
smart meters [47]. Therefore, several researchers refer to the importance of designing privacy preserving data gathering techniques when collecting data in smart environments [48, 49]. There have been many approaches that address privacy issues in smart environments, in particular, activity recognition. A privacy preserving automatic fall detection approach was proposed in [50]. The technique used foreground mask for visualization to detect five types of activities using 3D depth information. Such approaches focus on introducing noise to the captured images. A similar approach for training activity recognition systems in real-time was proposed in [51]. The approach utilized a face recognition scheme, which identifies users’ faces to preserve privacy. While such approaches protect users’ identity, they do not avoid inference-based privacy attacks [3]. In addition, they mainly focus on protecting the privacy in videos and images; not the features of the sensed data. There have been some approaches which work at the feature level to achieve privacy, for instance an approach in [52] detected coughs by monitoring users’ voice streams on mobile devices. Cough activity was recognized by analyzing a feature set. To achieve privacy, the feature set was perturbed in order to avoid reconstructing the voice stream. However, the perturbation approach leads to significant information loss. Yang and Chung in [53] proposed a hybrid solution for privacy preserving data sharing in cloud environment. Using such approach, different methods are combined to support multiple paradigms of medical data sharing with different privacy strengths. On the same vein, Li in [54] identify and sketch the policy implications of using health social networks and how policy makers and stakeholders should elaborate upon them to protect the privacy of online health data. Several authors discuss the challenges of sharing patient-specific health data. Khokhar et al. [55] develop an analytical cost model to measure trade-off between privacy and utility while demonstrates the effectiveness of the model in real-life. Private companies such as Hakim in [56] have introduced many techniques to preserve the privacy of patients data using techniques such as System Access Control, Audit logs, Encryption, Private and Closed LAN/WAN. Some approaches utilize k-anonymity to achieve privacy when collecting data using sensor networks. For instance in [57] the authors utilized a k-Anonymity perturbation approach to enable k-indistinguishability when the data is aggregated in sensor networks. The approach focuses on the task of data aggregation, but it does not study the applicability of kanonymity in activity recognition. Another approach in [58] used a generalization technique to protect users’ contextual data such as his current activities. Such an obfuscation approach created several generalization levels to release data using an ontological description that identifies the generalization level of object type instances. Few approaches introduced different privacy mechanisms by releasing high level statistical features which do not disclose sensitive information. In [59] Zhang et al. used mFingerprint, a
2169-3536 (c) 2016 IEEE. Translations and content mining are permitted for academic research only. Personal use is also permitted, but republication/redistribution requires IEEE permission. See http://www.ieee.org/publications_standards/publications/rights/index.html for more information.
This article has been accepted for publication in a future issue of this journal, but has not been fully edited. Content may change prior to final publication. Citation information: DOI 10.1109/ACCESS.2017.2685531, IEEE Access
> REPLACE THIS LINE WITH YOUR PAPER IDENTIFICATION NUMBER (DOUBLE-CLICK HERE TO EDIT) < mobile-based activity recognition system. This approach applied multimodal sensors which can effectively monitor user activities while maintaining privacy. While such approaches focused on anonymizing sensors data, other approaches focus on the feasibility of attacking the collected data in order to discover suspicious inferences. As an example the work in [60] presented an evidence of the several threats posed by shared mobile sensor data. III. METHODOLOGY This section discusses the methodology and the settings used for activity recognition along with a privacy preserving mechanism to identify users’ activities and avoid inference attacks. Let {𝑠1 , 𝑠2 , … 𝑠𝑛 } be a sequence of sensor events generated from a smart home. The sensors are assumed to be of two states (e.g., Open-Close, On-Off …etc.). The data set consists of a set of events in which each event is associated with a date, time, sensor id, and sensor status [45]. The data stream is annotated by experts at the beginning and the ending of each segment by an activity from a set of predefined activities{𝑑1 , 𝑑2 , … , 𝑑𝑚 }. Figure 4 shows an example of the dataset format. 12:49:52.624433
M14
ON
27/2/2008
12:49:53.802099
M15
ON
27/2/2008
12:49:54.24004
M16
ON
27/2/2008
12:49:55.470956
M17
ON
27/2/2008
12:49:55.470956
M15
OFF
27/2/2008
12:49:55.808938
M14
OFF
27/2/2008
12:49:57.548709
M16
OFF
27/2/2008
12:49:57.717712
M13
OFF
Wash hands
begin
segment
27/2/2008
Wash hands
end
Fig. 4. A sample dataset
5
First, the algorithm pushes the activity ID in the stack and inserts a sequence record in the database with a specific format; (𝐷𝑎𝑡𝑒, 𝑇𝑖𝑚𝑒, 𝑆𝑒𝑛𝑠𝑜𝑟𝐼𝐷, 𝑉𝑎𝑙𝑢𝑒, 𝑎𝑖 ). Lines (8-11) define the opposite situation in which an activity declares the end of its events. The algorithm first inserts the sequence record into the database and then pops the activity from the stack; then the activity becomes inactive. Lines (12-16) define the situation where concurrency exists due to the interleaving among activities. When two or more activities are active at the same time, our algorithm assigns the labels of ALL active activities. Such situation produces redundancy in the database, but enhances the accuracy of pattern detection. Algorithm 1: Activity Labeling (Dataset D) Let 𝐴𝑐𝑡𝑖𝑣𝑒 = {𝑎0 , 𝑎1 , … 𝑎𝑛 } be a set of active activities ordered chronologically, i.e. activities that began but not finished yet. Let 𝑎𝑖 is an activity label such as 𝑎𝑖 ∈ 𝐴𝑐𝑡𝑖𝑣𝑒 ==Begin== 1| ∀(𝑖), 𝑟𝑒𝑚𝑜𝑣𝑒(𝑟𝑒𝑐𝑜𝑟𝑑𝑖 𝐷) 𝑤ℎ𝑒𝑟𝑒 ∃(𝑟𝑒𝑐𝑜𝑟𝑑𝑖 . 𝑏𝑒𝑔𝑖𝑛) ⋀ ∄(𝑟𝑒𝑐𝑜𝑟𝑑𝑖 . 𝑒𝑛𝑑) 2| 𝐴𝑐𝑡𝑖𝑣𝑖𝑡𝑦 = ∅ 3| 𝒇𝒐𝒓 𝑒𝑎𝑐ℎ 𝑟𝑒𝑐𝑜𝑟𝑑 𝑅 ∈ 𝐷 4| 𝑖𝑓( 𝑅. 𝐴𝑐𝑡𝑖𝑣𝑖𝑡𝑦 = 𝑏𝑒𝑔𝑖𝑛) 𝑇ℎ𝑒𝑛 5| { 𝑃𝑢𝑠ℎ(𝐴𝑐𝑡𝑖𝑣𝑖𝑡𝑦 𝑎𝑖 , 𝑆𝑒𝑡 𝐴𝑐𝑡𝑖𝑣𝑒) 6| 𝐼𝑛𝑠𝑒𝑟𝑡(𝐷𝑎𝑡𝑒, 𝑇𝑖𝑚𝑒, 𝑆𝑒𝑛𝑠𝑜𝑟𝐼𝐷, 𝑉𝑎𝑙𝑢𝑒, 𝑎𝑖 ) 7| } 8| 9| 10| 11| 12| 13| 14| 15| 16|
𝑖𝑓(𝑅. 𝐴𝑐𝑡𝑖𝑣𝑖𝑡𝑦 = 𝑒𝑛𝑑)𝑇ℎ𝑒𝑛 { 𝐼𝑛𝑠𝑒𝑟𝑡(𝐷𝑎𝑡𝑒, 𝑇𝑖𝑚𝑒, 𝑆𝑒𝑛𝑠𝑜𝑟𝐼𝐷, 𝑉𝑎𝑙𝑢𝑒, 𝑎𝑖 ) 𝑃𝑜𝑝(𝐴𝑐𝑡𝑖𝑣𝑖𝑡𝑦 𝑎𝑖 , 𝑆𝑒𝑡 𝐴𝑐𝑡𝑖𝑣𝑒) } 𝑖𝑓(𝑅. 𝐴𝑐𝑡𝑖𝑣𝑖𝑡𝑦 = 𝑁𝑢𝑙𝑙 ) { 𝑓𝑜𝑟(𝑖 = 𝑛 𝑇𝑂 0 𝑆𝑡𝑒𝑝 − 1) { 𝐼𝑛𝑠𝑒𝑟𝑡(𝐷𝑎𝑡𝑒, 𝑇𝑖𝑚𝑒, 𝑆𝑒𝑛𝑠𝑜𝑟𝐼𝐷, 𝑉𝑎𝑙𝑢𝑒, 𝑎𝑖 ) } }
A. Data Preprocessing and Activity Profiling The datasets have been processed for the purpose of creating a profile for each activity (abstraction). The profile is defined as the set of sequences that identify every activity in the dataset. In order to perform this task, event records have to be labeled first to supervise the learning process. The labeling task involves assigning an activity label to every record in the dataset. Algorithm 1 shows a formal description for the activity labeling and profiling process. Line (1) defines the cleaning process where some activities in the dataset start but never end. This situation arises due to noise or when extracting portions of the dataset without taking into account the embedded structure of activities; i.e. every activity starts must end. Line (2) defines an empty set as a stack of activities, where the highest index in this stack (𝑛) is the one on the top. Line (3) starts the main loop in this algorithm that spans every record (𝑅) in the dataset. Lines (4-7) define the action taken when the algorithm detects the beginning of an activity (𝑎𝑖 ).
17| 18|
𝐼𝑓 |𝐴𝑐𝑡𝑖𝑣𝑖𝑡𝑦| = 0 𝑇ℎ𝑒𝑛 𝑆𝑘𝑖𝑝 End FOR
==End==
Notice that, when (𝑛 = 1), no concurrency exists among events. Finally, Line (17) defines the situation in which a data record has been detected with no active activities. Such a situation arises due to incorrect manual labeling of activities and the noise in the datasets. Our approach, to handle such situation, is to skip such records. For data tuples that reside between the end of a segment and the beginning of a consecutive one (i.e. tuples that are not related to any segment), the label “Others” is assigned. In other words, these tuples are not labeled in the original dataset and have not been assigned to any data segments. During the preprocessing phase, we prepared two versions of every dataset in which the “others” label is kept in the first version, while ALL “others” labeled
2169-3536 (c) 2016 IEEE. Translations and content mining are permitted for academic research only. Personal use is also permitted, but republication/redistribution requires IEEE permission. See http://www.ieee.org/publications_standards/publications/rights/index.html for more information.
This article has been accepted for publication in a future issue of this journal, but has not been fully edited. Content may change prior to final publication. Citation information: DOI 10.1109/ACCESS.2017.2685531, IEEE Access
> REPLACE THIS LINE WITH YOUR PAPER IDENTIFICATION NUMBER (DOUBLE-CLICK HERE TO EDIT) < tuples have been removed from the other version. Our purpose is to study the effect of such tuples on the performance of our approach. After labeling the dataset, the records of each activity are converted into a set of sequences; creating what is called the Activity Profile. Each activity segment, in the labeled data, will form a sequence consisting of the sensors' IDs that have a complete cycle of their states. For instance, the door sensor 𝑠𝑘 will be considered in the sequence if it has an "Open" state followed later with a "Close" state in the same segment.
6
The proposed method for privacy preserving of user activities has some similarity with k-anonymity. It creates groups of records with at least k-records in each group. However, there are two main differences between our method and k-anonymity. First, instead of utilizing suppression, we applied a bucketization approach to the entire dataset before the clustering step. This makes our method less sensitive to noise when clustering the records. We implemented a per activity micro-aggregation approach. The typical micro-aggregation approaches do not consider the differences between activities to perform the de-identification.
B. Feature Vector Generation
In fact, one of the major limitations of the existing k-anonymity based approaches is the difficulty of creating groups of equal size. Second, the k-anonymity approaches divided the data into sensitive and non-sensitive attributes. While it is straightforward to categorize features in some domains, this task is not easy when the collected data is a sensor-based where the majority of features are numerical. The k-anonymity model divides the data into many equivalent classes such that the values of an identification attribute of any record in the dataset are similar to at least k-1 records.
In this section we discuss the process of converting the sequences in the activity profiles into a set of feature vectors. Each sequence 𝑠𝑒𝑞𝑙 in the activity 𝑎𝑖 profile is converted into a fixed dimension vector 𝑥𝑗 consisting of an entry for each sensor 𝑠𝑘 in the system. The entry 𝑠𝑘 is waited based on the following equation:
Other data perturbation techniques such as micro-aggregation work on numerical attributes to create clusters and replace their data by summaries such as the averages of feature values within each cluster. We decided to address the issues above using a modified version of micro aggregation techniques. Our approach satisfies the following properties:
As an illustrative example, consider the sequence "M4 M3 M4", as one of the sequences in the Read activity profile. This sequence consists of two motion sensors and means that the sensor M4 has a complete cycle of its states (i.e., "ON" followed by "Off"), and then M3 has a complete cycle, followed by M4 again with a complete cycle; given that all these events occurred in the same segment.
1. ∑ |𝑠𝑘 ⊆ 𝑆𝑒𝑞𝑙 (𝑎𝑖 ) | ∑ |𝑠𝑘 ⊆ 𝑆𝑒𝑞𝑙 (𝑎𝑖 ) | 𝑤𝑎𝑖𝑡(𝑠𝑘 ) = × |𝑆| ⊆ 𝑆𝑒𝑞𝑙 (𝑎𝑖 ) |𝑆| ⊆ 𝐷
1. 2. 3.
(1)
2.
It protects privacy of users by anonymizing the features of the collected activities. It has very minor impact on the quality of activity recognition methods
∑ |𝑠𝑘 ⊆ 𝑆𝑒𝑞𝑙 (𝑎𝑖 ) | is the number of times the sensor 𝑠𝑘 appears in 𝑆𝑒𝑞𝑙 (𝑎𝑖 ) |𝑆| ⊆ 𝑆𝑒𝑞𝑙 (𝑎𝑖 ) is the total number of sensors in 𝑆𝑒𝑞𝑙 (𝑎𝑖 ) |𝑆| ⊆ 𝐷 is the total number of sensors in the dataset
Each 𝑥𝑗 is tagged with the label 𝑎𝑖 . The collection of vectors and the corresponding activity labels are then become the training data that is fed into a classifier to learn the activity models. C. Privacy Preserving of User Activities Preserving the privacy of the physical activities, while maintaining the required level of data utility, is required to avoid several forms of inference attacks, which are initiated to recognize specific activities that are considered private. Overall, the generalization techniques are utilized to prevent these attacks by replacing the real values of each feature with more generic values. The data recipient can still receive an anonymized version of the data, which achieves the required level of anonymity but can be still used for classifying nonsensitive activities.
Fig. 5. The micro-aggregation approach to anonymize sensors data
It can be applied for each category of activities, therefore, no need to categorize activities into sensitive and non-sensitive activities. A summary of the perturbation steps is presented in Figure 5.
1) Anonymization of Sensors Datasets
2169-3536 (c) 2016 IEEE. Translations and content mining are permitted for academic research only. Personal use is also permitted, but republication/redistribution requires IEEE permission. See http://www.ieee.org/publications_standards/publications/rights/index.html for more information.
This article has been accepted for publication in a future issue of this journal, but has not been fully edited. Content may change prior to final publication. Citation information: DOI 10.1109/ACCESS.2017.2685531, IEEE Access
> REPLACE THIS LINE WITH YOUR PAPER IDENTIFICATION NUMBER (DOUBLE-CLICK HERE TO EDIT) < Algorithm2: Perturbation of sensor data (Dataset 𝐷, 𝑘) 1| Let k’ be the bucketization factor, 𝐼_𝑎𝑏 be the value of a feature in column a, record b) ==Begin== 2| Divide 𝐷 into 𝑛 datasets, such that 𝑑𝑖 contains records with activity 𝐴𝑖 3| FOR 𝑖=0 to 𝑛 do a. b.
Apply bucketization to each record to replace 𝐼_𝑎𝑏 with (𝐼_𝑎𝑏 − 𝑀𝑖𝑛_𝑎)/ 𝑘’ Cluster the records in D into clusters with at least 𝑘 records
FOR each cluster 𝐶𝑗 do a. Compute the mean of each feature for all records in same cluster b. Replace the values of each feature using the mean End FOR 4| End FOR ==End==
Formally, if 𝐷 = {𝑑1 , … , 𝑑𝑛 } is the set of activities with probability 𝑃(𝑑𝑖 ) for each activity, and 𝐹 = {𝑓1 , … , 𝑓𝑚 } is a feature vector 𝐹 with a set of values that identify the weight of each feature 𝑓𝑖 with activity 𝑑𝑖 , the objective is to generalize the feature vectors of activities 𝑑1 , … , 𝑑𝑘 with a guarantee that even if attackers know the real values of every record in the generalized data except single record, the attacker still cannot infer from the observed perturbed data the value of that one record. The process of adding privacy to the collected data is described in algorithm 2. As a precondition, we first split the pre-processed labeled sensor data D into 𝑛 subsets, each subset contains the records that are labeled with an activity 𝐴𝑖 . The objective is then to create cohesive clusters within each type of activities (e.g. minimizing intra cluster distance). Each cluster 𝑐𝑖 must contain at least 𝑘 records to achieve the required level of indistinguishability. In general, the greater the value of k, is the higher the amount of privacy. At the same time, the higher is the amount of information loss. Before the clustering step, we applied a bucketization function to minimize the effect of noise within each split. We applied k-means clustering to create clusters with at least 𝑘 records. Since there could be clusters with less than k records, the smaller clusters are merged to create clusters with at least 𝑘 records. Next, the value of each feature is replaced with the mean 𝜇𝑓 for a specific feature 𝑓 in the cluster 𝑐𝑖 .
IV. EXPERIMENTS AND RESULTS This section presents the experiments that have been carried to evaluate the proposed activity recognition technique and its privacy preserving version. Three datasets from CASAS project have been used in the evaluation process [61]. Table 1 shows the characteristics of datasets. Active Sensors represent the sensors that reported results within the dataset; some sensors are available in the environment in a sleep mode. The number of activities represents the number of distinct
7
activities’ names within the dataset. The dataset size is the total number of records in the dataset. “Ns” is the number of sequences in the activity profiles labeled with “Others”. Finally, the ratio is the number of “Others” activities to the total number of records within datasets. For Milan and Tulum datasets, the experiments have been carried with and without the "Others" activity. Note that only the active sensors have been used; as some sensors were not active in the test-bed during the data collection process. TABLE 1 DATASET DESCRIPTION NAc Dataset Ns Ts Density Size Ratio=Ns/|D| Milan 33 16 433665 1402 3577 ≈ 39% Tulum 20 11 1048576 471 1901 ≈ 25% Kyoto 25 5 64250 0 120 0 Acs: Active Sensors (Those that fire events during the experiment) NAc: Number of Activities Ns: Number of Sequences Labeled “Others Ts:Total Number of Sequences Dataset
AcS
A. Efficiency of Mining User Activities To measure the effectiveness of the proposed activity profiling, the Naïve Bayes classifier (NBC) have been used and applied on the different datasets. The NBC has been used due to the weighting mechanism adopted in this paper. We computed the accuracy and F-measure according to the following formula [62]: |𝐶𝑜𝑟𝑟𝑒𝑐𝑡𝑙𝑦 𝐶𝑙𝑎𝑠𝑠𝑖𝑓𝑖𝑒𝑑 𝑟𝑒𝑐𝑜𝑟𝑑𝑠| 𝑇𝑜𝑡𝑎𝑙 𝑁𝑢𝑚𝑏𝑒𝑟 𝑜𝑓 𝑇𝑒𝑠𝑡 𝑟𝑒𝑐𝑜𝑟𝑑𝑠 |𝑇𝑃| + |𝑇𝑁| = (2) |𝑇𝑃| + |𝑇𝑁| + |𝐹𝑃| + |𝐹𝑁|
𝐴𝑐𝑐𝑢𝑟𝑎𝑐𝑦(𝐷, 𝑀) =
𝐹 − 𝑚𝑒𝑎𝑠𝑢𝑟𝑒 =
2|𝑇𝑃| (2|𝑇𝑃| + |𝐹𝑃| + |𝐹𝑁|)
(3)
|𝑇𝑃| (True Positive): is the number of correct predictions that an instance is positive. |𝑇𝑁| (True Negative): is the number of correct predictions that an instance is negative. |𝐹𝑃| (False Positive): is the number of incorrect of predictions that an instance positive. |𝐹𝑁| (False Negative): is the number of incorrect of predictions that an instance negative.
Table 2 summarizes the accuracy and the F-measure for the different datasets. As the table indicates, the accuracy is higher when the “Others” activity is excluded from the data.
TABLE 2 ACCURACY AND F-MEASURE Dataset Accuracy F-Measure Milan (Without Others) 0.91 0.91 Milan (With Others) 0.88 0.89 Tulum (Without Others) 0.91 0.91 Tulum (With Others) 0.92 0.92
2169-3536 (c) 2016 IEEE. Translations and content mining are permitted for academic research only. Personal use is also permitted, but republication/redistribution requires IEEE permission. See http://www.ieee.org/publications_standards/publications/rights/index.html for more information.
This article has been accepted for publication in a future issue of this journal, but has not been fully edited. Content may change prior to final publication. Citation information: DOI 10.1109/ACCESS.2017.2685531, IEEE Access
> REPLACE THIS LINE WITH YOUR PAPER IDENTIFICATION NUMBER (DOUBLE-CLICK HERE TO EDIT) < Kyoto
0.98
0.98
8
2) Privacy results
Table 3 shows the results reported in [63] for the same datasets using three different classifiers: Naïve Bayes(NB), Hidden Markov Model (HMM) and Conditional Random Field(CRF). As shown, the activity profiling process, which is applied on the data, has increased the accuracy of the recognition. The enhancement reached to 10-12% compared to the worst accuracy achieved on Table 2.
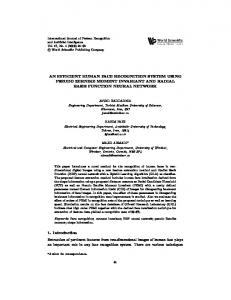
Figure 6 shows the conditional privacy measures for the deidentified datasets using our approach. Our algorithm achieves
TABLE 3 ACCURACY REPORTED FOR THE DIFFERENT DATASETS [61]
Dataset Milan Tulum Kyoto
NBC 0.76 0.59 0.78
HMM 0.77 0.75 0.78
CRF 0.61 0.79 0.97
Fig. 7. Naïve Bayes classification results on anonymized vs. original data (Kyoto dataset)
B. Privacy Preserving of User Activities 1) Evaluation Measures In order to evaluate the proposed method, we utilized the Conditional Privacy, a measure which is based on the differential entropy of a random variable. As shown on [64], the differential entropy of inferring the original attribute value A given the anonymized value 𝐵 is ℎ(𝐴|𝐵) = − ∫ 𝑓𝐴,𝐵 (𝑎, 𝑏)𝑙𝑜𝑔2 𝑓𝐴|𝐵=𝑏 (𝑎)𝑑𝑎 𝑑𝑏
(4)
Ω𝐴,𝐵
𝐴 is a variable that describes the data B is the variable that gives information on 𝐴.
satisfactory results. In particular, by increasing the number of instances per bucket, the Tulum dataset with others class achieves about 1.3 privacy compared to 0.89 when the number of the instances per bucket = 3. The privacy value is almost 1.1 when raising the value of 𝑘 to 600. To compare our results with existing approaches, we implemented a permutation function in Java, we then permutated the values of each feature and measure the privacy for perturbed data. The privacy values for Kyoto, Milan without Others, Milan with Others, Tulum, and Tulum With Others using the simple perturbation function are 0.31, 0.26, 0.34, and 0.45, and 0 respectively. Our approach has higher privacy values compared to such traditional perturbation techniques.
Ω𝐴,𝐵 Identifies the domain of A and B. Therefore the average conditional privacy of 𝐴 given 𝐵, is:
∏(𝐴|𝐵) = 2ℎ(𝐴|𝐵 )
(5)
If 𝐴 represent a feature in the original data and B is a feature in the anonymized data, then if the entropy between A and B is 0, this implies that there is no privacy preserved. As such the higher the value of conditional privacy is the higher the level of the protection. Accuracy and F measure: We utilized accuracy and F measure to validate the effectiveness of our anonymization algorithm. In the experimental evaluation we proved that our method works reliably and is able to produce satisfactory accuracy values while preserving the privacy.
Fig. 6. Average conditional privacy on different datasets
We ran several experiments to measure the accuracy on anonymized versus original data. We utilized Naïve Bayes classifier to run our experiments. This experiment is conducted in two steps:
2169-3536 (c) 2016 IEEE. Translations and content mining are permitted for academic research only. Personal use is also permitted, but republication/redistribution requires IEEE permission. See http://www.ieee.org/publications_standards/publications/rights/index.html for more information.
This article has been accepted for publication in a future issue of this journal, but has not been fully edited. Content may change prior to final publication. Citation information: DOI 10.1109/ACCESS.2017.2685531, IEEE Access
> REPLACE THIS LINE WITH YOUR PAPER IDENTIFICATION NUMBER (DOUBLE-CLICK HERE TO EDIT) < 1. 2.
9
Creating and testing the classification model using the original data. Creating the classification model using the anonymized or perturbed data, then testing the model using the original data. We used accuracy and Fmeasure for the evaluation.
As shown in Figures 7, the classification results are not significantly affected when our perturbation mechanism is applied on the Kyoto dataset, in particular, when the number of records per bucket is less than 5. Due to the limited number of records in this dataset, the maximum number of records per bucket is 20. When the number of records per bucket is 5, the difference in terms of accuracy between the pretreated and the original dataset is less than 0.03, which shows that the perturbation approach does not have significant effects on the statistical characteristics of the features in this dataset. We have validated these results on other datasets, including the versions that contain the unknown activities, which are labeled as others in both Milan and Tulum datasets.
Fig. 10. Naïve Bayes classification results on anonymized vs. original data (Tulum dataset)
Figures 8, 9, 10, and 11 show that there is no significant difference between accuracy and F-measure values on the original and anonymized datasets. In addition, when increasing the number of instances per bucket we noticed a minor decline in accuracy and F-measure; this comes as a cost of achieving higher privacy to each dataset.
Fig. 11. Naïve Bayes classification results on anonymized vs. original data (Tulum with others dataset))
Fig. 8. Naïve Bayes classification results on anonymized vs. original data (Milan dataset)
TABLE 4 ACCURACY-BASED COMPARISON (OUR APPROACH VS. RANDOM PERMUTATION) Dataset/ Accuracy/ Accuracy/ Accuracy/ Accuracy Evaluation original anonymized Anonymized Using Measure data data data random (min number (max number permutation of instances) of instances) Kyoto dataset 0.98 0.94 0.83 0.75 Milan dataset 0.91 0.90 0.76 0.70 Tulum 0.92 0.90 0.78 0.71 Milan 0.88 0.87 0.81 0.73 (with others) Tulum 0.92 0.91 0.82 0.72 (with others)
Table 4 shows an accuracy-based comparison between our approach and the random permutation which only adds a random noise to the values of each feature. The values of the achieved classification accuracy using our approach are higher than using random perturbation, particularly, when the number of instances per bucket is small. V. DISCUSSION OF RESULTS
Fig. 9. Naïve Bayes classification results on anonymized vs. original data (Milan with others dataset)
This section discusses the results we reported in section 6. The two-fold discussion will focus on justifying performance results in addition to the privacy one.
2169-3536 (c) 2016 IEEE. Translations and content mining are permitted for academic research only. Personal use is also permitted, but republication/redistribution requires IEEE permission. See http://www.ieee.org/publications_standards/publications/rights/index.html for more information.
This article has been accepted for publication in a future issue of this journal, but has not been fully edited. Content may change prior to final publication. Citation information: DOI 10.1109/ACCESS.2017.2685531, IEEE Access
> REPLACE THIS LINE WITH YOUR PAPER IDENTIFICATION NUMBER (DOUBLE-CLICK HERE TO EDIT)
REPLACE THIS LINE WITH YOUR PAPER IDENTIFICATION NUMBER (DOUBLE-CLICK HERE TO EDIT)