An Efficient Algorithm for Outlier Detection in High Dimensional Real Databases Carlos H. C. Teixeira, Gustavo H. Orair, Wagner Meira Jr. Computer Science Department, Federal University of Minas Gerais {carlos, orair, meira}@dcc.ufmg.br Srinivasan Parthasarathy Department of Computer Science and Engineering, The Ohio State University
[email protected] Abstract Detecting outlier patterns in data has been an important research topic in statistics, data mining and machine learning communities for many years. Research in identifying effective solutions to this problem have several interesting applications in a myriad of domains ranging from data cleaning to financial fraud detection and from network intrusion detection to clinical diagnosis of diseases. Among the different algorithms, statistical (parametric) approaches and distance-based outlier detection are the most popular in use. The former is well grounded but often has difficulty scaling to large and high dimensional data. The latter is relatively efficient and empirically found to be effective on a number of domains but scalability is still an issue in spite of a fair bit of research on the topic. To address this limitation, in this work, we propose Atalaia, an efficient and scalable distance-based algorithm for detecting outliers in large high dimensional databases. Central to our algorithm is a fast strategy to estimate the unusualness of a record within the database and use a rank-ordered approach to evaluate records. Our algorithm partitions the database and ranks the objects that are candidates to be an outlier, reducing significantly the number of comparisons among objects. We evaluate different ranking heuristics in a comprehensive set of real and synthetic databases. Further, Atalaia also handles heterogeneous databases, i.e, those containing both categorical and continuous attributes. The results show that our algorithm outperforms by up to 73% the state-of-the-art distance-based outlier detection algorithm.
1 Introduction The goal of Outlier Detection is to identify and analyze unusual records from a database. Such information is key for scenarios such as fraud detection, athlete performance analysis, tax evasion combat, network intrusion detection, niche marketing search, disease diagnosis, credit approval decision support, among several others. The outlier detection problem has been extensively studied in Statistics [14], where the data is assumed to follow a parametric distribution and the objects that do not fit the model properly are considered outliers. However, the applicability of such approaches is limited as in many application domains the data distribution is unknown. Moreover, the time complexity of such methods suffer severely on dataset with high dimension and large number of records. Several researchers proposed non-parametric approaches [6][15][12] for outlier detection that do not rely
on data distributions. The central idea to these methods is a measure of similarity (or distance) between objects. They fall in two categories: density-based and distance-based. Those in earlier category [6][15] determine the outliers by analyzing the local density of the objects in the dataset. While in these methods, the role of distance is implicit, the methods from the latter category use the distance more explicitly. [12] is the flagship algorithm for the latter category. It is based on the well known nearest-neighbor principle, which defines a point as outlier based on its distance from its neighbors. The basic intuition is that the greater the distance of an object to its neighbors, the more likely it is an outlier. Although non-parametric approaches are more suitable for outlier detection, their complexity increases quadratically with the number of objects, making them unsuitable for mining large databases. This can be a problem for very large datasets in the tera- (peta-) byte scale such as those found in clinical trials data and network data, for example. Distance-based approaches were then enhanced for handling large and high-dimensional databases through pruning strategies that reduce the number of inter-object distance calculations[16][4]. The intuition of such strategies is to discard those objects that are clearly not outliers as early as possible. In practice, the result set containing the top-n outliers currently found is saved, and the k th nearest neighbor (kNN) distance is used for setting the pruning threshold. Recently, strategies for improving the efficiency of “pruning rules” were proposed [8][19]. A simple and very efficient strategy is to initialize the pruning threshold as high as possible based on the outlierability (unusualness) score of the dataset, i.e., the kNN distance of the outliers, but setting properly this threshold is a non-trivial task even for an expert. [16] proposed a method to estimate the initial threshold, but their method is computationally expensive and scales poorly for high dimensional databases. In this work, we propose Atalaia, an algorithm for outlier detection, which employs the rank-ordered search for outliers(RSO) strategy. The RSO ranks the objects according to their estimated outlierability score, enabling
the determination of higher pruning thresholds as earlier as possible. In this paper, we intend to demonstrate that: i) we can estimate the outlierability score of objects efficiently ; and ii) sorting outlier candidates based on the estimated outlierability score significantly improves the performance of distance-based algorithms. We validate our assumptions by proposing three simple metrics that estimate the outlierability of the objects based on clustering features. The results show that our strategy is able to find objects with high outlierability score, and detects the actual outliers upfront. Furthermore, we compare the performance of two ranking strategies: rank-ordered search for outliers(RSO) and rank-ordered search for neighbors (RSN)[8], for improving the “pruning rule” in various real and synthetic databases. These results validate the claims that our algorithm consistently outperforms the state-ofthe-art RBRP algorithm, which applies RSN, and that both ranking strategies may be used together to achieve even better performance. Besides its detection ability, it is important that outlier detection algorithms handle mixed attribute datasets, i.e., those containing both categorical and continuous attributes. Nevertheless, the techniques proposed in the literature[8] usually work just for continuous attributes. To address this limitation we extend the rank-ordered strategies for distancebased algorithms to handle categorical and continuous attributes. To summarize, our main contributions are: • Evaluation of metrics to find objects with higher outlierability scores; • Proposal and evaluation of a heuristic for rank-ordered search for outliers (RSO); • Extension of rank-ordered strategies to handle mixed attribute datasets naturally; and • Experimental evaluation of RSO, RSN and both strategies to various real and synthetic datasets. The remainder of the paper is organized as follows. Section 2 examines some related work. Section 3 presents our algorithm for outlier mining. Experimental results are described in section 4 and conclusions and future work directions are stated in section 5. 2 Related Work In this section we discuss work germane to the algorithms proposed in this article. We employ the notations from Table 1 unless otherwise noted. An important class of non-parametric techniques for outlier mining is based on clustering algorithms, such as CLARANS [13], DBSCAN[7], BIRCH[22], and CURE [9], which identify and prune outliers naturally as part of the
clustering process. Notice that, for such techniques, the concept of outliers is subjective, an artifact of the clustering process, and often depends on the shape of the clusters. Inherent to such methods is the use of a distance or similarity based measure. The first explicitly distance-based outlier detection technique was proposed by Knorr and Ngr et al[12]. This method is a nearest-neighbor based technique where objects that have not enough neighbors are considered outliers. Such distance-based techniques have become quite popular in the outlier mining context. This approach requires one to examine the neighborhood of an object to qualify whether it is a normal or an outlier object. Objects in a dense neighborhood have closer neighbors and are stated as commom objects, while outliers have farther neighbors. The distance-based techniques have become quite popular, as a consequence of advantages such as not requiring apriori knowledge about the data distribution, and demanding just the definition of a distance metric for their application to any dataset. It is interesting to note that there are several popular techniques that fall under this realm, but their definition of outliers may differ: 1. Outliers are objects with fewer than k neighbors in the database, where a neighbor is an object that is within a distance R. (Knorr and Ngr’s definition)[12]. 2. Outliers are the n objects presenting the highest distance values to their respective k th nearest neighbor. (kNN definition) [16] [4] [8]. 3. Outliers are the n objects presenting the highest average distance to their respective k nearest neighbors [2]. In [16], it was proposed to use the kNN distance as an object outlierability score. This score enables the identification and ranking of outliers by just determining which objects have the highest outlierability scores (kNN definition). The simplest approach is the Nested Loop (NL) technique, which calculates the inter-object distances between all objects and selects those presenting the largest kNN distance, resulting in a quadratic complexity as a function of the number of objects. Such complexity motivated other efforts towards more efficient strategies for kNN (kNN queries), leveraging efforts from other application scenarios [17]. Several proposals were evaluated varying from index-based spatial structures, such as general trees (such as KD-trees [5], R*-trees [16]) to uniform cell-based partitioning. However, these approaches are affected by the curse of dimensionality[12] [16], and do not scale well as the number of dimensions increases. Ramaswamy et. al [16] also proposed another solution that partitions the database through an efficient clustering algorithm such as BIRCH [22]. After the clustering phase, it estimates the maximum and the minimum distances between
Symbol n k Dk (p) k Dmin |P | SS(P ) R(P )
Description Number of outliers on result set to be identified in the database Number of nearest neighbors to be considered Distance between point p and its kth closest neighbor Smallest distance between a point and its kth nearest neighbor from result set Number of objects of a partition P The spatial size value of a partition P The MBR diagonal value of a partition P
Table 1: Notations
pairs of partitions based on a MBR (“Minimum Bound Rectangle”) structure and these bounds are then used to estimate an outlierability threshold score, which supports the elimination of trivial entire partitions, where outliers cannot occur. This algorithm showed better performance than spatial index-based algorithms in high dimensional databases, that usually contain up to 10 dimensions. Further, there are problems associated with the weak estimator used for pruning entire partitions. More recently, outlier mining techniques designed specifically for high-dimensional datasets were proposed. Bay and Schwabacher presented ORCA [4], an NL-based algorithm that employs a simple “pruning rule”, the ANSS (approximate nearest neighbor search) (definition 1). Note k , used as a pruning threshthat, as we process objects, Dmin old, may be assigned to the lowest Dk (p) of the current outliers result set, so that it grows monotonically and improves the pruning efficiency. Also, to ensure that the object original ordering in the database does not reduce the pruning effectiveness, the authors proposed a pre-processing step that shuffles the objects. DEFINITION 1. When searching for the k nearest neighbors from an object p, if the current Dk (p) value is less than k Dmin , we can certainly point out p as an outlier candidate.
In follow up work Ghoting et al.[8] show that in databases containing just a few outliers, the ANNS may be very inefficient, presenting a quadratic complexity O(N 2 ). The authors proposed RBRP, a two-phase algorithm that improves the pruning rule by finding near neighbors quickly. Such enhancement is achieved by clustering the objects in a pre-processing phase and the resulting clusters are then used to sort the search space while looking for near neighbors, which improves the effectiveness of ANSS and results in a superior performance compared to ORCA algorithm. The authors also demonstrate that RBRP has log-linear performance both empirically and theoretically (average case complexity)[8]. Recently, independent of our current work, Wu and Jermaine[19] propose a very interesting method for guessing extreme object values from a database, and demonstrate
its applicability to distance-based outlier detection. This approach relies on a Bayesian approach to estimate the kNN distance for each point p. These estimates are then used to order which objects will be considered first as candidate outliers. This idea, while extremely interesting, suffers from some drawbacks. First, it relies on a parametric formulation, which requires making some statistical distributional assumptions. Second, as noted by the authors the output of their algorithm is not guaranteed to be exactly the same as ORCA – it is at best an approximation – errors in the estimates will lead to errors in outliers detected and the ranking of outliers. Third, it is not clear how the algorithms proposed will scale or work on high dimensional and large datasets. The dependence on the parameterized Bayesian formulation is likely to limit the performance in such cases. In a different research direction, out-of-core distancebased algorithms were proposed, such as [18], [1] and [20], these algorithms focuses on I/O optimization and perform just single sequential scanning on datasets. However, these algorithms have some shortcomings. [18] and [1] are based on Knorr and Ng’s definition of outliers where the user specify k and R parameters. The efficiency of these algorithms depends extremely on the user parameter R, but choosing a proper value to R is very dificulty and, if R is too large, their algorithm’s perfomance may degrade drastically. kNN definition is more intuitive, since the parameters k and n are easier to define and understood, and it gives a ranking of outliers. One may seen algorithms with kNN definition as adaptative algorithms that estimate a proper value to R parameter based on n, which is the number of outliers (result set size) that the user expect to analyze. In [1], their algorithm was compared against ORCA and RBRP, but the strong dependency on the k initial thresholds and the fact that no initial Dmin threshold was defined for the ORCA and RBRP experiments weaken their conclusions. In [20], the authors proposed an algorithm for mining discord time-series based on the kNN definition of outliers. This work needs just two sequential scans on the dataset and is based on an efficient pruning of candidates on the first scan, similarly to SNIF and DOLPHIN, although it needs the user to set/specify the R parameter, which is crucial to
its efficiency. Since the authors recognize this drawback, a method to set/specify R was proposed: (i) select a uniformly random sample S from the dataset; (ii) detect n outliers in S using a fast memory based outlier detection method; and (iii) use the worst outlierability score found in the S’s outliers to determine the R value. Although this proposal showed to be very efficient, the method to select the discord candidates, the first scan on datasets just works if k is equal to 1. As a result, the quality of the estimation is not good, as we discuss later in this paper.
(3.2b)
v u n uX x2 , distcont (p, q) = t i
i=1
(3.2c)
dist(p, q) = distcont (p, q) + distcat (p, q)
Another important concept used in our work is the MBR structure. The MBR (def. 2) is the smallest hyper-rectangle containing all objects that belong to a given partition [17]. Partitions may be a cluster [8] or a node of a spatial tree [16]. The major diagonal size of the MBR estimates the max3 Mining Distance-Based Outliers imum distance between any two objects belonging to the parThe distance-based techniques became quite popular for tition. Since the MBR original definition is applicable just outlier mining. The kNN approach verifies the neighborhood to continuous attributes, we extended its definition towards of an object in order to classify it as an outlier. An object supporting categorical attributes (the MBR-categorical defithat presents near neighbors is not an outlier, otherwise it is nition in def. 3). stated as an outlier. An advantage of these techniques is that the user does not need to know in advance the distribution DEFINITION 2. Continuous MBR is a hyper-rectangle with of the dataset, demanding just the definition of a distance n dimensions composed by two extremes Sl and Su that define its major diagonal: metric, e.g., Euclidian distance. This section describes Atalaia, our distance-based out- Sl = [Sl1 , Sl2 , . . . , Sln ] and Su = [Su1 , Su2 , ..., Sun ], lier detection algorithm, and shows how to improve the ef- where Sli ≤ Sui ∀ 1 ≤ i ≤ n. fectiveness of the pruning process. Moreover, we discuss two important features of Atalaia. The ability to mine hetero- DEFINITION 3. Categorical MBR is a hyper-rectangle with geneous databases and the key factor of Atalaia’s efficiency, c categorical dimensions composed by two extremes Ql and i.e., find objects on the database with higher outlierability Qu which defines its major diagonal: Ql = [Ql1 , Ql2 , . . . , Qlc , ] and Qu = [Qu1 , Qu2 , . . . , Quc ], score using a simple and fast method. where Qli ≤ Qui ∀ 1 ≤ i ≤ c.
3.1 Handling heterogeneous databases In our work, the objects may contain both numerical and categorical attributes, demanding an extended concept of metric distance to also handle categorical attributes. Without loss of generality, we considered that categorical values are represented by integers and there is an injective function C →function I that maps the domain of categorical values to the set of integers that represent them. Throughout this work, for sake of simplicity, whenever we talk about categorical values, we refer to the integer that represents it. Further, we employed the Hamming distance of the categorical attributes to calculate the distance between objects. Then, the difference between two categorical values x and y is given by:
(3.1)
x−y =
(
0 if x = y; 1 if x 6= y
This definition of Categorical MBR is valid since that categorical values are represented by integers. The basic idea is that each categorical dimension, i.e., Qli and Qui have distinct values, if there at least two objects with distinct values for this dimension. So the distance between Ql and Qu , the major diagonal size, also estimates the maximum distance between any two objects w.r.t. categorical attributes, actually it is a strict upper bound. Let S and Q be the continuous and categorical MBR structures, respectively. To handle mixed-attributes we define the MBR-prototype (def. 4) as follows: DEFINITION 4. MBR-prototype is a hyper-rectangle with d dimensions composed by two extremes Rl and Ru which defines its major diagonal: Rl = [Sl1 , . . . , Sln , Ql1 , . . . , Qlc ] and Ru = [Su1 , . . . , Sun , Qu1 , . . . , Quc ], where d = n + c.
The distance between the objects p and q is given by the sum of the Hamming distances of the c categorical attributes and 3.2 Finding objects with higher outlierability score The knowledge of the outlierability score of the dataset, i.e., the the Euclidian distances of the n numerical attributes: kNN distance of the outliers, may be used as a threshold reducing significantly the number of distances calculated c X among objects. As we mentioned, the efficiency of various pi − qi (3.2a) distcat (p, q) = recent out-of-core algorithms such as [18], [1] and [20] is i=1
extremely dependent on the R parameter, an initial threshold, that must be specified by the user. However, there is still a demand for such estimation strategies, since previous methods (e.g., [16]), are computationally expensive and scale poorly on high dimensional databases. Keogh and his colleagues[20] also proposed a procedure to set/specify the R parameter based on a dataset sample. The idea is to set the R parameter to the smallest Dk (p) value of the outliers found on the sample. The effectiveness of this procedure depends on the size of the sample and the n parameter used to detect the outliers in the sample. Given that the estimation is not a strict bound, it may determine very low threshold values, specially in datasets with few outliers where actual outliers may not be sampled, and also it may overestimate the threshold value, so in this case, the authours proposed to repeat the mining for outliers fixing the R parameter. In our work, we proposed three simple heuristics to find objects with higher outlierability score based on clustering techniques, for sake of partitioning the database. Although there are several outlier mining algorithms that rely on a database partitioning phase, such as [16] and [8], an important piece of information was not exploited in previous works: the capacity of the clustering methods to identify outliers. In fact, the first non-parametric techniques for outlier mining are based on clustering algorithms, such as CLARANS [13], DBSCAN[7], BIRCH[22], and CURE [9]. In our case, given a set of partitions obtained by any clustering method, the three heuristics proposed consider the following criteria: (1) number of objects in the partition, (2) spatial size of the partition, and (3) density of the partition. The first heuristic is based on the intuition, exploited by clustering algorithms, that partitions containing just one or even few objects are likely to contain outliers. If there are two partitions with the same number of objects, then, the objects of the partition with the largest spatial size will be considered as objects with higher outlierability score. This heuristic may fail for partitions with more than k objects, as we discuss next. Let P1 and P2 be any two partitions, where |P1 | > |P2 | > k and SS(P1 ) >> SS(P2 ). In this case, P1 may contain objects with higher outlierability score, because P1 has a bigger spatial size and then the kNN distances in P1 tend to be higher. The second heuristic tries to minimize such problem. It ranks the partitions by the spatial size occupied by them, so that biggest partitions will be considered first, because they tend to have low-density regions that may contain outliers. If there are two partitions with the same spatial size, the objects with higher outlierability score will belong to the partition with the smallest number of objects. Notice that, obviously, number of objects and spatial size criteria are complementary and may be combined to produce better results, motivating the third heuristic, density, |P |−k which is defined by SS(P ) . This definition allows to use the
best of each criterion. For example, partitions with less than k objects are likely to contain outliers as well as low-density regions of partitions with more than k objects. Since obtaining the spatial size of partitions in high dimensional datasets is computationally expensive, in order to implement the second and third heuristics, we need to estimate it. Our strategy is to use the value of the MBR diagonal length[17], described in the previous section. We |−k then define density as |P R(P ) , where |P | is the number of objects in partition P , R(P ) is the MBR diagonal length of P , and k is the number of neighbors. 3.3 The Atalaia Algorithm As discussed in previous sections, most of the techniques proposed in the literature for outlier detection exploited pruning and/or rank strategies to optimize the search for nearest neighbors. Ramaswamy [16] applied the pruning ideas proposed in [17] for improving the efficiency of kNN strategies. On the other hand, ORCA[4] and RBRP[8] employed two different rank strategies during the search for neighbors to optimize the ANNS. While ORCA uses a random heuristic (shuffle the objects), RBRP employs RSN. We then distinguish two strategies to enhance the ANNS pruning rule : • Reduce Dk (p) faster, so that we are able to find neighbors of an object p efficiently; k • Raise Dmin faster, finding objects with high outlierability factors or estimating a higher lower bound for this factor.
Notice that the previous works (ORCA and RBRP) worried about the efficiency of the search for nearest neighbors, i.e., the first strategy. In our algorithm, Atalaia, we exploit the second strategy. Our assumption is that it is possible to find objects that have high outlierability scores using simple heuristics based on the partitions generated by a clusteringbased preprocessing. We can then use the scores of these obk jects to increase Dmin (the pruning threshold) faster, making ANSS more efficient. We divide our algorithm into two main phases: (1) Partitioning the database and (2) Searching for outliers. Partitioning the database One of the simplest, and more popular, clustering algorithms is k-means[10] where each partition has a representative, called centroid. The original k-means algorithm was proposed for just numerical attributes, and it was extended by kprototypes [11], which also handles categorical attributes by determining centroids as the average of numerical attributes and the mode of categorical attributes. It adopts the distance definitions presented in 3.2c.
A divisive hierarchical clustering algorithm that is similar to k-means was used in [8]. This algorithm is basically the k-means, but it refines the clusters found whenever these clusters are larger than a threshold, that is, it applies the clustering algorithm to the large cluster splitting it into smaller clusters. The average-case runtime of this technique is O(N log N ), where N is the number of objects.
RSN can be implemented easily by just changing the loop found in line 7 of Algorithm 1. This loop defines the order in which neighbors are checked. We rank the partitions so that objects from nearer partitions are checked first. In other words, imagine that the object o in partition P will be examined. First, the object o is compared to the other objects from its own partition and then to the objects from other partitions, according to the proximity between partition centroids, for instance.
In our work, we extended the divisive hierarchical clustering from [8], based on the k-prototypes [11] so that we are able to mine mixed-attribute databases. Algorithm 1 Search for Outliers Algorithm It is important to emphasize that any partitioning technique may be used, since the goal of such preprocessing is to enhance the search for outliers. Our goal is to show that using a clustering algorithm we may identify fast objects with higher outlierability and this may be used to enhance the pruning rule. So far, we chose to use a simple clustering algorithm and the usage of better clustering algorithms that generate higher quality clusters may improve even more the efficiency of our algorithm, but studying how the quality of the clusters affects Atalaia is beyond the scope of this work. Searching for Outliers The second phase of our algorithm is the search for outliers, which is given in Algorithm 1. The algorithm inputs are the number of neighbors (k), the number of outliers to be identified (n), and the ranked partition set (B), containing l partitions {P1 , P2 , P3 , ..., Pl }, where P1 is the partition that is more likely to contain outliers according to the heuristic employed. In other words, Atalaia evaluates the partitions according to their outlierability, that is, it starts from P1 , then checks P2 , until Pl is checked. Thus, we aim to enhance the ANNS prunning rule. Atalaia performs the searching for outliers (Algorithm 1) as follows. For each partition, we evaluate each object o as a potential outlier. First, we search for nearest neighbors of object o inside its partition and then in objects from other partitions. For each neighbor, we check whether it belongs to its nearest neighbors, that is, less than k neighbors have been evaluated or being closer than one of the current k nearest neighbors. If any of the two conditions hold, we update the list of the k nearest neighbors. After updating the list of neighbors, we check whether we have enough information that allows us to determine if o is not likely to be an outlier, based on the fact that one of its kN N distance is greather than k . After getting out of the loop, it updates the outDmin k liers list and the value Dmin .
Procedure: Search for Outliers Inputs: k, number of neighbours considered; n, number of outliers to be identified; B, ranked partition set Outputs: O, the outlier result set Let: Closest(o, S, k) returns the k nearest elements in S to o Let: Maxdist(o, S) returns the maximum distance between o and an element in set S Let: TopOutlier(S, n) returns the top n outliers in S based on the distance to their kth nearest neighbour. Begin k 1: Dmin ← 0 {Reset the threshold pruning} 2: O ← ∅ {Make empty the outlier result set} 3: for all partition p in B, ranked by the outlierability do 4: for all object o in p do 5: N eighbours(o) ← ∅ {Make empty the o neighbours’s set} 6: {Searching for neighbours of object o} 7: for all partition q in B, starting by the partition p do 8: for all v in q such that v 6= o do 9: if |Neighbours(o)| < k or Distance(o, v) < Maxdist(o, Neighbours(o)) then 10: Neighbours(o) = Closest(o, Neighbours(o)∪ v, k) 11: end if k 12: if |Neighbours(o)| ≥ k and Dmin > Maxdist(o, Neighbours(o)) then 13: break 14: end if 15: end for 16: end for 17: O = TopOutliers(O ∪ o, n) k 18: Dmin = min(score(o)) for all o in O 19: end for 20: end for End
4 Experimental Results In this section, we perform an experimental evaluation of the ranking heuristics and the proposed algorithm using three real and three synthetic databases. We choose these databases as they are representatives and of diverse characNotice that there is no ranking of objects in each parti- teristics in terms of the associated problems. Also, they arise tion considered, which is the projection phase of RBRP, from different application domains. A brief summary of the a strategy that is complementary to ours. However, the databases is presented in Table 2 and we give a brief descrip-
Database
# Objects
Government Auctions KddCup1999 Forest Covertype Uniform30D ClusteredData ClusteredData with noise
268,170 4,898,430 581,012 1,000,000 500,000 500,500
# Attributes # Cont # Cat 6 7 34 8 10 45 30 0 30 0 30 0
Table 2: Database descriptions
tion of them next: • Government Auctions : The database contains records associated with purchases performed by various government institutions from Brazil. • KddCup1999 : This data set contains a set of records that represent connections to a military computer network where there have been multiple intrusions and attacks by unauthorized users. The raw binary TCP data from the network has been processed into features such as connection duration, protocol type, number of failed logins, and so forth. This data set was obtained from the UCI KDD archive [3]. • Forest CoverType : Database with the forest cover type for 30 x 30 meter cells obtained from US Forest Service (USFS) on Rocky Mountain Region data [3]. • Uniform30D : This is a synthetic database with 30 dimensions where the attribute values were generated randomly between (0.5, -0.5), resulting in a uniform distribution. • ClusteredData : This synthetic database was generated based on various well-defined uniform and gaussian distributions in a multi-dimensional space where all attributes are in the range (2, -2). • ClusteredData with noise : It consists of the ClusteredData database augmented with a few noisy objects that follow an uniform distribution between (2, -2). The ClusteredData and ClusteredData with noise databases contain well-defined clusters and will be used to show the impact, in terms of the algorithm’s performance, associated with the presence of noise. Notice that on all real datasets the numeric attributes were normalized according to a normal distribution and categorical values were converted to an integer representation. The experiments were performed on an AMD Athlon 64 3200+ with 2 Gb RAM. In all experiments we looked for the top 30 outliers (n = 30), using k = 5 as the number of
nearest neighbors1. Notice that in the comparisons involving ORCA, RBRP and our method, the outliers found by all three approaches are the same. 4.1 Heuristics Effectiveness Before we present our results, we explain why the problem is difficult and validate the available approaches to resolve it. The main obstacle is k to set the threshold value, Dmin properly. The higher the threshold, the better the pruning. But, setting it too high may return no outliers at all. There are two different approaches that can be applied: (1) estimating a good initial threshold value and (2) inducing a fast convergence toward this value. Yankov et. al. [20] proposed a sampling method to to set/specify the R parameter that can be used as the initial k Dmin value for Atalaia. In order to assess the quality of the estimations of this proposed sampling method, we performed the following experiment. We created 10 random samples for each of the datasets Government Auctions and ClusteredData with noise. We set the size of the sample to 103 , as suggested by the authors[20]. We first detected the outliers in each sample setting k = 1, and n = 10, which are the same parameter values used in [20]. We then compared the R parameter, the estimated threshold, to the k actual Dmin value, i.e., the smallest kN N distance of the outliers found on the whole dataset considering k equal to 1. In the Government Auctions dataset, the threshold value was k greater than the actual ideal Dmin value in 40% of the tests, where it failed to detect all the n outliers. In worst case, only 4 outliers were detected from the 10 expected. In the synthetic dataset ClusteredData with noise, we verified that Yankov’s method estimates the threshold value significantly lower than the actual/ideal threshold. In all the 10 sample sets, the estimated threshold ranges were from 1.19 to 0.98, but the actual outlier score were 6.84. This dataset has only few outliers (0.5%) and a sampling rate of 1% does not capture the global characteristics of the dataset as it is very unlikely that actual outliers would be sampled. Since the resulting estimated score is associated with the kN N distance of common objects instead of outliers, it does not perform well. One may argue that to detect the outliers on the sample, we should set the n proportional to the size of the sample, but notice that if we use this approach, the results on Government Auctions would be much worse. So, we can see that the method here proposed are not robust; without prior knowledge on the outlier rate of the dataset, user cannot really apply a sampling rate judiciously. Finally, we have to remark that all the out-of-core algorithms([18], [1] and [20]) will fail to mine datasets if a good R parameter is not specified by the user or properly estimated. If there is no efficient and robust method to specify a 1 The
largest partition size was 16000 objects [8].
2.5
4
4
2
3
3
1.5
2
Density Objects Size Random
1
0 0x100
1x10⁵ 2x10⁵ Number of objects considered
Threshold
5
Threshold
Threshold
5
2
Density Objects Size Random
1
0 0x100
3x10⁵
(a) Government Auctions
1x10⁶
2x10⁶ 3x10⁶ 4x10⁶ Number of objects considered
1
Density Objects Size Random
0.5
0 0x100
5x10⁶
1x10⁵
(b) KddCup1999
0.8
2x10⁵ 3x10⁵ 4x10⁵ 5x10⁵ Number of objects considered
6x10⁵
(c) Forest Covertype
1
8 7
0.7 0.8
6
0.4 0.3 0.2
Density Objects Size Random
0.1 0 0x100
2x10⁵ 4x10⁵ 6x10⁵ 8x10⁵ Number of objects considered
0.6
Threshold
0.5
Threshold
Threshold
0.6
0.4
1x10⁶
(d) Uniform30D
0 0x100
1x10⁵ 2x10⁵ 3x10⁵ 4x10⁵ Number of objects considered
4 3 2
Density Objects Size Random
0.2
5
Density Objects Size Random
1 5x10⁵
0 0x100
(e) ClusteredData
1x10⁵
2x10⁵ 3x10⁵ 4x10⁵ Number of objects considered
5x10⁵
6x10⁵
(f) ClusteredData with noise
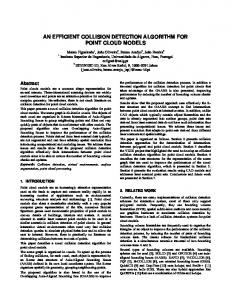
k Figure 1: Dmin value for various databases
Database Government Auctions KddCup1999 Forest Covertype Uniform30D ClusteredData ClusteredData with noise
Density 11.88 748.23 280.83 2933.51 91.88 40.60
Heuristics Objects Size 11.69 19.09 806.26 920.01 295.24 308.27 2852.85 2690.40 79.95 173.74 42.23 41.80
Random 57.88 1317.15 327.02 2967.11 182.05 141.65
Average Gain 79.79% 43.19% 14.13% 9.33% 56.08% 71,18%
Table 3: Heuristics execution time in seconds (90% confidence)
good initial threshold, Atalaia achieves a fast convergence of k the Dmin value. We validate the above claim by showing that that it can estimate outlierability scores based on the different heuristics that it uses. More specifically, we have measured k the current pruning threshold, Dmin , during the execution of the algorithm for each heuristic. We used as baseline a random heuristic, which ranks the partitions randomly. As k previously mentioned, Dmin measures the smallest kN N distance from the current result set. The results, shown in Figure 1, represent the average value from 10 executions. Notice that we inserted 90% confidence interval bars on some breakpoints, but some bars may not be visualized cause they are too smalls, specially when we apply rank-ordered strategies.
The results in Figure 1 show that the density, objects and k size heuristics present statistically greater Dmin values than the random heuristic, except on the Uniform30D database. k In real databases, the convergence of Dmin values of the proposed heuristics consistently outperform the random heuristic, with significaint differences in the Government Auctions and KddCup1999 databases. Our ranking heuristics also performed better on the Forest Covertype database, but the results were less impressive, which is explained by the large number of categorical attributes in that database and the associated low-quality partitions that are generated by the kprototype algorithm. An alternative to improve the quality of categorical clusters is studied in [21]. Considering the synthetic databases, we notice that the
size heuristic does not perform as well. Its estimates are poor as a result of the delay to determine the proper “pruning threshold” while processing the database ClusteredData as shown in Figure 1(e). We explain such behavior by the proximity of the clusters determined using the spatial heuristics, making it difficult to find the outliers. On the other hand, in the presence of noise (ClusteredData with noise dataset), that heuristic has performed dramatically better than random heuristic(Figure 1(f)). The final score of the outliers in the ClusteredData database was 0.87 and it increased to 7 for the database containing inserted noise. One immediate consequence of such improvement is the reduction of the execution time for the latter. In summary, the results for the Uniform30D database showed that none of the heuristics ranked the objects properly for sake of identifying outliers, which is expected since the objects are distributed uniformly and the database has no significant outliers. We may summarize two major conclusions from these results. First, the ranking heuristics we proposed are able to determine the “pruning threshold” by evaluating a smaller number of objects (when compared to the random heuristic). Second, the density-based heuristic, in general, provides the best results, estimating more precisely which clusters contain outliers. Further, we validated our assumption that we are able to identify outliers faster by using simple heuristics that are based on the characteristics of data partitions. 4.2 Heuristics Efficiency In order to demonstrate the impact of the sorting heuristics on the algorithm efficiency, we use paired comparison analysis between the results of the various heuristics proposed for all databases, executing each experiment 10 times. In all cases, the two-sided confidence interval was calculated using a 10% significance level. The execution times are presented in Table 3. As we can observe in Table 3, the results show that the use of ranking heuristics significantly impact algorithm performance. In general, we have an impressive gain in terms of efficiency for the real databases. In Forest Covertype, the gain was 14% on average compared to the random approach. The performance of the sorting heuristics were even better for Government Auctions and KddCup1999, achieving average gains of 80% and 43%, respectively. Similarly, our heuristics significantly improved the performance for ClusteredData and ClusteredData with noise databases. We performed a more detailed analysis and found that, k when our algorithm determines Dmin faster, the performance increases significantly, which explains the poor performance of the size heuristic on the ClusteredData database compared to other heuristics. Further, we can see clearly that heuristics based on density and number of objects achieved excellent results in all databases, confirming once more the correlation between the speed of determining the pruning threshold and the algorithm performance.
In summary, we validated our hypotheses by showing that finding outliers fast is a key factor for a good performance in distance-based outlier algorithms. 4.3 Scalability In this section we will assess our algorithm scalability by comparing it to the state-of-the-art RBRP in databases of various sizes generated by sampling the databases described in Table 2. We aim to demonstrate that our proposal (RSO) is more effective than RBRP’s optimization (RSN) towards improving the performance of the outlier detection algorithm. Further, the combination between RSO and RSN strategies provides an even more efficient technique. The density-based heuristic was used as our strategy. Also, to make possible the comparison for databases with categorical attributes, we extended the RBRP algorithm using the k-prototypes approach. We compared our methods with ORCA. Our results on ORCA were similar to those reported by [8] in that RBRP always outperformas ORCA so we do not repeate those results here. The results (Fig. 2) demonstrate that our approach consistently outperforms RBRP in most of the experiments. Analyzing the results for the real datasets, we can observe that our algorithm provides an average gain of about 73% and 40% respectively for the Government Auctions and KddCup1999 database. Also, RBRP presented a loglinear behavior while Atalaia was linear on KDDCup1999 dataset. Meanwhile, in the Forest Covertype experiment, we verify that RSO was not more efficient than RSN, what can be easily explained by the fact that the convergence speed of the threshold value for this dataset was not significant as previously showed. On the other hand, we were able to improve the performance by 11% on average when using both ranking strategies. Considering the synthetic databases, the proposed algorithm also presented better results. Our algorithm was on average 31% and 48% more efficient than the state-of-theart RBRP in ClusteredData and ClusteredData with noise datasets, respectively. Notice that both algorithms showed a sub-linear complexity in these cases. In the Uniform30D database, the RBRP algorithm was better than our approach, it may be explained because this dataset doesn’t have outliers, and, thus, the density-based heuristic couldn’t determine the pruning threshold faster. Based on these results, we demonstrated that examining first the objects with estimated higher outlierability score (RSO) has a greater impact on performance compared to the technique of finding near neighbors faster (RSN) proposed in RBRP. Moreover, we can further improve the performance of distance-based algorithms by combining both strategies. We may better understand the scalability results by checking how many comparisons were performed by each strategy and their combination, which usually achieves better results. For each experiment, we measured the number of
1800 1600
120 100 80 60
1400
1000 800 600 400
20
200 1x10⁵ 2x10⁵ Number of objects
0 0x100
3x10⁵
(a) Government Auctions
Execution time (s)
2500
350
Atalaia RBRP Both Strategies Linear NlogN
300
2000 1500 1000 500 0 0x100
4x10⁵ 6x10⁵ Number of objects
200 150 100 50
1x10⁶
2x10⁶ 3x10⁶ Number of objects
4x10⁶
0 0x100
5x10⁶
2x10⁵ 4x10⁵ Number of objects
250
8x10⁵
1x10⁶
300
Atalaia RBRP Both Strategies Linear NlogN
(d) Uniform30D
Atalaia RBRP Both Strategies Linear NlogN
250
200 150 100
0 0x100
6x10⁵
(c) Forest Covertype
200 150 100 50
50 2x10⁵
250
(b) KddCup1999
Execution time (s)
3000
Atalaia RBRP Both Strategies Linear NlogN
300
1200
40
0 0x100
350
Atalaia RBRP Both Strategies Linear NlogN Execution time (s)
Execution time (s)
140
2000
Atalaia RBRP Both Strategies Linear NlogN
Execution time (s)
160
Execution time (s)
180
1x10⁵
2x10⁵ 3x10⁵ Number of objects
4x10⁵
5x10⁵
(e) ClusteredData
0 0x100
1x10⁵
2x10⁵ 3x10⁵ 4x10⁵ Number of objects
5x10⁵
6x10⁵
(f) ClusteredData with noise
Figure 2: Scalability on various datasets (a) Number of comparisons of objects from the same partition
Database Government Auctions KddCup1999 Forest Covertype Uniform30D ClusteredData ClusteredData with noise
Ordered search for outliers 14,027,912 34,880,833 412,905,053 1,492,562,707 69,427,571 6,962,740
Ordered search of neighbors 54,642,345 65,768,726 476,759,997 1,639,882,013 102,531,981 16,165,850
Both strategies 11,502,946 37,160,103 428,592,865 1,485,527,372 62,681,636 8,166,770
(b) Number of comparisons of objects from different partitions
Database Government Auctions KddCup1999 Forest Covertype Uniform30D ClusteredData ClusteredData with noise
Ordered search for objects 33,878,547 1,099,113,651 375,948,763 5,667,395,411 151,595,737 84,780,381
Ordered search of neighbors 125,610,494 2,060,150,074 252,897,902 1,844,446,248 213,279,421 162,628,523
Both strategies 35,981,511 1,021,094,997 221,442,234 1,802,557,572 152,695,726 61,301,442
Table 4: Number of object comparisons in second phase (90% confidence) comparisons between objects from the same partition or not. Table 4 shows the average number of comparisons for each strategy and dataset. Notice that the number of comparisons should be proportional to the execution time of Atalaia’s second phase (search for outliers). We start by checking which strategy performed less
comparisons between objects within the same partition. Most of the comparisons pruned in the combined strategy were also inherent to our strategy, showing that the rankordered search for outliers actually avoids unnecessary comparisons. For comparisons between objects from different partitions, we expected RBRP to be as efficient as the use of
both strategies, but it did not happen, because the faster determination of the pruning threshold provided by our strategy also reduced the number of comparisons of objects from different partitions. More specifically, if we check the numbers for Forest Covertype and Uniform30D, we understand why Atalaia did not perform well compared to RBRP, which executed significant less comparisons. For these databases, the number of objects discarded while comparing within the same partition is similar for both RBRP and Atalaia, but as we do not rank the neighbors, the processing of comparisons between objects from different partitions demand a larger number of comparisons. On the other hand, we may observe that Atalaia provided results as good as both strategies for Government Auctions and ClusteredData, showing that once our rank strategy (RSO) is employed, RSN could not effectively improve the ANNS pruning and the performance of the algorithm. We may also compare the performance of Atalaia to both ORCA [4] and Jermaine’s [19] proposals, since both evaluated their techniques using the Forest Covertype database. We performed ten experiments using ORCA, which executed in average more than 3.7 billion comparisons. The authors reported their experiments presenting the speedup on the number of comparisons [19], using this speedup reported and based our ORCA measurements, we can estimate that Jermaine’s approach would perform up to 865 million comparisons(Jermaine’s does not return the exact set of outliers as ORCA). In contrast, Atalaia performed 789 million comparisons, and the algorithm combining RSO and RSN performed just 650 million comparisons, a speedup of almost 6 compared to ORCA. Although Forest Covertype is the database where we achieved the worst results, we were able to outperform other approaches showing the effectiveness of Atalaia. 5 Conclusions and Future Work In this work, we propose and evaluate two strategies for improving the efficiency of distance-based outlier mining algorithms: (1) exploiting the features of clustering-generated partitions to estimate the outlierability scores, and (2) examining first objects associated with higher outlierability factor improves the performance of distance-based algorithms. We validated these strategies by applying simple partition ranking heuristics to rank-ordered search for outliers in various datasets. Our results demonstrated the effectiveness of these heuristics as an optimization of the simple pruning rule (ANNS) already applied by other algorithms [4], [8] and [16] and the resulting performance improvement. Futher, we demonstrated that our algorithm approach consistently outperforms state of the art RBRP on severals datasets and obtains performance gains of up to 73%, by reducing the number of distance calculations between objects. As future work, we are analyzing the impact of clus-
ters quality on the effectiveness of RSO. Moreover, we are performing a case study and identifying outliers in an Government Auction database, where these outliers may be associated with incorrect, inconsistent information or even illegal and fraud transactions. Also, we are studying the development of visualization techniques that will make easier the analysis of the outliers. Another direction is the development of an out-of-core, distributed algorithm that enables us to mine even larger datasets. This algorithm may exploit the improved pruning and good selection of outlier candidates to demand much less data in main memory than other approaches without the need of parameters specified by the user. Acknowledgements This work was partially supported by CNPq, CAPES, FINEP and FAPEMIG. References [1] F. A NGIULLI AND F. FASSETTI, Very efficient mining of distance-based outliers, in CIKM, 2007, pp. 791–800. [2] F. A NGIULLI AND C. P IZZUTI, Fast outlier detection in high dimensional spaces, in PKDD ’02: Proc. of the 6th European Conf. on Principles of Data Mining and Knowledge Discovery, London, UK, 2002, Springer-Verlag, pp. 15–26. [3] S. D. BAY, D. K IBLER , M. J. PAZZANI , AND P. S MYTH, The uci kdd archive of large data sets for data mining research and experimentation, SIGKDD Explor. Newsl., 2 (2000), pp. 81–85. [4] S. D. BAY AND M. S CHWABACHER, Mining distance-based outliers in near linear time with randomization and a simple pruning rule, in 9th ACM SIGKDD Int. Conf. on Knowledge Discovery on Data Mining, 2003. [5] J. L. B ENTLEY, Multidimensional binary search trees used for associative searching, Commun. ACM, 18 (1975), pp. 509–517. [6] M. M. B REUNIG , H.-P. K RIEGEL , R. T. N G , AND J. S ANDER, Lof: Identifying density-based local outliers, in Proc. of the 2000 ACM SIGMOD Int. Conf. on Management of Data, May 16-18, 2000, Dallas, Texas, USA, W. Chen, J. F. Naughton, and P. A. Bernstein, eds., ACM, 2000, pp. 93–104. [7] M. E STER , J. K RIEGEL , H. P. AND S ANDER , AND X. X U, A density-based algorithm for discovering clusters in large spatial fatabases with noise, in In Proc. 2nd Int. Conf. on Knowledge Discovery and Data Mining, AAAI Press, 1996. [8] A. G HOTING , S. PARTHASARATHY, AND M. E. OTEY, Fast mining of distance-based outliers in high-dimensional datasets, Data Min. Knowl. Discov., 16 (2008), pp. 349–364. [9] S. G UHA , R. R ASTOGI , AND K. S HIM, Cure: an efficient clustering algorithm for large databases, in SIGMOD ’98: ACM SIGMOD Int. Conf. on Management of data, New York, NY, USA, 1998, ACM, pp. 73–84. [10] J. A. H ARTIGAN AND M. A. W ONG, A K-means clustering algorithm, Applied Statistics, 28 (1979), pp. 100–108.
[11] Z. H UANG, Extensions to the k-means algorithm for clustering large data sets with categorical values, Data Min. Knowl. Discov., 2 (1998), pp. 283–304. [12] E. M. K NORR AND R. T. N G, Finding intensional knowledge of distance-based outliers, in VLDB ’99: 25th Int. Conf. on Very Large Data Bases, San Francisco, CA, USA, 1999, Morgan Kaufmann Publishers Inc., pp. 211–222. [13] R. T. N G AND J. H AN, Efficient and effective clustering methods for spatial data mining, in 20th Int. Conf. on Very Large Data Bases, 1994, Santiago, Chile, Morgan Kaufmann Publishers, 1994, pp. 144–155. [14] K. O RD, Outliers in statistical data : V. barnett and t. lewis, 1994, 3rd edition, (john wiley & sons, chichester), isbn 0-47193094, Int. Journal of Forecasting, 12 (1996), pp. 175–176. [15] S. PAPADIMITRIOU , H. K ITAGAWA , P. G IBBONS , AND C. FALOUTSOS, Loci: Fast outlier detection using the local correlation integral, 2003. [16] S. R AMASWAMY, R. R ASTOGI , AND K. S HIM, Efficient algorithms for mining outliers from large data sets, in SIGMOD ’00: Proc. ACM SIGMOD Int. Conf. on Management of data, New York, NY, USA, 2000, ACM Press, pp. 427–438. [17] N. ROUSSOPOULOS , S. K ELLEY, AND F. V INCENT , Nearest neighbor queries, in SIGMOD ’95: ACM SIGMOD Int. Conf. on Management of data, New York, NY, USA, 1995, ACM, pp. 71–79. [18] Y. TAO , X. X IAO , AND S. Z HOU, Mining distance-based outliers from large databases in any metric space, in 12th ACM SIGKDD Int. Conf. on Knowledge Discovery on Data Mining, 2006. [19] M. W U AND C. J ERMAINE , A bayesian method for guessing the extreme values in a data set?, in VLDB ’07: Proceedings of the 33rd international conference on Very large data bases, VLDB Endowment, 2007, pp. 471–482. [20] D. YANKOV, E. K EOGH , AND U. R EBBAPRAGADA, Disk aware discord discovery: Finding unusual time series in terabyte sized datasets, Data Mining, IEEE International Conference on, 0 (2007), pp. 381–390. [21] J. Y IN , Z.-F. TAN , J.-T. R EN , AND Y.-Q. C HEN, An efficient clustering algorithm for mixed type attributes in large dataset, Machine Learning and Cybernetics, 2005. Proceedings of 2005 International Conference on, 3 (18-21 Aug. 2005), pp. 1611–1614 Vol. 3. [22] T. Z HANG , R. R AMAKRISHNAN , AND M. L IVNY, Birch: an efficient data clustering method for very large databases, SIGMOD Rec., 25 (1996), pp. 103–114.