2nd International Symposium on Big Data and Cloud Computing (ISBCCÐ15) ... Outliers has been studied in a variety of domains including Big Data, High ...
Available online at www.sciencedirect.com
ScienceDirect Procedia Computer Science 50 (2015) 209 – 215
�QG�,QWHUQDWLRQDO�6\PSRVLXP�RQ�%LJ�'DWD�DQG�&ORXG�&RPSXWLQJ��,6%&&¶�� Cluster Based Outlier Detection Algorithm For Healthcare Data Christy.Aa, MeeraGandhi.Gb, S. Vaithyasubramanianc a
Sathyabama University , Jeppiaar nagar, Rajiv Gandhi Salai, Chennai -119, India Sathyabama University , Jeppiaar nagar, Rajiv Gandhi Salai, Chennai -119, India Sathyabama University , Jeppiaar nagar, Rajiv Gandhi Salai, Chennai -119, India
b c
ABSTRACT Outliers has been studied in a variety of domains including Big Data, High dimensional data, Uncertain data, Time Series data, Biological data, etc. In majority of the sample datasets available in the repository, atleast 10% of the data may be erroneous, missing or not available. In this paper, we utilize the concept of data preprocessing for outlier reduction. We propose two algorithms namely Distance-Based outlier detection and Cluster-Based outlier algorithm for detecting and removing outliers using a outlier score. By cleaning the dataset and clustering based on similarity, we can remove outliers on the key attribute subset rather than on the full dimensional attributes of dataset. Experiments were conducted using 3 built-in Health care dataset available in R package and the results show that the cluster-based outlier detection algorithm providing better accuracy than distance based outlier detection algorithm. © © 2015 2015 The The Authors. Authors.Published Publishedby byElsevier ElsevierB.V. B.V.This is an open access article under the CC BY-NC-ND license (http://creativecommons.org/licenses/by-nc-nd/4.0/). Peer-review under responsibility of scientific committee of 2nd International Symposium on Big Data and Cloud Computing Peer-review under responsibility of scientific committee of 2nd International Symposium on Big Data and Cloud Computing �,6%&&¶�� � (ISBCC’15) Keywords:
Cluster-Based; Outlier Detection; Outlier Score;F-Measure; Likelihood Ratio; etc.
1.0 INTRODUCTION Health FDUH� LQGXVWU\� LV� ODJJLQJ� EHKLQG� RWKHU� LQGXVWULHV� LQ� WKH� XVH� RI� ELJ� GDWD� EHFDXVH� SUDFWLWLRQHU¶V� ZDQWHG� WR� function independently rather than relying on protocols based on big data . Outlier is defined as an observation that is inconsistent with the remainder of the set of data. Observations having integrated squared error greater than a threshold are also termed as outliers. Outlier detection has been used in variety of applications in real life ranging from identifying crime detections, fraudulent transactions, network intrusion, stock market, medical data analysis,
1877-0509 © 2015 The Authors. Published by Elsevier B.V. This is an open access article under the CC BY-NC-ND license (http://creativecommons.org/licenses/by-nc-nd/4.0/). Peer-review under responsibility of scientific committee of 2nd International Symposium on Big Data and Cloud Computing (ISBCC’15) doi:10.1016/j.procs.2015.04.058
210
A. Christy et al. / Procedia Computer Science 50 (2015) 209 – 215
etc. Outlier detection is also termed as anomaly detection, event detection, novelty detection, deviant discovery, change point detection, intrusion detection, fault detection or misuse detection. The types of outliers can be classified into 3 various classes namely: x Point outliers which deals with multidimensional data types x Contextual outliers based on the dependency-oriented data types such as discrete sequences, time-series, data and graphs. Every instance to a context is defined using the attributes such as Contextual attributes and Behavioural attributes. x Collective outliers states that the individual data instance is not an outlier whereas a collection of related data may form an outlier A vast number of unsupervised, semi supervised and supervised algorithms are found in the literature for outlier detection. These algorithms further can be classified to classification-based, clustering-based, nearest neighbourbased, density based, information theory based, spectral decomposition based, visualization based, depth based and signal processing based techniques. Outlier detection can be done using uni variate as well as multivariate data in terms of categorical as well as continuous attributes. By univariate data, description such as shape, center, spread amd relative position can be found. Using Bivariate data, correlation and regression using prediction can be carried out, whereas using multivariate data, multiple regression can be done. Simple statistical estimates like mean and standard deviation can be affected by spread of the data that are lies away from the middle of the distribution. Previous studies have shown that statistical methods like gaussion and poisson distributions are time consuming in detecting outliers in large dataset. 2.0 RELATED WORK According to Manish Gupta et al (2014) Outlier detection is closely related to change point and event detection. Outliers can be detected by prediction or forecasting. Based on statistics literature, Parametric models such as autoregressive moving average (ARMA), autoregressive integrated moving average (ARIMA), vector autoregression (VARMA), CUmulative SUM Statistics (CUSUM), exponentially weighted moving average, Single-layer linear network predictor, Regression models, can be used for detecting outliers[1]. Most of the distribution-based approaches use KNN approaches for detecting outliers. This process is computationally intensive when dealing with large dataset to update mean value. A global outlier factor and a local outlier factor combined with KNN method can make the task efficient [2]. By extracting reliable negative examples from positive unlabelled data, entropy-based outlier detection method can be used to detect top N outliers [3]. The issues concerning density-based approaches can be solved using instability factor introduced with the center of gravity concept [4] and kd-tree indexing approximated with kNN approaches [5]. Outliers can be approximated by mining key attributes using rough sets [6]. While classical outlier approaches are applied in data stream, the possibility of misclassification can occur. By comparing the mean value of each cluster with the identified outliers, misclassification accuracy can be improved at low computational cost [7][10]. Ana Arribas-Gil And Juan Romo (2013) has proposed a shape outlier detection based on the relation between the band depth and the epigraph index. The points which lie below the parabola and the points which are closer to the parabola form a curve with typical shape, whereas the most distant ones form the outliers. The boxplot rule can be used for outlier detection on the vertical distances to the parabola[12]. Outliers are detected by three aspects : By performing construction, analysis of initial data set and analysis of a model. By limiting permissible operators and selecting one operator over another based on algorithmic data, concept or domain knowledge biases Overfitting which requires removal of conjuncts, variable, etc [12] Outliers using distance based approaches fetches the top r% of the data based on similarity using a distance measure. In cluster based approach, the cluster with minimum objects is considered as outliers. In a density based approach, the region with sparse data will be considered as outlier [14][16].
A. Christy et al. / Procedia Computer Science 50 (2015) 209 – 215
211
The complexity of the Outliers are evaluated mathematically and noted as NP-hard [15]. Outliers can be detected using Statistical methods such as Distribution-based (Based on the probability distribution in which objects having lower probability are considered as outliers) and Proximity-based approaches ( distance-based, clustering-based or density-based, which detects how an object is distinct from the remaining objects) [8][9] [14]. Amina Dik et al have proposed statistical based model using distance and density approaches checking its proximity. From the literature survey, it is evident that cluster-based algorithms perform best for outlier detection. We propose two algorithms namely, distance-based outlier detection and cluster-based outlier detection algorithm by maintaining a outlier score sorted in ascending order, 3.0 SYSTEM ARCHITECTURE In Healthcare sector, data is growing and processed in an unprecedented rate than health care sectors can consume it. Data for medical profiling is often found in multiple heterogeneous sources like Electronic Health Records, Lab and Imaging Systems, Physician notes, Accounts, etc. Preprocessing the data and making the data readily available for predictive analytics is one of the important challenges of the Health Care Industry. This paper focuses on proposing a framework to enhance data cleaning process for efficient patient care and disease assessment constraints. Thesystem architecture adopted for detecting outliers in Patient Monitoring System is classified into 3 phases namely Initialization Phase, Training Phase and Testing phase as depicted in Fig. 1. At the initial stage, the medical history of patients along with their personal details and medical test results are collected. The dataset is cleaned for removing the missing values and inconsistencies. The attributes relevant to the DQDO\VLV�DUH�REWDLQHG�XVLQJ�FRUUHODWLRQ�DQDO\VLV��7KH�SK\VLFLDQ¶V� knowledge is applied in the learning phase and a model is developed highlighting the outliers. The model is tested with built-in dataset and validity using metrics FMeasure and Likelihood ratio is found.
/E/d/�>/�d/KE�W,�^�� Machine Learning � Check � relevancy Preprocessing Medical � Rule-Based and history of � statistics-based patients consideration by � medical knowldege ���������������������������������������������������������������������������������������������������������������������dZ�/E/E'�W,�^�� �������������������������������������������������������������������������������������������������������d�^d/E'�W,�^�� � Medical � history of new patients
Feature Selection
Determining validity of the Rules generated
Model evaluation
3DWLHQW¶V���3K\VLFLDQV�DQG�7KHUDSHXWLFV Fig 1 System Architecture for Health Care System
212
A. Christy et al. / Procedia Computer Science 50 (2015) 209 – 215
3.1 PREPROCESSING TECHNIQUES Data Preprocessing addresses a variety of data quality problems focussing on outliers and noise. The main purpose of removing outliers is remove data objects that are irrelevant or only weakly relevant to the underlying underlying data analysis. The main focus of this stage is to remove objects that hinder data analysis. Cluster analysis is analogous to outlier detection as both techniques deals with the elimination of weakly relevant or irrelevant objects. It is a well known fact that the presence of outliers can misrepresent various kinds of clustering such as K-Means, Hierarchical and Agglomerative clustering. Clustering algorithms, in general deal with identifying which objects are potential outliers during the process of clustering. These outliers are eliminated in the final clustering process. 3.1.1 DISTANCE-BASED OUTLIER REMOVAL In a given dataset, the volume of persisting outlier is very small. Failing to remove this small chunk can end in serious disaster. Outlier detection techniques assign each object an outlier score that delegates the degree to which it is an outlier. Such techniques can remove any specified percentage of outliers. i.e., the objects are sorted according to their outlier score and the objects falling below a particular score value will be eliminated [17]. The algorithm we have adopted for removing distance-based outliers is depicted in Table 1. Table 1 : A distance-based outlier removal algorithm 'DWD���+HDOWKFDUH�GDWDVHW�7��RXWOLHU�IUDFWLRQ�İ���ڧRXWOLHU�VFRUH Result : Set of outlier objects N, set of non-noise objects P IRU���L� ����L����ڦdata ; i++) { T[i].NumWithinDist Æ 0; IRU���M� ����M����ڦdata ; j++) { LI���M��L� � ��(XFOLGHDQ�GLVWDQFH�7>L@��7>M@ ��� �ڧWKHQ T[i].NumWithinDist ++; } } Tsorted = Sort (T, NumWithinDist, ascending); outlier �İ� �ڦdata ; N Å 7VRUWHG�>����ڦdata ]; P Å 7VRUWHG�>ڦoutlier + ����ڦdata ]; return N, P;
The algorithm uses Euclidean distance measure for finding similarity between objects. An object in a datset forms a distance-EDVHG�RXWOLHU�LI�DWOHDVW�D�IUDFWLRQ�RI�WKH�REMHFW�'�DUH�DW�D�GLVWDQFH�JUHDWHU�WKDQ�WKH�VFRUH�RU�WKUHVKROG�)���ڧRU� HDFK� REMHFW� LQ� WKH� GDWDVHW� �� WKH� QXPEHU� RI� REMHFWV� WKDW� OLH� ZLWKLQ� D� VFRUH� �ڧLV� FRQVLGHUHG� DV� YDOLG�� $FFRUGLQJ� WR� distance cULWHULD�� RXWOLHUV� FRQVLVW� RI� REMHFWV� WKDW� OLH� DERYH� WKH� VFRUH� YDOXH� � ��ڧ+RZHYHU�� DOO� REMHFWV� DUH� VRUWHG� DFFRUGLQJ� WR� DVFHQGLQJ� RUGHU� ZLWK� UHVSHFW� WR� WKH� QXPEHU� RI� RXWOLHUV� WKH\� KDYH�� 7KH� ILUVW� İ� �� DUH� GHFODUHG� WR� EH� outliers and they are removed from the dataset.
3.1.2 CLUSTER-BASED OUTLIER REMOVAL Clustering algorithms can detect outliers as a by-product of the clustering process [17]. The Clustering algorithms works on the principle that objects that are farway from the centroid are treated as outliers. Table 2 shows a ClusterBased Outlier detection method. In the algorithm proposed, data is clustered using a K-Means algorithm and the (XFOLGHDQ�GLVWDQFH�RI�HDFK�REMHFW�IURP�LWV�FRUUHVSRQGLQJ�FOXVWHU�FHQWURLG�LV�UHFRUGHG��7KH�WRS����REMHFWV�REWDLQHG after sorting these objects with regard to the distance forms the outlier objects in the data.
A. Christy et al. / Procedia Computer Science 50 (2015) 209 – 215
213
Table 2 : A cluster-based outlier removal algorithm 'DWD���+HDOWKFDUH�GDWDVHW�7��RXWOLHU�IUDFWLRQ�İ��&OXVWHU�ODEHO�VHW�&�IRU�7 Result : Set of outlier objects N, set of non-noise objects P IRU���L� ����L����num_clusters ; i++) { Cluster.center[i][1..ndata] Å mean (T[1.. ڦdata], i); } IRU���M� ����M����ڦdata ; j++) { T[j].ClusterCenterSimilarity Å Euclidean distance (T[j], cluster.center [T[j]]); } Tsorted = Sort (T, ClusterCenterSimilarity, ascending); outlier �İ� �ڦdata ; N Å 7VRUWHG�>����ڦdata ]; P Å 7VRUWHG�>ڦoutlier + ����ڦdata ]; return N, P; The subject of concern in cluster-based algorithms lies in defining the number of clusters. If there is only one cluster, then the cluster-based approach becomes very similar to the distance-based approach. If every object is a separate cluster, then the cluster-based approach, works independently in choosing the objects as outliers. 3.2 PREPRCESSING VALIDATION METRICS To evaluate the quality of clusters produced by the different clustering techniques, two commonly used measures are used which evaluates the quality of clusters namely F-Score and Likelihood ratio In statistical analysis of binary classification, the F score (F-measure) is a measure of a test's accuracy. The F-Score combines the precision and Recall concepts from information retrieval. Each cluster is treated as if it were the result of a query. It considers both the precision p and the recall r of the test to compute the score: p is the number of correct results divided by the number of all returned results and r is the number of correct results divided by the number of correct results that should have been returned which is depicted in equation 1.
� ܨെ ܵܿ �݁ݎൌ
�������ଶ�כோாכோாூௌூைே ோாூௌூைேାோா
(1)
In evidence-based medicine, likelihood ratios are used for assessing the value of performing a diagnostic test. They use the sensitivity and specificity of the test to determine whether a test result usefully changes the probability that a condition (such as a disease state) exists. The positive likelihood ratio (LR+) and negative likelihood (LR-) as shown in is calculated as shown in equation (2) and (3). ܴܮ�ൌ � ܴܮ�ൌ �
ௌ௦௧௩௧௬
ଵିௌ௧௬
ଵି�ௌ௦௧௩௧௬ ௌ௧௬
(2) (3)
in which Sensitivity (also called the true positive rate, or the recall rate) measures the proportion of actual positives which are correctly identified as such (e.g., the percentage of sick people who are correctly identified as having the condition) and Specificity (also called as the true negative rate) measures the proportion of negatives which are correctly identified as such (e.g., the percentage of healthy people who are correctly identified as not having the condition).
214
A. Christy et al. / Procedia Computer Science 50 (2015) 209 – 215
4.0 EXPERIMENTAL RESULTS For our experiments, we have used health care dataset from R package. The first data set is esoph which can deals with smoking, alcohol and (O)esophageal Cancer, the second dataset is diabetic dataset and the third being KosteckiDillon which covers attributes relating to the treatment of Migraine Headaches. The experimental parameters for Data Analysis is depicted in Table 3 Dataset
Table 3 : Parameters used Similarity Score for No. of clusters Distance
Fraction of median support used
Esoph (dataset 1)
0.15
3
0.30
Diabetes (dataset 2)
0.15
3
0.25
KosteckiDillon (dataset 3)
0.10
3
0.20
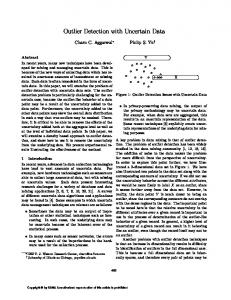
A model is fitted using the existing data points and the figures 2, 3 and 4 shows that if we randomly remove data objects, the values of the metrics F-Score and Likelihood ratio remains unchanged. The percentage of noise objects in all three datasets is removed by the distance-based outlier and cluster-based outlier detection algorithms. The clustering performance improves as more and more outliers or weakly relevant objects are removed. It is evident that the number of outliers increases with the number of objects. Experimental set up shows that clusterbased outlier detection method performs better than distance-based outlier detection method.
Fig 2 . Cluster Model using dataset1
Fig 3 . Cluster Model using dataset2
Fig 4 . Cluster Model using dataset3
Irrespective of the dataset, Cluster-Based outlier detection algorithm tend tobe the best technique for detecting the RXWOLHUV���7KH�QXPEHUV�RI�FOXVWHUV�JHQHUDWHG�LV�WKUHH�ZLWK�VLPLODULW\�VFRUH��ڧFKRVHQ�XS�WR������DQG�������)URP�WKH� figures 2,3 and 4, it is found that all objects are fitted along its mean value by removing the outliers. 5.0 CONCLUSION
The goal of the algorithms presented in the paper is to improve the quality of data processing and capture the underlying patterns in the data by reducing the effect of outliers at the pre processing stage. This outlier may be due to the unavailability or distortions in the data collection stage that consists of irrelevant or weakly relevant data objects. From the algorithms, it is shown that by choosing a valid outlier score, the overall performance of the algorithm can be improved. Analysis conducted using the three built-in health care datasets esoph , diabetes and KosteckiDillon of R, shows the cluster-based outlier detection algorithm producing better accuracy than distancebased outlier detection method.
A. Christy et al. / Procedia Computer Science 50 (2015) 209 – 215
215
6.0 REFERENCES [1] Manish Gupta, Jing Gao, &KDUX�&��$JJDUZDO�DQG�-LDZHL�+DQ������ ��³2XWOLHU�'HWHFWLRQ�IRU�7HPSRUDO�'DWD��$� 6XUYH\´��,(((�75$16$&7,216�21�.12:/('*(�$1'�'$7$�(1*,1((5,1*��92/������12�����3S�������± 2267 [2] Xiaochun Wanga, Xia Li Wangb, YongqLDQJ�0DD��DQG�'��0LWFKHOO�:LONHVF������ ���³$�IDVW�067-inspiredp. kNN-EDVHG�RXWOLHU�GHWHFWLRQ�PHWKRG´��Information Systems, Vol: 48, Pp. 89±112. [3] Armin Daneshpazhouh , Ashkan Sami ����� ��³(QWURS\-based outlier detection using semi-supervised approach ZLWK�IHZ�SRVLWLYH�H[DPSOHV´��Pattern Recognition Letters, Vol. 49, Pp. 77-84 [4] Jihyun Ha , Seulgi Seok and Jong-6HRN� /HH� ����� �� ³´5REXVW� RXWOLHU� GHWHFWLRQ� XVLQJ� WKH� LQVWDELOLW\� IDFWRU´�� Knowledge-Based Systems,Pp. 15±23 [5] Seung Kim , Nam Wook Cho, Bokyoung Kang and Suk-+R�.DQJ������ ��³)DVW�RXWOLHU�GHWHFWLRQ�IRU�YHU\�ODUJH� ORJ�GDWD´��([pert Systems with Applications, Vol : 38, No : 8, Pp. 9587±9596 >�@�3HQJ��@���%LQ�:DQJ��*DQJ�;LDR���+DR���@� (ODKL�� 0�� �� .XQ� /L�� � 1LVDU�� :�� �� � ;LQMLH� /Y� DQG� � +RQJDQ� :DQJ� ����� �� ³(IILFLHQW� &OXVWHULQJ-Based Outlier 'HWHFWLRQ�$OJRULWKP�IRU�'\QDPLF�'DWD�6WUHDP´��)LIWK�,QWHUQDWLRQDO�&RQIHUHQFH�RQ�)X]]\�6\VWHPV�DQG�.QRZOHGJH� Discovery, Pp. 298 - 304 >��@�$KPHG��0���1DVHU��$������ ��³$�QRYHO�DSSURDFK�IRU�RXWOLHU�GHWHFWLRQ�DQG�FOXVWHULQJ�LPSURYHPHQW´���WK�,(((� Conference on Industrial electronics and applications, Pp. 577 ± 582 [12] Ana Arribas-*LO�$QG�-XDQ�5RPR������ ��³6KDSH�2XWOLHU�Detection and Visualization for Functional Data: the 2XWOLHUJUDP´��DU;LY��6HSWHPEHU���3S���-34 >��@�$OEUHFKW�=LPPHUPDQQ������ ��³$�IHDWXUH�FRQVWUXFWLRQ�IUDPHZRUN�EDVHG�RQ�RXWOLHU�GHWHFWLRQ�DQG�GLVFULPLQDWLYH� SDWWHUQ�PLQLQJ´��DU;LY��3S���- 11. [14] Saptarsi *RVZDPL��6DPLUDQ�*KRVK�DQG�$PODQ�&KDNUDEDUWL������ ��³2XWOLHU�'HWHFWLRQ�7HFKQLTXHV�IRU�64/�DQG� (7/�7XQLQJ´��,QWHUQDWLRQDO�-RXUQDO�RI�&RPSXWHU�$SSOLFDWLRQV��9RO�������1R�����3S���-23 [15] Fabrizio Angiulli, Rachel Ben-Eliyahu Zohary, Luigi Palopoli (2013)��³2XWOLHU�GHWHFWLRQ�LQ�GHIDXOW�ORJLFV��WKH� tractability/intractability frontier, arXiv.org >��@��$PLQD�'LN��.KDOLG�-HEDUL��$EGHOD]L]�%RXURXPL�DQG�$]L]�(WWRXKDPL�����³6LPLODULW\- based approach for outlier GHWHFWLRQ´ [17] Hui Xiong, Michael Stein bach and 9LSLQ� .XPDU� ����� �� ³(QKDQFLQJ� 'DWD� $QDO\VLV� ZLWK� 1RLVH� 5HPRYDO´�� IEEE Transactions on Knowledge and Data Engineering, Vol. 18, No. 3, Pp. 304-319