International Journal of Machine Learning and Computing, Vol. 1, No. 4, October 2011
An Efficient Data Aggregation Scheme Leveraging Time Series Prediction in Wireless Sensor Networks Guorui Li, and Ying Wang The design of efficient data aggregation scheme is an inherently challenging task. There have been intense researches in the recent past on data aggregation in wireless sensor networks. Typically, the whole network is partitioned into hierarchical structure which consists of sink node, aggregators and ordinary sensors. The aggregator uses specific functions, such as average, min or max, to aggregate incoming readings, and only the aggregated results are forwarded to the sink. Therefore, communication overhead can be reduced and packet collision can be avoided by decreasing the amount of transmitted messages. A comprehensive survey on data aggregation schemes of wireless sensor networks is presented in [3]. And we will briefly review some representative data aggregation schemes in section II. We proposed a temporal correlation based data aggregation scheme in this paper which utilizes ARIMA (Auto Regressive Integrated Moving Average) model to predict the data of next several periods at both ordinary sensors and aggregators based on the same amount of recent sensed values. The sensor node will not transmit the sensed value to the aggregator when the prediction error between the sensed value and predicted value is within the predefined error threshold. In this case, the aggregator will regard the predicted data as the sensed value in current sensing period. When the prediction error is beyond the predefined error threshold, the sensor node will transmit the sensed value to the aggregator in order to replace the incorrect prediction value. We show through experiments that our proposed scheme can provide considerable aggregation ratio while maintaining a low prediction error rate. This paper is organized as follows. In the next section, we review some related works. In Section III, we present our temporal correlation based data aggregation scheme. In Section IV, we describe our experiment settings and evaluation results. Finally, we draw our conclusion of this paper in Section V.
Abstract—In wireless sensor networks, the data periodically sensed by sensor nodes are usually of high temporal correlation. Therefore, prediction based data aggregation scheme can be designed to reduce the amount of data transmission and save sensor nodes’ limited energy and bandwidth. We proposed a temporal correlation based data aggregation scheme in this paper which utilizes time series model to predict the data of next several periods at both ordinary sensors and aggregators based on the same amount of recent sensed values. We show through experiments using real sensor data that our proposed scheme can provide considerable aggregation ratio while maintaining a low prediction error rate. Index Terms—Wireless sensor networks, data aggregation, data correlation, ARIMA model.
I. INTRODUCTION Recent advances in Micro Electro Mechanical Systems (MEMS) and wireless communication technology have made it feasible to mass product small sized wireless sensor nodes with sensing, computation, and communication capabilities. These sensor nodes could be scattered randomly in harsh environments such as battlefields or deterministically placed at specified locations to collect information from the environment. They could coordinate among themselves to form a communication network in an ad hoc multi-hop way. The typical application fields of wireless sensor networks include industrial process control, security and surveillance, environmental sensing, and structural health monitoring, etc. [1]. In wireless sensor networks, the communication cost is often several orders of magnitude higher than that of computation. In order to save the precious battery energy of sensor nodes, data aggregation technique is often considered as an effective way. The inherent redundancy in the raw data collected from the sensor nodes can often be eliminated by in-network data aggregation. Moreover, such operations are also useful for extracting application specific information from the raw data. Therefore, it is critical for the network to support data aggregation scheme in order to conserve energy for a longer network lifetime [2].
II. RELATED WORKS There have been extensive researches on data aggregation schemes in wireless sensor networks. Some researches focus on how to aggregate data from different nodes, the others focus on how to construct and maintain a structure to facilitate data aggregation [2]. Heinzelman et al. proposed LEACH (Low Energy Adaptive Clustering Hierarchy) to cluster sensor nodes and let the cluster head to aggregate data in [4]. The cluster head then transmits the aggregated results directly to the sink. Lindsey et al. proposed PEGASIS (Power Efficient Data
Manuscript received September 5, 2011, revised September 6, 2011. This work was supported in part by the Fundamental Research Funds for the Central Universities of China under Grant N100323001 and the Scientific Research Foundation of the Higher Education Institutions of Hebei Province, China under Grant Z2010215. Guorui Li is with the Electronic Information Department, Northeastern University at Qinhuangdao, Qinhuangdao, Hebei 066004 China (e-mail:
[email protected]). Ying Wang is with the Department of Information Engineering, Qinhuangdao Institute of Technology, Qinhuangdao, Hebei 066100 China (e-mail:
[email protected]).
372
International Journal of Machine Learning and Computing, Vol. 1, No. 4, October 2011
Gathering Protocol for Sensor Information Systems) which organizes all sensors into a chain structure and rotates each node to communicate with the sink [5]. Both LEACH and PEGASIS assume that each node in the network can reach the sink directly in one hop, which limits the size of the network for which they are applicable. Intanagonwiwat et al. proposed GIT (Greedy Incremental Tree) which establishes an energy efficient tree by attaching all sensors greedily onto an energy efficient path and prunes less energy efficient paths [6]. However, it might lead to high communication cost in moving event scenarios for the reason of frequently pruning branches. Zhang et al. proposed DCTC (Dynamic Convoy Tree-based Collaboration) which assumes that the distance to the event is known to each sensor and uses the node near the center of the event as the root to construct and maintain the aggregation tree dynamically in [7]. However, it involves heavy message exchanges which might eliminate the benefit of aggregation in large scale networks. Ding et al. proposed EADAT (Energy Aware Distributed Aggregation Tree) scheme in [8], which is based on energy aware distributed heuristic. It only relies on local knowledge of the network topology and gives higher chances to sensor node with higher residual power to become a non-leaf tree node. Recently, Xu et al. proposed CDA (Cooperative Data Aggregation) scheme which is based on cooperative communication mechanism. The heuristic algorithm MCT for cooperative data aggregation and its distributed implementation DMCT are also proposed in [9]. However, none of the above data aggregation schemes have considered the problem of decreasing the transmitted messages between aggregator and ordinary sensors. That is the focus and contribution of this paper.
Φ p (B )Δd xt = Θq (B )ε t
(1)
B is the backward shift operator, Δ is the backward difference, d is the order of differencing, and Φ p and Θq are polynomials of order p and q, respectively.
Bx y = x y −1
(2)
Δ = 1− B
(3)
ARIMA(p, d, q) model is the product of an auto regressive part AR(p): Φ p = 1 − φ1 B − φ 2 B 2 − L − φ p B p
(4)
an integrating part:
I (d ) = Δ− d
(5)
and a moving average part MA(q): Θq = 1 − θ 1 B − θ 2 B 2 − L − θ q B q
(6)
The parameter Φ and Θ are chosen so that the zeros of both polynomials lie outside the unit circle in order to avoid generating unbounded processes. The construction steps of ARIMA model is shown in Fig. 1. It includes the following five steps [12].
III. TEMPORAL CORRELATION BASED DATA AGGREGATION SCHEME The temporal correlation based data aggregation scheme utilizes ARIMA model to predict the data of next several periods at both ordinary sensors and aggregators based on the same amount of recent sensed values. The ordinary sensors and aggregators work coordinately to reduce the number of messages transmitted within the network. A. The ARIMA Model The ARIMA model, also called Box-Jenkins model, is a widely used forecast model for univariate time series [10]. An ARIMA process has three components: auto-regressive (AR), moving-average (MA), and one-step differencing. The AR component estimates the current sample as a linear weighted sum of previous samples; the MA component captures relationship between prediction errors; and the one-step differencing component captures relationship between adjacent samples. In ARIMA, the AR component captures the temporal correlation in the time series by modeling a future value as a function of a number of past values. The MA component is modeled as a zero-mean, uncorrelated Gaussian random variable (also referred to as white noise) [11]. The ARIMA(p, d, q) model of time series { x1 , x2 , L } is defined as
Fig. 1. The ARIMA model construction steps
Step 1: Determine whether the time series data is stationary. The noise series being analyzed must be stationary. When the variance of the noise series is non-stationary, the data must be transformed using the logarithms or square roots of the original data to make the series stationary. If the series exhibits a trend over time or seasonality, or if some other non-stationary pattern exists, the series is differenced repeatedly until the time series becomes stationary. Step 2: Identify the model. 373
International Journal of Machine Learning and Computing, Vol. 1, No. 4, October 2011
with a wide variety of features such as trend by simply adjusting the parameters of each term.
Candidate ARIMA models are identified once the time series becomes stationary. After obtaining the autocorrelation function (ACF) and partial autocorrelation function (PACF), multiple ARIMA models that closely fit the data can be identified. The k order autocorrelation coefficient of time series {x1, x2, …} is defined as
∑ (x − x )(x = ∑ (x − x ) T
rk
t −k
t
t = k +1
T
− x)
2
B. Data Aggregation Scheme The temporal correlation based data aggregation scheme works as follows: Temporal correlation based data aggregation scheme 1 If node is ordinary sensor node 2 Collect environmental value; 3 If periodical update time is up 4 Historical data [current index] = sensed value; 5 Send sensed value to the aggregator; 6 Else 7 Forecast sensed value using ARIMA model; 8 If |sensed value – forecast value| < error threshold 9 Historical data [current index] = forecast value; 10 Else 11 Historical data [current index] = sensed value; 12 Send sensed value to the aggregator; 13 EndIf 14 EndIf 15 Else //node is aggregator 16 Listen sensed value from sensor; 17 If received sensed value from sensor 18 Historical data [current index] = sensed value; 19 ElseIf periodical data collect time is up 20 Forecast sensed value using ARIMA model; 21 Historical data [current index] = forecast value; 22 EndIf 23 EndIf
(7)
t
t =1
The k order partial autocorrelation coefficient of time series {x1, x2, …} is defined as ⎧ ⎪⎪ ϕ k = ⎨ rk − ⎪ 1− ⎪⎩
k =1
r1
∑ ∑
k −1 j =1
k −1 j =1
ϕ j rk − j
ϕ j rk − j
k >1
(8)
Step 3: Estimate the model parameters. After identifying a possible ARIMA model, analyze the time series and estimate the model parameters. If the PACF of the differenced series displays a sharp cutoff and the lag-1 autocorrelation is positive, then consider adding one or more AR terms to the model. The lag beyond which the PACF cuts off is the indicated number of AR terms. If the ACF of the differenced series displays a sharp cutoff and the lag-1 autocorrelation is negative, then consider adding an MA term to the model. The lag beyond which the ACF cuts off is the indicated number of MA terms. Step 4: Perform diagnosis checking. This step employs a white noise test to check whether the residual series from the model contains additional information that might be of use to a more complex model. In this case, the analysis must be continued by repeating Steps 3 and 4 until an appropriate ARIMA model is found which passes the white noise test. Step 5: Select the most suitable ARIMA model. An ARIMA model with the smallest Akaike information criterion (AIC) and Schwarz Criterion (SC) is selected as the most suitable ARIMA model for analysis. The AIC and SC are computed as AIC = −2l T + 2k T SC = −2l T + (k log T ) T
The ordinary sensor node collects sensed value from environment. If the periodical update time is up, it will save the sensed value into the historical data queue and send the sensed value to the aggregator. Otherwise, it will calculate the forecast value using ARIMA model and compare the sensed value with the forecast value. If the difference between them is less than the predefined error threshold, the sensor will store the forecast value into the historical data queue. Otherwise, it will store the sensed value into the historical data queue and send the sensed value to the aggregator at the same time. The periodical update time is a preset and tunable scheme parameter which is used to periodically collect real sensed value and avoid cumulative error in continuous forecasts. The aggregator listens on the wireless channel to retrieve sensed values from ordinary sensor node and store them into the historical data queue. If the aggregator does not receive any data from sensor node after a predefined periodical data collect time, it means the difference between the sensed value and forecast value is within an acceptable range. Then the aggregator will calculate the forecast value using ARIMA model with historical data. The periodical data collect time should be selected carefully to ensure it is enough to deliver the message from sensor to the aggregator. Meanwhile, reliable message retransmission mechanism should be adopted in the underlying MAC layer to guarantee the sensed value could be delivered to the aggregator even after collusion happens.
(9) (10)
In (9) and (10), l is the log likelihood, T is the number of observations, k is the number of right-hand side regressors, εˆ′εˆ is the sum of squared residuals. l=−
T (1 + log(2π ) + log(εˆ ′εˆ T ) ) 2
(11)
The power of an ARIMA model resides in that it can incorporate all the auto regressive term, the integrated term, and the moving average term together to model time series 374
International Journal of Machine Learning and Computing, Vol. 1, No. 4, October 2011
[14]. Therefore, we can conclude that our ARIMA model is stationary. Fig. 8 shows the average prediction error of temporal correlation based data aggregation scheme when periodical update time is set to 20 minutes, 30 minutes, 1 hour, 2 hours, 3 hours, 4 hours, 6 hours and 8 hours, respectively. The average prediction error is defined as the absolute value of the difference between the sensed value and the forecast value divided by the number of samples. We can conclude that the average prediction error grows with the increase of the periodical update time from Figure 4.
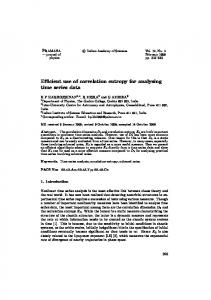
IV. ANALYSIS We use the real sensed data collected from TAO (Tropical Atmosphere Ocean) project to demonstrate the performance of our proposed temporal correlation based data aggregation scheme. The TAO project provides real-time collection of high quality oceanographic and surface meteorological data for monitoring, forecasting, and understanding of climate swings associated with El Niño and La Nina since 1982 [13]. The collected data include sea surface temperature, sea level pressure, salinity, relative humidity and density etc along with timestamp information collected once every 10 minutes. We will only use the sea surface temperature data to evaluate our scheme. The other collected measurement will produce the similar results. Fig. 2 shows a detail deployment of nearly 70 buoys of TAO project.
Fig. 2. Deployment of TAO project (a) periodical update time = 2 hours
Fig. 3 shows the comparison of sensed values and forecast values of the buoy deployed at 8° north latitude 155° west longitude using our proposed temporal correlation based data aggregation scheme with different periodical update time, 2 hours, 3 hours and 6 hours, respectively. We can conclude that the forecast values of our scheme fit the sensed values very well. And the less the periodical update time, the better the forecast values fit the sensed values. The reason behind this property lies in the fact that less periodical update time implies more precise sensed values are utilized by ARIMA model to predict the forecast values. Fig. 4 shows the residuals between the forecast values and sensed values of temporal correlation based data aggregation scheme when periodical update time is set to 3 hours. We can see that most residuals are within ±0.1°C deviation of the sensed values. And the largest residual is no more than ±0.4°C deviation of the sensed values. Fig. 5 shows the inverse roots of the ARIMA characteristic polynomial when periodical update time is set to 3 hours. According to the time series theory, if the estimated ARIMA process is stationary, then all AR roots should lie inside the unit circle. If the estimated ARIMA process is invertible, then all MA roots should lie inside the unit circle. We can see that our ARIMA model is stationary and invertible. Fig. 6 and Fig. 7 show the impulse response and accumulated response with ±standard error when periodical update time is set to 3 hours. An impulse response function traces the response to a one-time shock in the innovation. The accumulated response is the accumulated sum of the impulse responses. It can be interpreted as the response to step impulse where the same shock occurs in every period from the first. If the estimated ARIMA model is stationary, the impulse responses will asymptote to zero, while the accumulated responses will asymptote to its long-run value
(b) periodical update time = 3 hours
(c) periodical update time = 6 hours Fig. 3. Sensed values and forecast values
375
International Journal of Machine Learning and Computing, Vol. 1, No. 4, October 2011
conclude that the aggregation ratio decreases with the increase of periodical update time.
Fig. 4. Residuals
Fig. 8. Prediction error
Fig. 5. Inverse roots of ARIMA polynomial
Fig. 9. Aggregation ratio
V. CONCLUSION This paper has presented a temporal correlation based data aggregation scheme for wireless sensor networks. The aggregator can utilize the ARIMA model to forecast the sensed values of ordinary sensor nodes. The experiment results show that our proposed scheme can provide considerable aggregation ratio while maintaining a low prediction error rate. The future research directions are to design efficient data aggregation schemes using spatial and temporal data correlation characteristics together.
Fig. 6. Impulse response
ACKNOWLEDGMENT
Fig. 7. Accumulated response
We would like to thank the anonymous reviewers for their constructive comments and suggestions on improving the presentation of this work. We also would like to thank the TAO Project Office of NOAA/PMEL for allowing us to use the TAO data.
Fig. 9 shows the aggregation ratio of temporal correlation based data aggregation scheme where the predefined error threshold is set to 0.3°C. The aggregation ratio is defined as the number of transmitted messages divided by that of transmitted and forecast messages. It should be noted that the sensor node must send the sensed value to the aggregator when the prediction error is beyond the predefined error threshold. Therefore, more prediction errors mean more messages should be transmitted to the aggregator. We can
REFERENCES [1]
376
J. Yick, B. Mukherjee, and D. Ghosal, “Wireless sensor network survey,” Computer Networks, vol. 52, pp. 2292-2330, August 2008.
International Journal of Machine Learning and Computing, Vol. 1, No. 4, October 2011 [2]
S. Lee, S. Kim, D. Ko, S. Kim, and S. An, “Prediction based mobile data aggregation in wireless sensor network,” in Proc. 4th International Conference on Advances in Grid and Pervasive Computing, Geneva, Switzerland, 2009, pp. 328-339. [3] R. Rajagopalan, and P. Varshney, “Data-aggregation techniques in sensor networks: a survey,” IEEE Communications Surveys & Tutorials, vol. 8, pp. 48-63, 2006. [4] W. Heinzelman, A. Chandrakasan, and H. Balakrishnan, “An application-specific protocol architecture for wireless microsensor networks,” IEEE Transactions on Wireless Communications, vol.1, pp. 660-670, October 2002. [5] S. Lindsey, and C. Raghavendra, “PEGASIS: power-efficient gathering in sensor information systems”, Proc. of IEEE Aerospace Conference, IEEE press, March 2002, pp. 1125-1130, doi: 1109/ AERO.2002.1035242. [6] C. Intanagonwiwat, D. Estrin, R. Goviindan, and J. Heidemann, “Impact of network density on data aggregation in wireless sensor networks”, in Proc. of 22nd International Conference on Distributed Computing Systems, Vienna, Austria, 2002, pp. 457-458. [7] W. Zhang, and G. Cao, “DCTC: dynamic convoy tree-based collaboration for target tracking in sensor networks,” IEEE Transactions on Wireless Communications, vol. 3, pp. 1689-1701, September 2004. [8] M. Ding, X. Cheng, and G. Xue, “Aggregation tree construction in sensor networks,” in Proc. of IEEE 58th Vehicular Technology Conference, Orlando, USA, 2003, pp. 2168-2172. [9] H. Xu, L. Huang, Y. Zhang, H. Huang, S. Jiang and G. Liu, “Energy-efficient cooperative data aggregation for wireless sensor networks,” Journal of Parallel and Distributed Computing, vol. 70, pp. 953-961, September 2010. [10] G. Box, G. Jenkins and G. Reinsel, Time series analysis: forecasting and control, 4rd ed. New Jersey, USA: John Wiley & Sons, 2008, ch. 3, pp.47-92. [11] M. Li, D. Ganesan, and P. Shenoy, “PRESTO: feedback-driven data management in sensor networks,” IEEE/ACM Transactions on Networking, vol. 17, pp. 1256-1269, August 2009.
[12] G. Li, and Y. Wang, “A prediction based data aggregation scheme in wireless sensor networks,” Advanced Materials Research, vol. 268-270, pp. 517-522, July, 2011. [13] TAO project. Available: http://www.pmel.noaa.gov/tao. [14] EViews Help. Available: http://www.eviews.com.
Guorui Li received the B. Sc. degree in Mathematics from Hebei Normal University, PRC in 2001, the M. E. degree in computer software and theory from Yanshan University, PRC in 2004, and the Ph.D. degree in computer application from Beijing University of Technology, PRC in 2009. He is currently an assistant professor in the Electronic Information Department, Northeastern University at Qinhuangdao. He has published 25 research papers in international journals and conferences. He is a member of CCF and ACM. His research interests include information security, pervasive computing and internet of things. Dr. Li serves as the program committee of several international conferences
(WMCS 2008, WMCS 2009 etc.) and reviewer of some international journals .
Ying Wang received the B.E. degree in computer science from Yanshan University, PRC in 2002, the M. E. degree in computer application from Yanshan University, PRC in 2007. She is currently a lecturer in the Department of Information Engineering, Qinhuangdao Institute of Technology. She has published several research papers in international journals and conferences. Her research interests include information security and wireless sensor networks.
377