Fourth International Conference on Image and Graphics
An Efficient Lossless Compression Algorithm for Well Logging Result Drawings Yong Shi, Liqiang He, Yihong Wen, Bo Li, Zhengzhang Chen Digital Media Laboratory, School of Computer Science and Engineering Beihang University, Beijing, 100083 P. R. China
[email protected] specially designed for such graph in the world. As a result, it becomes necessary for research on efficient lossless compression algorithm particularly for Result Drawings. To study lossless compression algorithm for Result Drawings, we firstly, by the comparison of experimental result, screen out an excellent open source algorithm for lossless compression named LZMA (Lempel-Ziv-Markov chain-Algorithm)[3] in section 1; then, section 2 develops an efficient lossless compression algorithm for Result Drawings based on the analysis of Result Drawings; section 3 demonstrates the performance test and result analysis of this algorithm; we give a summary in the last section.
Abstract Since the data of Well Logging Result Drawings is so large, it is necessary to apply efficient algorithm to compress them. Based on the lossless compression of LZMA (Lempel-Ziv-Markov chain-Algorithm), this paper presents a new compressing algorithm for Well Logging Result Drawings after analyzing Result Drawings in CGM (Computer Graphics Metafile) format. The experiment results indicate that the compression ratio of the proposed new algorithm for the Result Drawings with cgm format is larger than currently popular compression software. The new algorithm is also suitable to compress Result Drawings in any other vector format.
1. Introduction
2. Selection of the Platform for Lossless Compression
In the field of Well Exploring and Logging, Well Logging Result Drawings[1] (short for “Result Drawings in the following) used for geological analysis is developed by computer after gaining data by means of Nuclear Magnetic Resonance(NMR), ultrasonic, etc. with the global extend of Geophysical Prospecting and Petroleum Exploration, the number of wells need to be analyzed are increasing. And the improvement of the detecting accuracy makes the size of Result Drawings files for single well larger and larger, generally to as much as 500M or even more, which brings about many problems for the storage, network transmission and applications of Result Drawings. At present, result drawings are primarily stored in vector format such as cgm[2] and pds. Cgm format is more widely used, because it is an international criterion, has standard application interfaces, and is supported by more software. However, Graphic in vector format draws little attention on the study of its compression, since it is a compressive expression itself, and there is no lossless compression algorithm
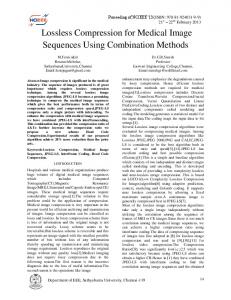
Today popular software for lossless compression contains LZMA, ZZip0.36c[4] ( basically uses Burrows Wheeler Transformation[5], Forward Coding and Arithmetic Coding), WinZip9.0 (basically uses a transformation of LZ77[6] and Static Huffman Coding), WinRAR3.5(uses another transformation of LZ77, without publication of specific algorithm ) ,ShellZip2.3, UltimateZip3.1b, LMEL143A, ALZip5.52 and Gzip1.0, etc. The lossless compressing results of these software on the Result Drawings for some typical Result Drawings (Figure 1.): rock.cgm is “Rock Mechanical Property” data which has low complexity; ref.cgm contains “Reflected Wave” data which is of moderate complexity; ani.cgm is “Anisotropy Analysis” data which also holds moderate complexity; hdil.cgm contains “High Definition Introduction Log” data which possesses high complexity. These files are provided by Da Ding Well Logging Company, China.
0-7695-2929-1/07 $25.00 © 2007 IEEE DOI 10.1109/ICIG.2007.121
200
Table 1. Since WinRAR is commercial software without code being publicized, LZMA, as an open source algorithm, is selected as the platform, on which the efficient lossless compression algorithm is to be studied in this paper. LZMA is an improved version of famous LZ77 compression algorithm. After elementary analysis, we know that the algorithm uses Dynamic Markov Compression, Binary Tree Match Finder, Hash Chain Match Finder, Patricia Match Finder and Range Coder (special code of compression/decompression). For further information about it, please refer to Ref. [2]
rock.cgm(low complexity)
3. Analysis and Algorithm of Result Drawings
ref.cgm(moderate complexity )
Result drawings are mostly stored in vector format such as cgm and pds, between which the cgm format is more commonly used, so we use Result Drawings in cgm format to design algorithm in this article
3.1. Introduction of cgm format ani.cgm(moderate complexity)
The objective of the Computer Graphics Metafile (CGM) is to provide for the description, storage, and communication of graphical information together with related and specific information in a device independent manner. The cgm file is a sequence of Graphical Elements, and ISO/IEC 8632 defines the form (syntax) and functional behavior (semantics) of a set of elements that may occur in the CGM. The following classes of elements are defined: (1)Delimiter Elements; (2)Metafile Descriptor Elements; (3)Picture Descriptor Elements; (4)Control Elements ; (5)Graphical Primitive Elements, which describe the visual components of a picture in the CGM. They are divided into six kinds: Line, Marker, Text, Filled, Area, Cell Array and GDP. (6) Attribute Elements; (7) Escape Elements; (8) External Elements; (9) Segment Elements; (10) Application structure elements. For more information, please refer to Ref. [2].
hdil.cgm(high complexity) Figure 1. Typical Result Drawings Table 1. Compression Ratio of the popular lossless compression software Compression rock.cgm ref.cgm ani.cgm hdil.cgm 860kb 2079kb 1178kb 2611kb LZMA 3.30 4.62 4.21 4.45 ZZip0.36c 2.05 4.24 2.78 2.53 WinZip9.0 1.86 3.06 2.50 2.37 WinRAR3.5 3.51 3.97 4.25 4.24 ShellZip2.3 1.90 3.18 2.56 2.40 UltimateZip 1.92 3.17 2.58 2.41 LMEL143A 1.97 3.27 2.64 2.47 ALZip5.52 1.84 2.95 2.42 2.32 Gzip1.0 1.92 3.17 2.58 2.41
3.2 Analysis of Result Drawings Generally speaking, Analysis of Result Drawings in cgm format are fairly normative, and the drawings’ skeletons of the same kind (like “Reflected Wave”, “Anisotropy Analysis”…) are the same. After analyzing all Graphic Elements of 30 typical Result Drawings in cgm format, we can get the following results:
From the results showed in Table 1 and Figure 4, it can be seen that, for the typical Resulting Drawings in cgm format, the Compression Ratios of LZMA and WinRAR are the highest two. Besides, the compressing speeds of the two kinds of software are only a bit slower than that of the other software in
201
Table 2. Statistics of Graphic Elements in Result Drawings Number Number of Percent of Element of Bytes Appearances Bytes (%) CELL ARRAY[1] 40881663 248 59.20 POLYLINE[1] 24596603 92557 35.62 other elements
496146
39762
5.19
Sum
69059045
139234
100.00
Figure 2.c. Line segment
We can conclude from Table 2 that the size of the two Graphic Elements (POLYLINE and CELLARRAY) occupy about 95 percents in Result Drawings of cgm format, so the main objects to be compressed are POLYLINE and CELLARRAY, so we should improve the Compression of the two elements based on LZMA. From study, we find that in result drawings CELLARRAY is presented mostly in two kinds of Raster Image (or Lattice Image): icons (Figure 2.a) and data image (Figure 2.b). In the cgm standard, there are two methods to manifest a Raster Image: (1) RGB (Red, Green, Blue) True Color mode, in this mode every pixel is represented by 3 bytes, and each byte respectively stands for Red, Green, Blue; (2) Color Palette mode, there is a color palette prepared beforehand in the file, and the value in Raster Image corresponds to an index of the Color Palette. The research shows that the number of colors which CELLARRAY uses is not more than 256, so if the Raster Image part uses RGB True Color mode, we can change it to Color Palette mode. In this way, each pixel only needs one byte (because one byte equals to 8 bits, which can store 2 8 = 256 indexes of different colors). Then the bytes are compressed by the static image compressing standard JPEG-LS[7], and a better compression effect will be gained.
Figure 2.d. Curve The analysis below is based on this fact: In the Result Drawings, the x-coordinate (horizontal) stands for the depth of the well, the y-coordinate(vertical) stands for various kinds of actual data (for example reflected wave data, electric potential data, magnetic force data, radiation quantity data and so forth) which are obtained by sensors detecting the well. From the analysis, in Result Drawings, POLYLINE is presented in two kinds of forms: line segment (Figure 2.c) and curve (Figure 2.d). Line segment is formed by connecting a straight line between head point and tail point, and curve is formed by many straight lines connecting a series of spots, which are called Key Points in this article. (1) The first manifestation of POLYLINE is the line segment (Figure 2.c) t, and it is generally used to form tables like the one in Figure 2.c, which make the analysis of the Result Drawings more convenient for the analysis experts. Through the further study, the line segment in Result Drawings has the following characteristics: 1) All line segments are transverse or longitudinal. 2) Some line segments are completely overlapped. 3) As the line segments are plotted by the computer, there are no long line segments, and all long line segments are made up by many short line segments which are end to end or partially overlapped, all of which are in the same strip of straight line and in the same direction. 4) The distances between massive line segments which have the same length, are in the same directions but not in the same strip of straight line are the same. Based on the characteristics above, this kind of POLYLINE (line segment) in the cgm Result Drawings can be handled as follows: I. All the line segments with the characteristic 2 above can be replaced by a line segment which has the same length, is in the same position and in the same direction. II. All the line segments conforming to the characteristic 3
Figure 2.a. Icon
Figure 2.b. Part of data image in ref.cgm
202
above can be replaced by a long line segment in the same direction; III. All the line segments conforming to the characteristic 4 above can be represented by three parameters: a line segment with the smallest xcoordinate or y-coordinate value, the distance between two neighboring line segments and the number of line segments. (2) Another manifestation of POLYLINE is the data curve (Figure 2.d). And this kind of data curve has the following characteristics: 1) The x-coordinate and y-coordinate of a key point are in float (32 bits) or double (64 bits) types. 2) The difference between the x-coordinate values of two neighboring key points is small, and is a constant. 3) The y-coordinate data is obtained by the mechanical devices (like sensors) detecting along with the well depth increasing, therefore the difference of the neighboring ycoordinate sample values (or the values of key points) is small. According to these rules, this kind of data curve can be handled as follows: I. Pick up all the key points on the curve; II. These key points’ x-coordinates can be expressed in three parameters: the starting key point’s x-coordinate, the x-coordinate spacing and the number of key points; III. The key point’s y-coordinate is suitable to be processed by Adaptive Differential Pulse Code Modulation (ADPCM[8]) and the resulting differences after ADPCM are float or double type. At this point, supposing the Greatest Common Divisor of all the differences is “a”, these differences can be represented by the multiple of “a” (such as x1a, x2a,
Otherwise, store the transverse line segment in the array, which is constructed in step 1, by the order of the x-coordinate of the line segment’s starting point. Similar work is done for longitudinal line segments. After a line segment is stored in the corresponding array, search for the line segments which are near to it. Then merge the completely overlapped line segments into one, merge the line segments which are end to end or partial overlapped into a longer one. When all line segments are read and merged, compress the results by LZMA, and output the encoded stream. (5) If the Graphical Element is not curve, jump to step 6. Otherwise, read the whole curve, represent the x-coordinates of all key points from the same curve in three parameters: starting key point’s xcoordinate, standard spacing and the number of key points. As to the key points’ y-coordinate, compress them by AD PCM, and then represent them in the multiple of their Greatest Common Divisor (GCD) and the multiples are integers of 16 bits. Store the resulting data into the buffer. (6) Store other kinds of Graphical Elements directly into the buffer (whose size is adjusted as to the size of file which is to be compressed). When the buffer is full or when it is not full but the file is read completely, compress all the data in the buffer by LZMA, output the encoded stream, and clear the buffer lastly.
x3a ,…, and x1 , x2 , x3 …are natural numbers). As a result, 32-bit or 64-bit data can be represented by 16 bits and greatly reduce the storage space for the data.
3.3. Lossless Compression Algorithm Based on the analysis above, the Result Drawings oriented lossless compression algorithm is presented as follows (shown in Figure 3): (1) Initialization. Two arrays will be constructed for storing line segments. One is used for transverse line segments. The other is for longitudinal line segments. (2) Read Result Drawings in Graphical Element according to the format of them. (3) If the Graphical Element is a Raster Image, check whether it is presented in RGB True Color mode. If so, convert its mode into Color Palette mode. Then compress it using the international standard of static image compression JPEG-LS, and output the encoded stream. (4) If the Graphical Element is not a transverse line segment or longitudinal one, jump to step 5.
Figure 3. Flow chart of the new compression
203
economical benefit. In the following stage of the research, we will have a deeper analysis of LZMA to get a more awareness of its compressing principle, and improve the new algorithm for a better compression on Result Drawings.
4. Experiment Results and Analysis The Compression Ratios of the new algorithm and the popular lossless compression software for typical Result Drawings with different complexities are shown in Table 3 and Figure 4. Experiment results show that the new algorithm has very good compression for various pictures with different complexities and has higher compression ratio compared with the popular lossless compression software. Table 3. Compression Ratios of various compressions Compression rock.cgm ref.cgm ani.cgm hdil.cgm 860kb 2079kb 1178kb 2611kb New Algorithm 3.85 4.96 4.50 4.61 LZMA 3.30 4.62 4.21 4.45 ZZip0.36c 2.05 4.24 2.78 2.53 WinZip9.0 1.86 3.06 2.50 2.37 WinRAR3.5 3.51 3.97 4.25 4.24 ShellZip2.3 1.90 3.18 2.56 2.40 UltimateZip 1.92 3.17 2.58 2.41 LMEL143A 1.97 3.27 2.64 2.47 ALZip5.52 1.84 2.95 2.42 2.32 Gzip1.0 1.92 3.17 2.58 2.41 5.0
References [1] Information Collaboration Team for Petroleum Well Logging, The Application of New Technology in Well Logging, Petroleum Industry Press, Beijing, 1998. [2] ISO/IEC 8632:1999(E), Information technology Computer graphics- Metafile for the storage and transfer of picture description Information. [3] Igor Pavlov. Home page for LZMA[EB/OL]. http://www.7-zip.org. [4] Damien Debin. Home page for ZZip[EB/OL]. http://www.debin.net/zzip. [5] Mark Nelson, “Data Compression with the BurrowsWheeler Transform”, Dr. Dobb's Journal, America, 1996. [6] David Salomon, Data Compression-The Complete Reference, Second Edition, Springer-Verlag, New York, 2000. [7] ISO/IEC JTCllSC29 WGl ITU-T SG8 (JPEG/JBIG), CD 14495 “Lossless and near-lossless coding of continuous tone still images (JPEG-LS)”, 1998.
New algorithm LZMA
4.5
ZZip0.36c
4.0
[8] Das, M., Chande, S, “Efficient lossless image compression using a simple adaptive DPCM model”, Proceedings of the 44th IEEE 2001 Midwest Symposium on Circuit and Systems, Dayton, Ohio, Aug. 2001, pp. 164 - 167 vol.1.
WinZip9.0 WinRAR3.5
3.5
ShellZip2.3
3.0
UltimateZip LMEL143A
2.5
ALZip5.52
2.0
Gzip1.0
1.5 rock.cgm
ref.cgm
ani.cgm
hdil.cgm
Figure 4. Compression Ratios of new algorithm and popular compression software
5. Conclusion Based on the analysis of Result Drawings, this paper proposes a new compression algorithm with the characteristics of simple structure, high speed, and excellent compression ratio superior to other popular lossless compression software. Completed on the basis of the analysis of Result Drawing in cgm format, this algorithm, however, is irrelevant to the format, and is applicable to Result Drawings in any vector format such as pds. At present, this algorithm has been successfully applied to Da Qing Well Logging Company in China, returning with a satisfactory
204