sensors Article
An Efficient Seam Elimination Method for UAV Images Based on Wallis Dodging and Gaussian Distance Weight Enhancement Jinyan Tian 1 , Xiaojuan Li 1 , Fuzhou Duan 1, *, Junqian Wang 2 and Yang Ou 1 1
2
*
Beijing Key Laboratory for Geographic Information Systems and Environment and Resources, Capital Normal University, Beijing 100048, China;
[email protected] (J.T.);
[email protected] (X.L.);
[email protected] (Y.O.) Department of Geography and Environmental Management, University of Waterloo, Waterloo, ON N2L 2R7, Canada;
[email protected] Correspondence:
[email protected]; Tel.: +86-10-6890-3926; Fax: +86-10-6890-3052
Academic Editors: Felipe Gonzalez Toro and Antonios Tsourdos Received: 22 March 2016; Accepted: 2 May 2016; Published: 10 May 2016
Abstract: The rapid development of Unmanned Aerial Vehicle (UAV) remote sensing conforms to the increasing demand for the low-altitude very high resolution (VHR) image data. However, high processing speed of massive UAV data has become an indispensable prerequisite for its applications in various industry sectors. In this paper, we developed an effective and efficient seam elimination approach for UAV images based on Wallis dodging and Gaussian distance weight enhancement (WD-GDWE). The method encompasses two major steps: first, Wallis dodging was introduced to adjust the difference of brightness between the two matched images, and the parameters in the algorithm were derived in this study. Second, a Gaussian distance weight distribution method was proposed to fuse the two matched images in the overlap region based on the theory of the First Law of Geography, which can share the partial dislocation in the seam to the whole overlap region with an effect of smooth transition. This method was validated at a study site located in Hanwang (Sichuan, China) which was a seriously damaged area in the 12 May 2008 enchuan Earthquake. Then, a performance comparison between WD-GDWE and the other five classical seam elimination algorithms in the aspect of efficiency and effectiveness was conducted. Results showed that WD-GDWE is not only efficient, but also has a satisfactory effectiveness. This method is promising in advancing the applications in UAV industry especially in emergency situations. Keywords: UAV; Wallis dodging; seam elimination; Gaussian distance weight enhancement; earthquake
1. Introduction The development of UAVs conforms to the current increasing demand for low-altitude very high resolution (VHR) remote sensing data [1–3]. Compared with the traditional photogrammetry process, the fast reconstitution of UAV image mosaics is a precondition of its application [4,5]. However, the UAV image-processing challenges include large geometric deformity, small size, large number and uneven exposure. These challenges lead to difficulties in seam elimination when mosaicking UAV images [6,7]. The mosaic seams mainly come from two sources: (1) the color or brightness differences due to the exposure variation; and (2) the texture misplacement due to geometric deformity, projection differences caused by tall landscapes and image capture position differences [8]. These two types of seams clearly appear on the UAV remote sensing platform, therefore, the effective and efficient removal of these seams is essential for the application of UAVs. At present, the major methods of seam elimination are the seamline detection and image fusion methods. The seamline detection method should be considered as a way of circumventing the problem Sensors 2016, 16, 662; doi:10.3390/s16050662
www.mdpi.com/journal/sensors
Sensors 2016, 16, 662
2 of 11
of tall landscapes in the images [9], and can be attributed to two categories: the first category is seamline search by the variation of gradient degree or image texture. Davis [10] proposed the optimal seamline searching method based on Dijkstra’s algorithm, which relies mainly on the calculation of adjacency matrices and distance matrices of high algorithmic complexity [11]. Yuan [12] replaced the Dijkstra algorithm with a greedy algorithm for local optimal path selection. However, the algorithm was still influenced by iterative convergence. Kerschner [13] applied the twin snake operator to automatically select the image seamline. However, the operator cannot guarantee the systematical optimization. Chon [14] eliminated seamlines by dynamic planning stitching. The computational burden of the algorithm rises exponentially with the increase of seamline length [15]. The second category is applying ancillary data to detect the seamline. Wan [16] proposed an algorithm based on the vector path ancillary data, which is only suitable for a few systems and is significantly limited by the vector data. Zuo [17] applied the greedy snake algorithm with the assistance of the DSM method to detect seamlines. The algorithm is fairly complicated and highly dependent on the ancillary data. In conclusion, all these searching seamline algorithms applied on UAV images have three limitations: (1) they require high geometric accuracy of the UAV images, but UAV remote sensing platforms are rather instable and have low parameter accuracy. The equipped camera sensors cannot meet the accuracy requirements because they are not designed for photogrammetry; (2) All of them are complicated and time-consuming. UAV images are small in size but contain large amounts of data, which requires high processing efficiency; (3) Objects in UAV images are not overlapped in a regular manner. The seamlines are difficult to detect, especially for regions with high densities of tall buildings. In addition to the seamline detection method, image fusion can also be applied to eliminate mosaic seams [18]. Uyttendael [19] applied a feathering and interpolating function based on weighted features to reduce the color difference. However, the feathering algorithm tends to give fuzzy edges when smoothing the exposure difference, and can sometimes lead to the “ghosting” effect. Szeliski [20,21] manually selected at least four pairs of feature points, and estimated the variation of images with the function built on the variation of pixel difference of the feature points, which achieved a satisfactory layer fusion effect. However, since the estimation is based on brightness differences, it is highly sensitive to the brightness of images and can be poorly automated [22]. Su [23] proposed an image fusion method based on wavelet multi-scale decomposition. This method first applies wavelet multi-scale decomposition over the source images. Then, the wavelet weight parameters are determined and the images are reconstructed through inverse wavelet transform. The algorithm is highly complicated and it is difficult to determine wavelet parameters [24]. Zomet [25] eliminated mosaic seams by analyzing the contrast in smooth stitching areas. However, the field smoothing can lead to the appearance of “ghosting” effects [11,26]. Tian [27] developed a brightness and texture seam elimination (BTSE) method with a smooth transition effect on a one-dimensional direction in the overlap region. A “ghosting” effect tends to appear at the border when the algorithm is applied to UAV images with the large geometric deformity. In conclusion, all these image fusion methods for UAV images have two major limitations: (1) a “ghosting” effect tends to appear due to the uneven exposure and the large geometric deformity of UAV images; (2) they are fairly complicated and require long computation times, which conflicts with the fact that UAV systems require high data processing efficiency to deal with the massive amount of image data. Therefore, the objective of this study is twofold: firstly, to adjust the difference of brightness between the two matched images with the Wallis dodging method and; secondly, to develop a new image fusion algorithm to eliminate the texture seamline based on the First Law of Geography. 2. Study Site and Data The study site is located in Hanwang (104˝ 091 E to 104˝ 121 E and 31˝ 251 N to 31˝ 281 N) in the northwestern part of the Sichuan Basin (China) and has an overall area of 54.3 km2 . It is a city at the foot of mountains with an average elevation of 685 m above sea level and slopes of less than 5˝ . As an industrial city, it has a sound transportation system and a total population of 53,000, among
Sensors 2016, 16, 662
3 of 11
which the non-agricultural population is 35,000 [28,29]. The major land uses of this study site are woodland, farmland, water, road, and buildings. In this task, UAV image data were acquired on 15 May 2008 after the 5.12 Wenchuan Earthquake. The flight altitude and speed of the UAV platform are 400 m and 50 km/h, respectively. The major parameters of the image sensor equipped on the UAV platform are shown in Table 1. A total of 678 images were acquired with an image resolution of 0.3 m. The average forward overlap is 70% and the side forward overlap is 40%. Table 1. The parameters of the image sensor. Items
Parameters
Image Sensor Pixel Number Focal Distance CCD Navigation sensor Image Format
Ricoh Digital 3648 ˆ 2736 28 mm 1/1.75 inch GPS JPEG
3. Methodology 3.1. Wallis Dodging Image processing before image fusion contains two major steps: image matching and image dodging. Image matching aims to find corresponding points, and image dodging was used to eliminate the brightness differences between two matched images. First, in order for us to find the corresponding points between two images, an image matching method should be applied. In this study, the Scale-Invariant Feature Transform (SIFT) algorithm was used to match the two images [30,31], which consists of four stages: (1) building the scale-space; (2) keypoint localization; (3) removal of bad keypoints; and (4) keypoint description. It has been proven in many studies [32,33] that SIFT not only performs well in image rotation, scale zoom and illumination changes, but also does well in affine transformation, and noise jamming. Subsequently, the Random Sample Consensus (RANSAC) method was applied to the points matched by SIFT to remove any mismatched points [34]. Additionally, the Wallis dodging algorithm [8,35,36] was employed to adjust the difference of brightness between the two matched images before the texture seam elimination method. The principle behind Wallis image dodging is that it can adjust the variance and mean value of the target image to the reference image’s level. The Wallis filter can be defined by Equation (1): Iij “ pIij2 ´ I 2 q ˆ
cσI 1 ` bI 1 ` p1 ´ bqI 2 cσI 2 ` p1 ´ cqσI 1
(1)
where I1 is reference image, I2 is target image, and Iij is the pixel value of I2 in i row, j column after image dodging. I 1 , I 2 and σ I 1 , σ I 2 , are the mean and variance value of I1 and I2 , respectively; cP[0.1] is an adjustment coefficient for variance value of the image, and bP[0.1] is an adjustment coefficient for the mean value. However, setting the two specific parameters is still a critical question in the existing research. The parameter setting method was derived in this study. First, the variance of the target image is shown in Equation (2): g fmÿ ´1 f ´1 nÿ σI 2 “ e pIij2 ´I 2 q2 {m ˆ n
(2)
i“0 j“0
Second, the variance and mean value of the target image was adjusted to the reference image’s level. So the variance and mean value of the target image after image dodging should be roughly equal to σ I 1 and I 1 , respectively. Therefore, they can be denoted as Equation (3):
Sensors 2016, 16, 662
4 of 11
g fmÿ ´1 f ´1 nÿ σI 1 « e pIij ´I 1 q2 {m ˆ n
(3)
i“0 j“0
Third, both sides of the Equation (3) are multiplied by σ I 2 {σ I 1 : g fmÿ ´1 nÿ ´1 σI 2 f pIij ´I 1 q2 {m ˆ n σI 2 « ˆe σI 1
(4)
i“0 j“0
Then, simultaneous application of Equations (2) and (4) gives: σI 2 ˆ pIij ´ I 1 q « Iij2 ´ I 2 σI 1
(5)
Finally, the pixel value of target image after image dodging is shown in Equation (6): Iij «
σI 1 ˆ pIij2 ´ I 2 q ` I 1 σI 2
(6)
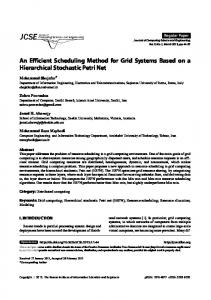
Comparing Equation (1) with Equation (6), it found that we will get Equation (6) when the parameters (b and c) were both set to 1 in Equation (1). Therefore, to adjust the mean and variance value of target image to reference image’s level, Equation (6) with Wallis filter (b = 1, c = 1) was used for UAV image dodging. 3.2. GDWE Method 3.2.1. Theoretical Basis The First Law of Geography proposed by Waldo Tobler in 1970 is “all attribute values on a geographic surface are related to each other, but closer values are more strongly related than are more distant ones” [37]. The law is the foundation of the fundamental concepts of spatial autocorrelation and spatial dependence [38], based on which we have developed an effective and efficient seamline elimination method (GDWE) for UAV image. The principle of GDWE is an image fusion algorithm combining relevant information from two matched UAV images into a single image in the overlapping region. As such, GDWE embraces three major steps: first, the principal point of each image was set as the optimal pixel with the minimum geometric distortion because the image sensor equipped on UAV platform is, in general, a type of non-measurement array CCD camera. Second, the weight in a certain pixel contributed by each image in the overlap region was determined by the distance between the pixel and the principal point. A two-dimensional Gaussian kernel was then employed to describe it. Third, in order to enhance the influence of distance to the weight, an exponent form adjustment coefficient was introduced and it was parameterized by a sensitive analysis method. 3.2.2. Seam Elimination To develop the algorithm for image fusion in the overlap region of the matched UAV images, some parameters should be defined first, in which the principle points of the two matched images were O1 and O2 ; O is an arbitrary point in the overlap region; d1 (|O ´ O1 |) and d2 (|O ´ O2 |) are the distances between O1 , O2 and O; The pixel values of point O in the two matched UAV images are Iij1 and Iij2 . The pixel value of point O after image fusion is Iij . Therefore, Iij can be defined as ω1 ˆ Iij1 ` ω2 ˆ Iij2 , where w1 , w2 are the weight contributions of the two UAV images to point O, and w1 plus w2 is equal to 1. Based on the theory mentioned above, a Gaussian kernel shown in Figure 1 was introduced to describe the Gaussian distance weight distribution (Gw1 ), and was defined by Equation (1): 2 2 Gw1 “ a ˆ e´p|O´O1 |{|O´O2 |q {2σ
(7)
Sensors 2016, 16, 662
5 of 11
where a was set to 1 because Gw1 should be equal to 1 when d1 is 0. In order to enhance the influence of Gaussian distance on the weight, an exponent form adjustment coefficient (λ) was introduced into Sensors 2016, 16, 662 5 of 11 Equation (2): 2λ
1 |{|O´O2 |q {22σ w1 “ e´p|O´OO O1 O O2 2
2
w1 e
(8)
(8)
In which w1 was set to 0.5 when d1 equals d2 . When we apply the relationship to Equation (8), we get: In which w1 was set to 0.5 when d1 equalsad2. When we apply the relationship to Equation (8), we get: σ “ 1{ p2 ˆ ln2q (9) 1 2 ln 2 (9) Therefore, including these terms in Equation (8) results in Equation (9), the pixel value was defined byTherefore, Equationincluding (10): these terms in Equation (8) results in Equation (9), the pixel value was defined by Equation´(10):
¯ ´ ¯ O2 |q2λ 1 p|O´O1 |{|O´O2 |q2λ Iij “ 0.5p|O´O1 |{|OO´ ` 1 ´ 0.5 ˆ Iij2 2 ˆ I 2 ij O O O2 O O O O2 I ij 0.5 1 I 1ij 1 0.5 1 I ij2
(10) (10)
Finally, we named our method Wallis dodging and Gaussian distance weight enhancement Finally, we named our method Wallis dodging and Gaussian distance weight enhancement (WD-GDWE) when taking the Wallis dodging algorithm into consideration. It is shown in (WD-GDWE) when taking the Wallis dodging algorithm into consideration. It is shown in Equation (11): Equation (11):
˙ ´ ¯ ´ ¯ ˆ |qI2λ 2 2σI 1 1 2 O´O2 |q O2λO O O 1 p| OO´ O O O1|{| O O´O2 2 q ` I 1 (11) (11) 1 Iij “ 0.5p|O´O1 |{| ˆ I ` 1 ´ 0.5 ˆ ˆ pI ´ I ( I ij I ) I ij I ij 0.5 ij I 1 0.5 σI 2 I
2
1
2
ij
2
1
2
1
2
Figure 1. example An example a two-dimensionalGaussians Gaussians distance distribution kernel. Figure 1. An of aoftwo-dimensional distanceweight weight distribution kernel.
4. Results and Discussion
4. Results and Discussion 4.1. Wallis Dodging
4.1. Wallis Dodging
To assess the efficiency and effectiveness of WD-GDWE for seamline elimination of UAV
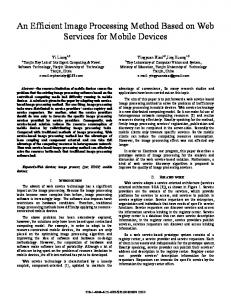
To assessthe themethod efficiency effectiveness WD-GDWE for seamline elimination of UAV images, was and implemented with of Visual C++ programming using 8 GB memory and images, an the method was2.5 implemented withUAV Visual C++covering programming using 8types GB memory and an Intel Xeon Intel Xeon GHz CPU. The images five different of land use (woodland, farmland, water, road, and buildings) study site were 2.5 GHz CPU. The UAV images coveringfrom fivethe different types oftested. land use (woodland, farmland, water, Figure 2 shows the results of stacking directly versus stacking after Wallis dodging for two road, and buildings) from the study site were tested. matched UAV images covering five different types of land use. From the perspective of visual effects, Figure 2 shows the results of stacking directly versus stacking after Wallis dodging for two matched the results indicate that the brightness difference of two matched images has been effectively UAV images covering five different types of land use. From the perspective of visual effects, the results balanced by Wallis dodging, in which the left figure of each figure group in Figure 2 was stacked indicate that the brightness difference of two matched images has been effectively balanced by Wallis directly and the right figure was stacked after Wallis dodging. The root mean-square error (RMSE) dodging, in of which the left of each figure group in Figure wastwo stacked directly and theinright values the mean andfigure standard deviation were calculated from2 the matched UVA images figurethe was stacked after Wallis dodging. The root mean-square error (RMSE) values of the mean overlap region for direct stacking and Wallis dodging, respectively. For each type of land use, at and standard deviation were calculated from the two matched UVA images in the overlap region for least 36 pairs of matched images were tested, and the averages of the RMSE values were recorded indirect stacking and Wallis dodging, respectively. eachmethod type ofcan land use, at least 36 the pairs of matched Table 2. The results show that the Wallis For dodging effectively balance brightness differences between matched in which thewere RMSE of mean in andTable stand2.deviation wereshow images were tested, andthe thetwo averages ofimages, the RMSE values recorded The results determined to be 0.0 and less than respectively. that the Wallis dodging method can 0.3, effectively balance the brightness differences between the two
Sensors 2016, 16, 662
6 of 11
matched images, in which the RMSE of mean and stand deviation were determined to be 0.0 and less than Sensors 0.3, respectively. 2016, 16, 662 6 of 11
(a)
(b)
(c)
(d)
(e)
Figure 2. The results of Wallis dodging for two matched UAV images of each type land use, in which
Figure 2. The results of Wallis dodging for two matched UAV images of each type land use, in which (a)–(e) correspond to buildings, woodland, farmland, road, and water, respectively. For example, in (a)–(e) correspond to buildings, woodland, farmland, road, and water, respectively. For example, in the the case of (a), the left figure was the direct stacking result of two matched images, whereas the right case of (a), was the left was theof direct stackingimages result after of two matched images, whereas the right figure figure the figure stacking result two matched Willis dodging. was the stacking result of two matched images after Willis dodging. Table 2. Average of RMSE values of mean (M) and standard deviation (SD) calculated from the UVAofimages stacking directly and Wallis dodging, respectively, in each type of land Tablematched 2. Average RMSEfor values of mean (M) and standard deviation (SD) calculated from the use. matched UVA images for stacking directly and Wallis dodging, respectively, RMSE in each type of land use. Land Use
Stacking Directly Building LandWallis Use Dodging Stacking Directly Woodland Wallis Dodging Stacking Directly Building Stacking Directly Wallis Dodging Farmland Wallis Dodging Stacking Directly Stacking Directly Road Woodland Wallis Dodging Wallis Dodging Stacking Directly Water Stacking Directly Wallis Dodging
Farmland
Wallis Dodging
M SD 24.5RMSE 6.5 0.0 0.2 M SD6.2 23.6 0.0 24.5 6.50.1 19.8 5.7 0.0 0.2 0.0 0.1 17.5 23.6 6.23.6 0.0 0.0 0.10.1 36.2 9.5 19.8 5.70.3 0.0
0.0
0.1
4.2. WD-GDWE Method
Stacking Directly 17.5 3.6 Road Wallis Dodging 0.0 0.1 To acquire the optimal adjustment coefficient (λ) for the WD-GDWE method, a series of values 36.2which the 9.5 optimal value of λ was from zero to five with a step size of Stacking 0.2 were Directly set, based on Water Wallisthe Dodging 0.0 reference 0.3 images was achieved. In determined when the lowest RMSE between test images and this study, the optimal value of λ was set to 2.6. Lastly, performance comparisons between WD-GDWE Method and five other classical seamline elimination algorithms were conducted in terms of 4.2. WD-GDWE efficiency and effectiveness. The specific five classical methods are: Tian’s BTSE algorithm, To acquire the optimalalgorithm, adjustment (λ) for the WD-GDWE method, a series of values Uyttendael’s feathering Su’scoefficient Wavelet algorithm, Szeliski’s algorithm, and Davis’s Dijkstra from algorithm, zero to fiveinwith a step sizefour of 0.2 were set, optimal value λ was determined which the first methods arebased basedon onwhich image the fusion and the lastof one is based on whenseamline the lowest RMSEGenerally, betweenthe theimage test images and reference images achieved. In this detection. quality assessment indicators forwas seamline elimination canstudy, be divided toofthree types [39–43]: (1) amount of information: information standard the optimal value λ was set to 2.6. Lastly, performance comparisons betweenentropy, WD-GDWE and five deviation, cross entropy, signal to noise ratio, and joint entropy [44,45]; (2) image quality: average other classical seamline elimination algorithms were conducted in terms of efficiency and effectiveness. gradient five and wavelet ratio [46]; spectral information reserved: RMSE, standard deviation, The specific classicalenergy methods are: (3) Tian’s BTSE algorithm, Uyttendael’s feathering algorithm, deviation, and spectral distortion; Taking all three types of indicators into consideration, information Su’s Wavelet algorithm, Szeliski’s algorithm, and Davis’s Dijkstra algorithm, in which the first four entropy, average gradient, and RMSE were selected to access the specific five methods of seamline methods are based on image fusion and the last one is based on seamline detection. Generally, the elimination, respectively. In addition, processing time is also an indicator for evaluating the efficiency image quality assessment indicators for seamline elimination can be divided to three types [39–43]: of the algorithm. It should be noted that orthoimages were severed as reference images of the RMSE, (1) amount of information: information standard deviation, cross entropy, signal to noise which was produced from the control entropy, points recorded by artificial with the help of a differential GPS. ratio, and joint From entropy [44,45]; (2) image quality: average gradient and wavelet energy ratio [46]; (3) spectral the perspective of visual effects, Figure 3 shows the performance comparisons of the five information reserved: RMSE, standard deviation, deviation, and spectral distortion; Taking all seamline elimination methods, in which Figure 3a is the direct stacking result, Figure 3b is thethree
types of indicators into consideration, information entropy, average gradient, and RMSE were selected
Sensors 2016, 16, 662
7 of 11
to access the specific five methods of seamline elimination, respectively. In addition, processing time is also an indicator for evaluating the efficiency of the algorithm. It should be noted that orthoimages were severed as reference images of the RMSE, which was produced from the control points recorded by artificial with the help of a differential GPS. From the perspective of visual effects, Figure 3 shows the performance comparisons of the fiveSensors seamline elimination methods, in which Figure 3a is the direct stacking result, Figure 3b 2016, 16, 662 7 of 11 is the WD-GDWE method result, Figure 3c–g is the results of the other five different seamless WD-GDWE method result, Figure 3c–g is the results of the other five different seamless methods, methods, respectively. respectively.
(a) Stacking Directly
(b) WD-GDWE method
(c) BTSE method
(d) Dijkstra
(e) Feather
(f) Wavelet
(g) Szeliski
Figure 3. The performance comparison of different seam elimination algorithms.
Figure 3. The performance comparison of different seam elimination algorithms.
Comparing Figure 3a,b, we find that the buildings and the roads obviously display mosaic dislocation, whereas the phenomenon has been greatly improved with the WD-GDWE method. The performance comparisons of the five seamline elimination methods shown in Figure 3c–f indicate that: (1) a “ghosting” effect tends to appear in the Feather, Wavelet, Szeliski, and BTSE algorithms; (2) the visual effects of the Dijkstra algorithm and WD-GDWE are much better than those of the other
Sensors 2016, 16, 662
8 of 11
Comparing Figure 3a,b, we find that the buildings and the roads obviously display mosaic dislocation, whereas the phenomenon has been greatly improved with the WD-GDWE method. The performance comparisons of the five seamline elimination methods shown in Figure 3c–f indicate that: (1) a “ghosting” effect tends to appear in the Feather, Wavelet, Szeliski, and BTSE algorithms; (2) the visual Sensors 2016,effects 16, 662 of the Dijkstra algorithm and WD-GDWE are much better than those of the 8 of other 11 methods. From the perspective of image quality assessment indicators, the details of the performance methods. From of image quality assessment details ofis the comparisons of thethe sixperspective methods were shown Figure 4. Eachindicators, of the fourthe indicators anperformance average value comparisons of the six methods were shown Figure 4. Each of the four indicators is an average value calculated from lots of UAV images (at least 36 pairs) for each type of land use. Figure 4a,b show that calculated from lots of UAV images (at least 36 pairs) for each type of land use. Figure 4a,b show that Dijkstra method gives the most abundant amount of information and the highest definition, and the Dijkstra method gives the most abundant amount of information and the highest definition, and the WD-GDWE method follows. The BTSE is worse than the WD-GDWE method at the border of the WD-GDWE method follows. The BTSE is worse than the WD-GDWE method at the border of the fusion image because it only supports smooth transitions in a one-dimensional direction in the fusion image because it only supports smooth transitions in a one-dimensional direction inoverlap the region. Considering the improvement of WD-GDWE from BTSE is not obvious in Figure 3 from3 the overlap region. Considering the improvement of WD-GDWE from BTSE is not obvious in Figure perspective visual effects, therefore, some experimental results results at the border of theoffusion images from the of perspective of visual effects, therefore, some experimental at the border the fusion withimages the two methods added (Figure 5).(Figure The Wavelet Szeliski are muchare worse with the twowere methods were added 5). Theand Wavelet andalgorithm Szeliski algorithm muchthan the BTSE and the Feather is algorithm the worst isone. 4c shows the WD-GDWE worse method, than the BTSE method, andalgorithm the Feather the Figure worst one. Figure that 4c shows that the WD-GDWE method more spectralthan information than thealgorithms. other four algorithms. Figure that 4d it method preserves morepreserves spectral information the other four Figure 4d shows shows that it to takes little time to runBTSE, the WD-GDWE, Szeliski, and Feather algorithms, takes a little time runathe WD-GDWE, Szeliski, andBTSE, Feather algorithms, whereas the Dijkstra Dijkstra Wavelet method time-consuming. In a word, theisWD-GDWE method but andwhereas Waveletthe method areand time-consuming. Inare a word, the WD-GDWE method not only efficient, is not only efficient, but also has a satisfactory effectiveness. also has a satisfactory effectiveness.
(a) Information Entropy
(b) Average Gradient
(c) RMSE
(d) Time Consumption (s)
Figure 4. Comparisons of different elimination seam algorithms. (a) Information entropy for
Figure 4. Comparisons of different elimination seam algorithms. (a) Information entropy for describing describing the amount of information; (b) verage gradient to access the image qualities; (c) RMSE the amount of information; (b) verage gradient to access the image qualities; (c) RMSE between the between the specific five methods with the orthoimages; (d) time consumption of the six methods. specific five methods with the orthoimages; (d) time consumption of the six methods.
Sensors 2016, 16, 662
9 of 11
Sensors 2016, 16, 662
9 of 11
(a)
(b)
Figure 5. Both (a) and (b) are the results at the border of the fusion images, in which the left one in (a) Figure 5. Both (a) and (b) are the results at the border of the fusion images, in which the left one in or (b) is with the BTSE method and the right one used the WD-GDWE method. (a) or (b) is with the BTSE method and the right one used the WD-GDWE method.
5. Conclusions 5. Conclusions In this study, an efficient seam elimination method for UAV images based on Wallis dodging In this study, an efficient seam elimination method for UAV images based on Wallis dodging and and Gaussian distance weight enhancement was proposed. The method has successfully tested by Gaussian distance weight enhancement was proposed. The method has successfully tested by using using UAV images acquired after the 5.12 Wenchuan Earthquake. By comparison with other five UAV images acquired after the 5.12 Wenchuan Earthquake. By comparison with other five classical classical seam elimination methods, the conclusions from this study can be summarized as follows: seam elimination methods, the conclusions from this study can be summarized as follows: (1) the (1) the WD-GDWE method can effectively adjust the brightness differences between two matched WD-GDWE method can effectively adjust the brightness differences between two matched images; images; (2) the method can successfully eliminate the texture mosaic seams which are usually caused (2) the method can successfully eliminate the texture mosaic seams which are usually caused by by geometric deformity, projection differences, and image capture position differences on UAV geometric deformity, projection differences, and image capture position differences on UAV platforms; platforms; (3) the WD-GDWE method is highly-efficient, which can meet the high processing speed (3) the WD-GDWE method is highly-efficient, which can meet the high processing speed requirements requirements of massive UAV images. Time-savings are very important in advancing the of massive UAV images. Time-savings are very important in advancing the applications in the UAV applications in the UAV industry, especially in emergency situations. The results of this study can be industry, especially in emergency situations. The results of this study can be further extended to other further extended to other fields, such as aerospace remote sensing and computer vision. fields, such as aerospace remote sensing and computer vision. Acknowledgments: We acknowledge financial support from the National Natural Science Foundation of China Acknowledgments: We financialThe support from the National Science Foundation of China (No.41130744/D0107 andacknowledge 41171335/D010702). authors thank Donghai Natural Xie for his valuable comments to the (No.41130744/D0107 and 41171335/D010702). The authors thank Donghai Xie for his valuable comments to the paper. We are also deeply indebted to the reviewers and editors for the thoughtful and constructive comments paper. We are also deeply indebted to the reviewers and editors for the thoughtful and constructive comments on on improving the manuscript. improving the manuscript. Author carried outout the the analyses and and wrotewrote the manuscript. Xiaojuan Li and Fuzhou Author Contributions: Contributions: Jinyan JinyanTian Tian carried analyses the manuscript. Xiaojuan Li and Duan were responsible for recruitment the participants, and design the experiments. Junqian Wang and Wang Yang Fuzhou Duan were responsible for recruitment the participants, and design the experiments. Junqian and were Yang responsible Ou were responsible data processing. All the authors the manuscript, and approved the Ou for data for processing. All the authors drafteddrafted the manuscript, and approved the final final manuscript. manuscript. Conflicts of Interest: The authors declare no conflict of interest. Conflicts of Interest: The authors declare no conflict of interest.
References References 1. 1.
2. 2. 3. 3. 4. 4. 5.
Mesas-Carrascosa, F.J.; Rumbao, I.C.; Berrocal, J.A. Porras AG Positional quality assessment of orthophotos Mesas-Carrascosa, F.J.; Rumbao, I.C.; Berrocal, J.A. Porras AG Positional quality assessment of orthophotos obtained from sensors onboard multi-rotor UAV platforms. Sensors 2014, 14, 22394–22407. [CrossRef] obtained from sensors onboard multi-rotor UAV platforms. Sensors 2014, 14, 22394–22407. [PubMed] Xu, Y.; Ou, J.; He, H.; Zhang, X.; Mills, J. Mosaicking of Unmanned Aerial Vehicle Imagery in the Absence Xu, Y.; Ou, J.; He, H.; Zhang, X.; Mills, J. Mosaicking of Unmanned Aerial Vehicle Imagery in the Absence of of Camera Poses. Remote Sens. 2016, 8, 204. Camera Poses. Remote Sens. 2016, 8, 204. [CrossRef] Karpenko, S.; Konovalenko, I.; Miller, A.; Miller, B.; Nikolaev, D. UAV Control on the Basis of 3D Landmark Karpenko, S.; Konovalenko, I.; Miller, A.; Miller, B.; Nikolaev, D. UAV Control on the Basis of 3D Landmark Bearing-Only Observations. Sensors 2015, 15, 29802–29820. Bearing-Only Observations. Sensors 2015, 15, 29802–29820. [CrossRef] [PubMed] Wang, Y.C.; Liu, J.G. Evaluation methods for the autonomy of unmanned systems. Chin. Sci. Bull. 2012, 57, Wang, Y.C.; Liu, J.G. Evaluation methods for the autonomy of unmanned systems. Chin. Sci. Bull. 2012, 57, 3409–3418. 3409–3418. [CrossRef] Gonzalez, L.F.; Montes, G.A.; Puig, E.; Johnson, S.; Mengersen, K.; Gaston, K.J. Unmanned Aerial Vehicles (UAVs) and Artificial Intelligence Revolutionizing Wildlife Monitoring and Conservation. Sensors 2016, 16, 97.
Sensors 2016, 16, 662
5.
6. 7.
8. 9. 10. 11. 12. 13. 14. 15. 16. 17. 18.
19.
20. 21.
22. 23. 24. 25. 26. 27. 28.
10 of 11
Gonzalez, L.F.; Montes, G.A.; Puig, E.; Johnson, S.; Mengersen, K.; Gaston, K.J. Unmanned Aerial Vehicles (UAVs) and Artificial Intelligence Revolutionizing Wildlife Monitoring and Conservation. Sensors 2016, 16, 97. [CrossRef] [PubMed] Zhou, G. Near real-time orthorectification and mosaic of small UAV video flow for time-critical event response. IEEE Trans. Geosci. Remote Sens. 2009, 47, 3. [CrossRef] Wehrhan, M.; Rauneker, P.; Sommer, M. UAV-Based Estimation of Carbon Exports from Heterogeneous Soil Landscapes—A Case Study from the CarboZALF Experimental Area. Sensors 2016, 16, 255. [CrossRef] [PubMed] Sun, M.W.; Zhang, J.Q. Dodging research for digital aerial images. Int. Arch. Photogramm. Remote Sens. Spat. Inf. Sci. 2008, 37, 349–353. Choi, J.; Jung, H.S.; Yun, S.H. An Efficient Mosaic Algorithm Considering Seasonal Variation: Application to KOMPSAT-2 Satellite Images. Sensors 2015, 15, 5649–5665. [CrossRef] [PubMed] Davis, J. Mosaics of scenes with moving objects. In Proceedings of the 1998 IEEE Computer Society Conference on Computer Vision and Pattern Recognition, Santa Barbara, CA, USA, 23–25 June 1998. Philip, S.; Summa, B.; Tierny, J.; Bremer, P.T.; Pascucci, V. Distributed Seams for Gigapixel Panoramas. IEEE Trans. Vis. Comput. Graph. 2015, 21, 350–362. [CrossRef] [PubMed] Yuan, X.X.; Zhong, C. An improvement of minimizing local maximum algorithm on searching Seam line on searching seam line for orthoimage mosaicking. Acta Geod. Cartgraph. Sin. 2012, 41, 199–204. Kerschner, M. Seamline detection in colour orthoimage mosaicking by use of twin snakes. ISPRS J. Photogramm. Remote Sens. 2001, 56, 53–64. [CrossRef] Chon, J.; Kim, H.; Lin, C.S. Seam-line determination for image mosaicking: A technique minimizing the maximum local mismatch and the global cost. ISPRS J. Photogramm. Remote Sens. 2010, 65, 86–92. [CrossRef] Mills, S.; McLeod, P. Global seamline networks for orthomosaic generation via local search. ISPRS J. Photogramm. Remote Sens. 2013, 75, 101–111. [CrossRef] Wan, Y.; Wang, D.; Xiao, J.; Lai, X.; Xu, J. Automatic determination of seamlines for aerial image mosaicking based on vector roads alone. ISPRS J. Photogramm. Remote Sens. 2013, 76, 1–10. [CrossRef] Zuo, Z.Q.; Zhang, Z.X.; Zhang, J.Q. Seam line intelligent detection in large urban orthoimage mosaicking. Acta Geod. Cartgraph. Sin. 2011, 40, 84–89. Borra-Serrano, I.; Peña, J.M.; Torres-Sánchez, J.; Mesas-Carrascosa, F.J.; López-Granados, F. Spatial Quality Evaluation of Resampled Unmanned Aerial Vehicle-Imagery for Weed Mapping. Sensors 2015, 15, 19688–19708. [CrossRef] [PubMed] Uyttendaele, M.; Eden, A.; Skeliski, R. Eliminating ghosting and exposure artifacts in image mosaics. In Proceedings of the CVPR 2001 IEEE Computer Society Conference on Computer Vision and Pattern Recognition, Kauai, HI, USA, December 11–14 2001. Szeliski, R. Video mosaics for virtual environments. Comput. Graph. Appl. 1996, 16, 22–30. [CrossRef] Szeliski, R.; Shum, H.Y. Creating full view panoramic image mosaics and environment maps. In Proceedings of the 24th Annual Conference on Computer Graphics and Interactive Techniques, Los Angeles, CA, USA, 3–8 August 1998. Szeliski, R. Computer Vision: Algorithms and Applications; Springer Science & Business Media: London, UK, 2010. Su, M.S.; Hwang, W.L.; Cheng, K.Y. Analysis on multiresolution mosaic images. IEEE Trans. Image Proc. 2004, 13, 952–959. [CrossRef] Gracias, N.; Mahoor, M.; Negahdaripour, S.; Gleason, A. Fast image blending using watersheds and graph cuts. Image Vis. Comput. 2009, 27, 597–607. [CrossRef] Zomet, A.; Levin, A.; Peleg, S.; Weiss, Y. Seamless image stitching by minimizing false edges. IEEE Trans. Image Proc. 2006, 15, 969–977. [CrossRef] Avidan, S.; Shamir, A. Seam carving for content-aware image resizing. ACM Trans. Gr. 2007. [CrossRef] Duan, F.Z.; Li, X.; Qu, X.; Tian, J.; Wang, L. UAV image seam elimination method based on Wallis and distance weight enhancement. J. Image Graph. 2014, 19, 806–813. Zhang, J.; Deng, W. Multiscale Spatio-Temporal Dynamics of Economic Development in an Interprovincial Boundary Region: Junction Area of Tibetan Plateau, Hengduan Mountain, Yungui Plateau and Sichuan Basin, Southwestern China Case. Sustainability 2016, 8, 215. [CrossRef]
Sensors 2016, 16, 662
29.
30. 31. 32. 33. 34.
35. 36. 37. 38. 39.
40. 41. 42. 43. 44. 45. 46.
11 of 11
Chen, F.; Guo, H.; Ishwaran, N.; Zhou, W.; Yang, W.; Jing, L.; Cheng, F.; Zeng, H. Synthetic aperture radar (SAR) interferometry for assessing Wenchuan earthquake (2008) deforestation in the Sichuan giant panda site. Remote Sens. 2014, 6, 6283–6299. [CrossRef] Lowe, D.G. Object recognition from local scale-invariant features. In Proceedings of the Seventh IEEE International Conference on Computer Vision, Kerkyra, Greek, 20–27 September 1999. Lowe, D.G. Distinctive image features from scale-invariant keypoints. Int. J. Comput. Vis. 2004, 60, 91–110. [CrossRef] Zhou, R.; Zhong, D.; Han, J. Fingerprint identification using SIFT-based minutia descriptors and improved all descriptor-pair matching. Sensors 2013, 13, 3142–3156. [CrossRef] [PubMed] Lingua, A.; Marenchino, D.; Nex, F. Performance analysis of the SIFT operator for automatic feature extraction and matching in photogrammetric applications. Sensors 2009, 9, 3745–3766. [CrossRef] [PubMed] Civera, J.; Grasa, O.G.; Davison, A.J.; Montiel, J.M.M. 1-Point RANSAC for extended Kalman filtering: Application to real-time structure from motion and visual odometry. J. Field Robot. 2010, 27, 609–631. [CrossRef] Li, D.R.; Wang, M.; Pan, J. Auto-dodging processing and its application for optical remote sensing images. Geom. Inf. Sci. Wuhan Univ. 2006, 6, 183–187. Pham, B.; Pringle, G. Color correction for an image sequence. Comput. Graph. Appl. 1995, 15, 38–42. [CrossRef] Tobler, W.R. A computer movie simulating urban growth in the Detroit region. Econ. Geogr. 1970, 46, 234–240. [CrossRef] Kemp, K. Encyclopedia of Geographic Information Science; SAGE: Thousand Oaks, CA, USA, 2008; pp. 146–147. Efros, A.A.; Freeman, W.T. Image quilting for texture synthesis and transfer. In Proceedings of the 28th Annual Conference on COMPUTER Graphics and Interactive Techniques, Los Angeles, CA, USA, 12–17 August 2001. Kwatra, V.; Schödl, A.; Essa, I.; Turk, G.; Bobick, A. Graphcut textures: image and video synthesis using graph cuts. ACM Trans. Graph. 2003. [CrossRef] Kuang, D.; Yan, Q.; Nie, Y.; Feng, S.; Li, J. Image seam line method based on the combination of dijkstra algorithm and morphology. SPIE Proc. 2015. [CrossRef] Pan, J.; Wang, M.; Li, D.; Li, J. Automatic generation of seamline network using area Voronoi diagrams with overlap. IEEE Trans. Geosci. Remote Sens. 2009, 47, 1737–1744. [CrossRef] Agarwala, A.; Donteheva, M.; Agarwala, M.; Drucker, M.; Colburn, A.; Curless, B.; Salesin, D.; Cohen, M. Interactive digital photomontage. ACM Trans. Graph. 2004, 23, 294–302. [CrossRef] Brown, M.; Lowe, D.G. Automatic panoramic image stitching using invariant features. Int. J. Comput. Vis. 2007, 74, 59–73. [CrossRef] Summa, B.; Tierny, J.; Pascucci, V. Panorama weaving: fast and flexible seam processing. ACM Trans. Graph. (TOG) 2012, 31, 83. [CrossRef] Shum, H.Y.; Szeliski, R. Systems and experiment paper: Construction of panoramic image mosaics with global and local alignment. Int. J. Comput. Vis. 2000, 36, 101–130. [CrossRef] © 2016 by the authors; licensee MDPI, Basel, Switzerland. This article is an open access article distributed under the terms and conditions of the Creative Commons Attribution (CC-BY) license (http://creativecommons.org/licenses/by/4.0/).