International Journal of Civil Engineering and Technology (IJCIET) Volume 8, Issue 10, October 2017, pp. 1396–1409, Article ID: IJCIET_08_10_142 Available online at http://http://www.iaeme.com/ijciet/issues.asp?JType=IJCIET&VType=8&IType=10 ISSN Print: 0976-6308 and ISSN Online: 0976-6316 © IAEME Publication
Scopus Indexed
PROPOSING AN EFFICIENT METHOD FOR CATEGORIZING BRAIN MRI IMAGES BASED ON PATTERN RECOGNITION TECHNIQUES AND USING NEURAL NETWORK Ghazal Davoudi Department of Computer Engineering, Ahvaz Branch, Islamic Azad University, Ahwaz, Iran Seyyed Enayatollah Alavi Assistant Professor, Department of Computer Engineering, Faculty of Engineering, Shahid Chamran University of Ahvaz, Ahwaz, Iran ABSTRACT The present study was aimed to identify the sick from the healthy persons based on a set of MRI images through using image categorization algorithms. Furthermore, this research tries to categorize images through the application of neural networks' pattern recognition technics and, to propose a model with adequate precision and efficiency for categorization of images that could be used for determining both the normality and abnormality of MRI images of the brain and, the cause of illness. The software of Clemente and MATLAB were used for simulation purposes. Key words: Pattern Recognition Technics, Neural Networks, Algorithm, MRI. Cite this Article: Ghazal Davoudi and Seyyed Enayatollah Alavi, Proposing an Efficient Method For Categorizing Brain MRI Images Based On Pattern Recognition Techniques and Using Neural Network, International Journal of Civil Engineering and Technology, 8(10), 2017, pp. 1396–1409. http://www.iaeme.com/IJCIET/issues.asp?JType=IJCIET&VType=8&IType=10
1. INTRODUCTION A main problem relating to brain patients is diagnosis. The conventional method in diagnosis is human observation that is highly prone to errors. Recognition of images and conditions is one of the most important human features that are the basis for further decisions, planning and, performance. Recognition is only possible when enough information and experience provided for http://www.iaeme.com/IJCIET/index.asp
1396
[email protected]
Proposing an Efficient Method For Categorizing Brain MRI Images Based On Pattern Recognition Techniques and Using Neural Network
human. With respect to the fact that high resolution and perfectly precise MRI images enable physicians to diagnose various illnesses and further, to make a decision regarding the diagnosed condition. Automatic categorization of MRI images can be useful in affairs relating to diagnosis of brain illnesses resulting in better diagnosis by hospitals, physicians and, medical research centers.
2. RESEARCH METHOD In the present study, we have tried to select the most effective features. Selecting features is equal to identifying and implementing the most important and effective feature among the other features. In addition to reduction of required inquiry space and improvement of the speed of various algorithms, doing so often results in improvement of the precision of diagnostic methods as well. After pre-processing, the feature extraction methods are implemented on the data and afterwards, the features and next, the most important features are identified. Finally, the categorization method will be enforced.
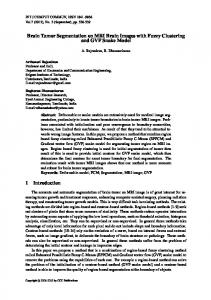
3. DATA The existing brain related data in the medical school of the University of Harvard. In order to implement the proposed method, first of all twenty brain MRI images have been downloaded for the former university's database. The images were available in the resolution of 256x256 [1]. Figure 1 is one of the brain MRI images downloaded from the previously mentioned database. Part (a) shows a healthy brain while the other parts show various anomalies diagnosed through MRI imagery. In case of presence of abnormality (illness), the type of the illness includes either of the Gliomas; Metastatic cancer; Metastatic bronchogenic carcinoma; Malignant tumor of transplantation; Alzheimer's disease; ... . Figure 1 shows various types of diseases.
Figure 1 Brain MRI images. a) Healthy. b) Gliomas; c) metastatic cancer; d) metastatic bronchogenic carcinoma; e) meningioma; f) malignant tumor of transplanted tissue; g) Alzheimer's disease; h) Huntington's disease; i) motor neuron disease; j) cerebroscopic calcinosis; k) Peak disease; l) Alzheimer's disease and lack of recognition of visual symptoms; m) MS; n) dementia; o) Encephalopathy; p) Encephalitis; q) Croutzfeld Jacob; and r) Brain toxoplasmosis
http://www.iaeme.com/IJCIET/index.asp
1397
[email protected]
Ghazal Davoudi and Seyyed Enayatollah Alavi
4. PREPROCESSING Real world data are impartial, incompatible and contain noises. Data refining methods try to fill in the missing values, mitigate the noises and reform incompatibilities. Preprocessing is carried out aiming to remove noises and obtain more desired results. In this research, the method incorporated for filling in the missing values is through benefiting from the average feature values in lost cellules. In other words, the means of the features that contain continuous values are selected. In case of discrete and categorical features, a different method will be used for filling in the missing values. In these cases, the missing values are filled with the values with the highest presence frequency. The replace missing values function in the software of RAPIDMINDER automatically fills the missing values. In the first phase, the primary data are loaded onto the software through the Read CSV function. The replace missing values function, as it was previously mentioned is responsible for filling in the missing values. Using the settings of this function, one can determine the manner of filling. For instance, the missing values can be filled with default values or, it can be filled with either the maximum or the minimum value corresponding to the same feature. Another method is to use the average value of the feature. In the present study, we have used the average value method.
5. FEATURE EXTRACTION Due to the high complexity of brain tissues, manual diagnosis of brain tissues and tumors is highly time-consuming while also highly depending on operating conditions. In addition, in this method there is a necessary need for presence of experts for diagnosis. In other words, in absence of experts, the conventional methods are inefficient. On this basis, automatic methods for diagnosis of brain conditions can be highly efficient in terms of precise diagnosis of tumors. Due to the high resolution and quality of MRI images, these images have received a lot of attention during the past few years. The images are usually received in either of the weighted sorts of T1 or T2. In terms of T2, images have more dense tissues and have a whitish color. This feature results in easier diagnosis of cancer tissues since due to growth of cancer cells, cellular density increases. Several efforts have been made in the context of automatic tumor diagnosis and various different results have been obtained as well. The phases of doing so are generally consisted of two categories including feature extraction and sample categorization. In general, first, the image features are extracted. These features usually include static features such as entropy; skewedness; average; energy; torque; correlation and etc. there are also some features that are obtained through running image processing algorithms. For the purpose of decision making, the data obtained in this phase are employed in sample categorization phase. In the context of feature extraction it can be referred to various methods including Wavelet transform [8, 9, 10 and 12], Fourier transform, Gabor filter, image blocking, histogram [14], use of the law of symmetry of the brain and static properties [11, 14, 15, and 16]. In addition, certain statistical methods are also used for determination of the probability of developing cancer [17]. In the context of categorization and separation of features different Artificial Intelligence methods can be used. These methods include the SVM (support vector machine), SOM and Fuzzy c-mean. In order to complete the project, first of all image features were extracted through image processing methods including histogram, wavelet transform and etc. afterwards, the suitable features are selected and the neural network categorization method is applied in the next phase.
http://www.iaeme.com/IJCIET/index.asp
1398
[email protected]
Proposing an Efficient Method For Categorizing Brain MRI Images Based On Pattern Recognition Techniques and Using Neural Network
6. FEATURE SELECTION In the present study, the relationship between features is used for evaluation of goodness of a set of features. In previous methods, the relationship between the features was ignored. This means that previous algorithms focused only on independent features. Still, one feature may not have a very bold relationship with data class; however when it is combined with other features it may show a solid relationship with data class. This method is referred to as the interact method. This algorithm is generally consisted of two phases. In the first phase, the features are ordered in a descending manner based on the used importance index. Afterwards, the entire features in the list are evaluated. Various phases of the Interact algorithm can be defined as follows: Phase 1: a symbol named as consistency share which indicates the amount of change in compatibility through removal of a feature. As the value of this symbol increases, the feature will be more important [6]. .
=
−
In the upper relation, =
∑ ! !"
(1)
is the function of extraction of a subset of features in D and: (2)
#
In order to define the inconsistency (incompatibility) count, the following are required to be introduced: Inconsistent sample: two data record in the data set of D with al values similar except for the names of classes. The inconsistent set named D has K number of records and T number of classes. The D set is divided into s1, s2, s3, …, st. in this regard we have: Si = {dj | dj has label ci}. Therefore the inconsistency count of the D set is defined as follows: inconsistencyCount D = / − max ||5 ||
(3) Phase 2: correlation between the Fi feature and the data class is calculated and the set of features is ordered in a descending manner based on amount of correlation. (4) 56
.
= 28
;
9
.: