ever, in the NJW algorithm, a normalization step is applied so that each row .... k-means algorithm [8] in our implementation, which takes approximately ...... turks,soviet,genocide,turkey,extermination,population,ottoman,mountain,roads. 15. 99.
An Efficient Spectral Algorithm for Network Community Discovery and Its Applications to Biological and Social Networks Jianhua Ruan and Weixiong Zhang Department of Computer Science and Engineering Washington University in St Loius One Brookings Dr, St Louis, MO 63130 {jruan,zhang}@cse.wustl.edu Abstract Automatic discovery of community structures in complex networks is a fundamental task in many disciplines, including social science, engineering, and biology. Recently, a quantitative measure called modularity (Q) has been proposed to effectively assess the quality of community structures. Several community discovery algorithms have since been developed based on the optimization of Q. However, this optimization problem is NP-hard, and the existing algorithms have a low accuracy or are computationally expensive. In this paper, we present an efficient spectral algorithm for modularity optimization. When tested on a large number of synthetic or real-world networks, and compared to the existing algorithms, our method is efficient and and has a high accuracy. We demonstrate our algorithm on three applications in biology, medicine, and social science. In the first application, we analyze the communities in a gene network, and show that genes in the same community usually have very similar functions, which enables us to predict functions for some new genes. Second, we apply the algorithm to group tumor samples based on gene expression microarray data. Remarkably, our algorithm can automatically detect different types of tumor without any prior knowledge, and by combining our results and clinical information, we can predict the outcomes of chemotherapies with a high accuracy. Finally, we analyze a social network of Usenet newsgroup users, and show that, without any semantic information, we can discover the organization of the newsgroups, and detect users groups with similar interests.
1 Introduction The study of complex networks has become a fast growing subject in many disciplines, including physics, biol-
ogy, and social science. At least part of the reason can be attributed to the discovery that real-world networks from totally different sources can share surprisingly high similarities in their topological properties, such as the powerlaw degree distributions and high clustering coefficients. (See [1, 20] for reviews.) One of the key properties in complex networks that have attracted a great deal of interest recently is the so-called community structures, i.e. relatively densely connected sub-networks [21]. Community structures have been found in social and biological networks, as well as technological networks such as the Internet and power grid. Automatically discovering such structures is fundamentally important for understanding the relationships between network structures and functions, and has many practical applications. For example, identifying communities from a collaboration network may reveal scientific activities as well as evolution and development of research areas [15]; detecting hidden communities on the World Wide Web may help prevent crime and terrorism [4]; discovering communities in a network of biomolecules may help us better understand the organizational principles of the cell, and identify important biological pathways for further studies [29, 34]. Community discovery is similar but not equivalent to the conventional graph partitioning problem, both of which are amount to clustering vertices into groups. A key challenge for the former, however, is that the algorithm has to decide what is the “best”, or in other words, the “most natural” partition of a network. In contrast, in conventional graph partitioning, the user has to provide information such as the number of partitions or the sizes of the sub-networks. Furthermore, a community discovery algorithm should not force a network to be partitioned if there is no good community structures, while it is always possible for a graph partitioning algorithm to return some arbitrary results. To design effective community discovery algorithms, Newman and Girvan [22] proposed a quantitative measure,
called modularity (Q), to assess the quality of community structures, and formulated community discovery as a optimization problem. Since optimizing Q is a NP-hard problem, several heuristic methods have been developed, as surveyed in [6]. The fastest algorithm available uses a greedy strategy and suffers from poor quality [5]. A more accurate method is based on simulated annealing, which requires a prohibitively long running time on large networks [14]. Several spectral algorithms have been developed, which have relatively good performance, but still inefficient for large networks [33, 21]. In this paper, we propose a spectral algorithm that is effective in finding high quality communities as well as efficient on large networks. The algorithm adopts a recursive strategy to partition networks while optimizing Q. Unlike the existing algorithms, our method is a hybrid of direct k-way partitioning and recursive 2-way partitioning strategies [33, 21]. We evaluate our algorithm on a large number of synthetic and real-world networks. The results show that the algorithm is more efficient and more accurate than a recursive 2-way partitioning method. Compared to a direct k-way partitioning method, our algorithm is much more efficient, while having a comparable accuracy. We demonstrate our algorithm on several real applications in different domains. First, we apply our algorithm to identify functional modules from a network of genes in the yeast S. cerevisiae, and predict functions for some genes based on the community structures. Second, we use the algorithm to classify tumor samples based on gene expression microarray data, which is a challenging and important task for effective therapy of cancer. Finally, we analyze the community structure in a social network of Usenet newsgroup users. We show that, by simply looking at the communication history among the users, our algorithm can identify groups of users sharing common interests, without any semantic information of the messages. The paper is organized as follows. In Section 2, we introduce some basic concepts, notations, and previous works. We describe our algorithm and its complexity in Section 3, and present some evaluation results in Section 4. Finally, we demonstrate our algorithm in several real applications in Section 5, and conclude in Section 6.
2 Preliminaries 2.1
Spectral graph partitioning
Let G = (V, E) be a network of n vertices in V and m edges in E. Let A = (Aij ) be the adjacency matrix of G. A graph partitioning problem is to find two or more vertex subsets of nearly equal sizes, while minimizing the number of edges cut by the partitioning [11]. Known to be NPhard, the problem exists in many real applications, such as
circuit design and load balancing in distributed computing. Many heuristic methods have been developed for the problem, among which spectral methods have received much attention and are the most popular. Spectral graph partitioning is in fact a family of methods. These methods depend on the eigenvectors of the Laplacian matrix or its relatives of a graph. Depending on the way they partition a graph, spectral methods can be classified into two classes. The first class uses the leading eigenvector of a graph Laplacian to bi-partition the graph. The second class of approaches computes a k-way partitioning of a graph using multiple eigenvectors. We briefly review some representatives of these two classes of algorithms below. P Let D be the diagonal degree matrix of A, i.e. Dii = j Aij . L = D−A is called the Laplacian matrix of G. Let λ1 ≤ λ2 ≤ · · · ≤ λn be the eigenvalues and µ1 , µ2 , · · · , µn be the corresponding eigenvectors for the generalized eigenvalue problem Lµ = λDµ. It can be shown that λ1 = 0, and µ1 = 1, a vector with all ones. Given the above notation, a representative of bipartitioning, the SM algorithm [26], works as follows. (1) Compute µ2 , the second smallest generalized eigenvector of L. (2) Conduct a linear search on µ2 to find a partition of the graph to minimize a normalized cut criterion [26]. It has been shown that when certain constraints are satisfied, the SM algorithm can reach the optima of normalized cuts [26]. To find more than two clusters, the SM algorithm can be applied recursively. The most popular algorithm in the second class, the NJW algorithm [23], finds a k-way partition of a network directly as follows, where k is given by the user. (1) Compute the k smallest generalized eigenvectors of L and stack them in columns to form a matrix Y = [µ1 , µ2 , · · · , µk ]. (2) Normalize each row of Y to have unit length. (3) Treat each row as a point in Rk , and apply standard k-means algorithm (or any other geometric clustering algorithm) to group them into k clusters. Note that the above algorithm is slightly different from but equivalent to the original NJW algorithm. The original algorithm computes the k largest eigenvectors of a normalized matrix N = D −1/2 AD−1/2 . It can be shown that, if λ and µ are solutions to Lµ = λDµ, 1 − λ and D 1/2 µ are precisely the eigenvalues and eigenvectors of N [32]. Therefore, D1/2 µi , i = 1, · · · , k, are the largest k eigenvectors of N . Since D is diagonal, Y obtained from N is the same as Y obtained from L, except that each row in the √ former is scaled by a factor of Dii . The scaling factor disappears after normalizing each row to have unit length. This small modification puts NJW in the same framework as the SM algorithm, and is numerically more stable, since no division of D is involved.
2.2
Modularity and community structures
Given a partition of a network, Γk , which divides its vertices into k communities, the modularity is defined as Pk Q(Γk ) = i=1 (eii /c − (ai /c)2 ), where eii is the number of edges with both vertices within community i, ai is the number of edges with one or both vertices in community i, and c is the total number of edges [22]. Therefore, the Q function measures the fraction of edges falling within communities, subtracted by what one would expect if the edges were randomly placed. A larger Q value means stronger community structures. If a partition gives no more withincommunity edges than would be expected by chance, the modularity Q ≤ 0. For a trivial partitioning with a single community, Q = 0. It has been observed that most realworld networks have Q > 0.3 [22]. The Q function provides a good quality measure to compare different community structures. Several algorithms have been developed to search for community structures by looking for the division of a network that optimizes Q (see [6] for a survey). White and Smyth proposed a spectral algorithm (WS), which is effective on small networks [33]. They show that, when the number of communities k is given, the optimization of Q is equivalent to an eigen decomposition problem, if relaxing the discrete membership constraint [33]. Therefore, they directly applied a k-way spectral graph partitioning algorithm for this purpose. To automatically determine the number of communities, the spectral algorithm is executed multiple times, with k ranging from the user defined minimum Kmin to maximum Kmax number of communities. The k that gives the highest Q value is deemed the most appropriate number of communities. A slightly modified version of the WS algorithm is as follows. (1) For each k, Kmin ≤ k ≤ Kmax , apply NJW to find a k-way partition, denoted as Γk . (2) k ∗ = arg maxk Q(Γk ) is the number of communities, and Γ∗ = Γk∗ is the best community structure. The key difference between the original WS algorithm [33] and the one above is the underlying spectral algorithm. The original algorithm uses the second to the k-th largest eigenvectors of a transition matrix P = D −1 A, and ignores the first eigenvector. It can be shown that the eigenvalues and eigenvectors of P are precisely 1 − λ and µ, where λ and µ are the solutions to the generalized eigenvalue problem Lµ = λDµ [32]. Therefore, the underlying spectral algorithm in the original WS algorithm is equivalent to NJW except that the first eigenvector. The authors ignored the first eigen vector since it is a constant, 1. However, in the NJW algorithm, a normalization step is applied so that each row of Y has unit length. After the normalization, the first column of Y is often not constant. We noticed that including the first column often gives higher Q values. Therefore, we use NJW as the underlying spectral
algorithm. While the WS algorithm is effective in finding good community structures, it scales poorly to large networks, because it needs to execute k-means up to Kmax times. Without any prior knowledge of a network, one may overestimate Kmax in order to reach the optimal Q. For sparse networks, Kmax can be linear in the number of vertices in the worst case, making it impractical to iterate over all possible k’s for large networks.
3 The Kcut algorithm In order to develop a method that scales well to large networks while retaining effectiveness in finding good communities, we may take the strategy used in the SM algorithm, i.e., to recursively divide a network into smaller ones. However, two issues remain. First, when should the algorithm halt, or in other words, how do we decide whether a (sub)network should be partitioned? Since our goal is to find a partition with a high modularity, we can test whether the Q value increases after the partition. If no partition can improve the modularity, the (sub)network should not be divided. Second, it has been empirically observed that if there are multiple communities, using multiple eigenvectors to directly compute a k-way partition is better than recursive bipartitioning methods [23]. Here, we propose an algorithm that is a unique combination of recursive partitioning and direct k-way methods, which will achieve the efficiency of a recursive approach, while also having the same accuracy as a direct k-way method. We follow a greedy strategy to recursively partition a network to optimize Q. Unlike the existing algorithms that always seek a bi-partition, we adopt a direct k-way partition strategy as in the WS algorithm. Briefly, we compute the best k-way partition with k = 2, 3, · · · , l using the NJW algorithm, and select the k that gives the highest Q value. Then for each subnetwork the algorithm is recursively applied. To reduce the computation cost, we restrict l to small integers. As we will shown in experiments, the algorithm with l as small as 3 or 4 can significantly improve modularity over the standard bi-partitioning strategy. Furthermore, the computation cost is also reduced with a slightly increased value of l compared to bi-partitioning. Given a network G and a small integer l that is the maximal number of partitions to be considered for each subnetwork, our algorithm Kcut executes the following steps. 1. Initialize Γ to be a single cluster with all vertices, and set Q = 0. 2. For each cluster P in Γ, (a) Let g be the subnetwork of G containing the vertices in P . (b) For each integer k from 2 to l,
i. Apply NJW to find a k-way partitioning of g, denoted by Γgk , ii. Compute new S Q value of the network as Q0k = Q(Γ Γgk \ P ).
The inner loop, step 2(b), is similar to the first step of the WS algorithm, except that in 2(b)(ii) we compute the modularity of the whole network G, which is different from the modularity Q(Γgk ). On the other hand, we do not need to iterate over all communities in the network to re-compute Q. From the definition of Q in Section 2.2, the contribution of each community towards Q is independent of the other communities. Therefore, after g is partitioned, Q can be efficiently updated with the communities that have just been created in g. At step 2(c), we decide the best way to partition g that can improve Q the most. This step turns out to be crucial in identifying globally good community structures with high Q values. At step 2(d), we test if partitioning g can contribute positively towards Q, and the partition is accepted only if Q increases. When the algorithm terminates, no communities can be further created to improve Q, thus Γ contains the best community structure.
to O(n3 ), since the maximal number of communities for a sparse network may be linear in n. The running time of Kcut depends on the depth of the recursive calls. In the worst case, the partitions can be highly imbalanced, and the depth of the recursion is merely the number of partitions produced, K. A more practical estimate, however, is the average depth, which is close to logl K, where l is the maximal number of partitions considered by NJW. Therefore, the running time taken by eigs can be estimated to be O((mlh + nl 2 h) logl K), which can be further simplified to O(mlh logl K), since l is small and therefore in general m > nl. Similarly, the average-case running time taken by k-means is O(nl 2 e logl K), and the total complexity is given by O((mlh + nl 2 e) logl K). Our experimental results show that for large networks and small values of l, the time taken by eigs dominates, giving an overall time complexity in O(mlh log l K) = O(mh ln K lnl l ) for Kcut. Therefore, assuming h is a constant, also given that l is small and K = O(n), the total complexity is O(m log n), which is much smaller than the O(n3 ) running time of the WS algorithm. An important observation from the analysis is that the total running time of Kcut is not a monotonically increasing function of l. Analytically, the minimum value of l/ ln l is achieved at l = 3. Empirically, we observed that Kcut is most efficient with l = 3 to 5 (see Section 4.2). The memory complexity of both algorithms is O(m), linear to the number of edges.
3.1
3.2
(c) Find the k that gives the best Q value, i.e., k ∗ = arg maxk Q0k . (d) If Q0k∗ > Q, accept theSpartition by replacing P with Γgk∗ , i.e., Γ = Γ Γgk∗ \ P , and set Q = Q0k∗ . (e) Advance to the next cluster in Γ, if there is any.
Computational complexity
We first review the computational complexity of the WS algorithm, since the inner loop of Kcut is simply the WS algorithm, except that the computation of Q is slightly different. The WS algorithm contains two major components: computing eigenvectors and executing k-means to partition the network. Note that although WS calls NJW multiple times, the eigen problem needs to be solved only once to obtain all Kmax eigenvectors. To compute eigenvectors, we used the eigs function in MATLAB, which has a time complexity in O(mKh + nK 2 h + K 3 h), where m and n are respectively the numbers of edges and vertices of the graph, K = Kmax is the number of eigenvectors to be computed, and h is the number of iterations for eigs to converge [33]. Since K < n, the running time of eigs can be simplified to O(mKh + nK 2 h). Second, we adopted a fast k-means algorithm [8] in our implementation, which takes approximately O(nKe) time, where e is the number of iterations for k-means to converge. Since k-means is called K times, the total running time is O(mKh + nK 2 h + nK 2 e), where the first two terms are for eigs and the last term is for k-means. Assuming e and h constants, the overall time complexity of WS is O(mK + nK 2 ), which can be close
Related methods
Besides our algorithm and the WS method, several other algorithms have also been developed for identifying communities by modularity optimization. Newman proposed an algorithm that is based on recursive spectral bi-partitioning [21]. The algorithm computes the leading eigenvector of a so-called modularity matrix, and divides the vertices into two groups according to the signs of the elements in the eigenvector. The algorithm runs recursively on each subnetwork, until no improvement to Q is possible. Compared to our method, this algorithm is faster for small networks, since no k-means is performed. On the other hand, the modularity matrix is very dense, with almost no zero entries. Therefore, the algorithm takes O(n2 ) memory even for sparse networks, in contrast to O(m) for our method. Furthermore, the algorithm takes O(n2 log n) running time, therefore, it does not scale well to large networks. Importantly, we will show that by combining k-way partitioning with a recursive method, Kcut usually achieves higher modularity than the Newman method. White and Smyth also proposed a fast greedy algorithm, spectral-2, in addition to their optimal WS algorithm [33]. Like the Newman method, spectral-2 is recursive and uses
spectral bi-partitioning to optimize Q. In this algorithm, all Kmax (a user provided parameter) leading eigenvectors of a transition matrix P (see section 2.2) are computed and used throughout the subsequent recursive partitions. For large networks, however, it is difficult to estimate the number of communities in advance, and expensive to compute a large number of eigenvectors. There are also several methods that are not spectralbased. The edge betweenness algorithm [12] and the extremal optimization algorithm [7] are known to be very slow, with O(n3 ) and O(n2 log2 n) running time, respectively. Another greedy approach, the CNM algorithm [5], has approximately the same time complexity (O(m log 2 n)) as our method, but the communities returned often have poor quality [21].
(a) 1 0.9
Jaccard Index
0.8
WS K−2 K−3 K−4 K−5 NM CNM
0.5
0.3 0.2
0
0.01
0.02
p_out
0.03
0.04
0.05
0.03
0.04
0.05
(b)
0.02 0 −0.02
Computer-generated networks
To evaluate Kcut, we first tested it on computergenerated networks with artificially embedded community structures. Each network had 256 vertices forming 8 communities of equal sizes. Edges were randomly placed with probability pin between vertices within the same community and with probability pout between vertices in different communities. We varied pin from 0.8 to 0.3, representing networks with dense to sparse communities. For each pin , in in we varied pout from 0 to p10 with an increment of p50 . For each pair of (pin , pout ), we generated 100 networks and clustered them with WS (Kmin = 2, Kmax = 15), Kcut (l = 2, 3, 4 and 5), and NM algorithms. To measure the accuracy of the results, we computed the Jaccard Index [30], which is roughly the percentage of within-community edges that were predicted correctly. The Jaccard Index between the true community structure (Γ) and predicted community structure (Γ0 ) is defined as |S(Γ) ∩ S(Γ0 )| , |S(Γ) ∪ S(Γ0 )|
(1)
where S(Γ) and S(Γ0 ) are the sets of within-community vertex pairs in Γ and Γ0 , respectively.
Relative Q
−0.04
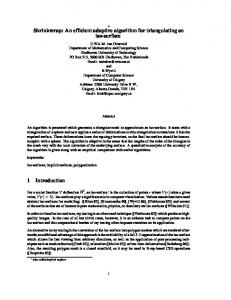
We now evaluate our algorithm on a variety of networks and compare it with three existing algorithms that were mentioned in Section 3.2: the WS algorithm, the CNM algorithm, and the Newman’s algorithm (NM). In what follows, the results of our algorithm are denoted by K-2, K-3, · · ·, for l = 2, 3, · · ·. Note that Newman suggested in [21] a refining step to improve Q after the initial partitioning. To make a fair comparison, this refining step was omitted in our study, since in theory the same strategy can be applied to any other algorithm as well.
J(Γ, Γ0 ) =
0.6
0.4
4 Evaluation
4.1
0.7
−0.06 −0.08 WS K−2 K−3 K−4 K−5 NM CNM
−0.1 −0.12 −0.14 −0.16
0
0.01
0.02
p_out
Figure 1. Results on computer-generated networks. Qrelative = Qdiscovered − Qtrue . Fig. 1(a) shows the Jaccard Index as a function of pout for pin = 0.5. Results for other values of pin or using other types of accuracy measurement are similar (data not shown). The WS algorithm, which explicitly searches over all k’s, has the best accuracy. On the other hand, Kcut with large l values can better approximate WS than with small l values. Moreover, as shown in Fig. 1(b), the Q values achieved by the algorithms match their accuracies: WS has the highest modularity, followed by K-5, K-4, ..., and the Newman algorithm at last. A third measure, the number of times an algorithm predicted k correctly, also shows that WS > K-5 > · · · > K-2 > NM (data not shown). The CNM algorithm has an accuracy similar to K-2 for smaller pout , but its accuracy drops significantly when pout increases.
4.2
Real-world networks
We further tested our method on several real-world networks. These include an acquaintance network in a Karate club [35], the opponent network of American NCAA Division I college football teams in the year 2000 [12], a coperforming network of Jazz Bands [13], a protein-protein interaction network of E. coli [25], the Autonomous Systems topology of the Internet [10], and a collaboration net-
Table 1. Q values for real-world networks. Q Network n m K ∗ Kmax WS K-2 K-3 K-4 K-5 NM CNM Best Karate 34 78 4 8 0.420 0.390 0.420 0.420 0.420 0.393 0.383 0.420 [33] Football 115 613 10 20 0.602 0.524 0.600 0.596 0.590 0.493 0.577 Jazz 198 5484 4 8 0.439 0.444 0.444 0.439 0.439 0.394 0.439 0.445 [7] PPI 1440 6223 133 200 0.362 0.332 0.344 0.348 0.364 0.341 0.337 Internet 3015 5156 52 100 0.604 0.594 0.600 0.601 0.601 0.524 0.620 Physicists 27519 60793 600 - 0.734 0.738 0.739 0.743 - 0.659 0.723 [21] Kmax : maximal number of communities for WS. K ∗ : number of communities returned by WS. The last column are the best Q values achieved by existing methods in the literature, and references to the methods.
Table 2. Total CPU time (seconds).
Network WS K-2 K-3 K-4 K-5 NM CNM* Karate 0.3 0.3 0.3 0.3 0.4 0.1 0.02 Football 1.1 0.7 0.6 0.7 1.1 0.3 0.04 Jazz 0.5 0.6 0.7 0.7 0.9 0.3 0.06 PPI 8k 40 26 31 23 58 0.8 Internet 3k 37 27 22 23 172 63 Physicists 6k 3k 2k 2k 283 *A significant difference between CNM and the other algorithms here is that CNM was implemented in C, while all the other algorithms compared here were implemented in MATLAB m-files.
work of physicists [19]. As shown in Table 1, the WS algorithm usually returns community structures with the highest Q value. Although Kcut with l = 2 often performed poorly, Kcut with l ≥ 3 can usually achieve Q values as good as that by WS, whereas with a much reduced running time. Moreover, for the three networks (Karate, Jazz, Physicists) that have been analyzed by others, Kcut can find modularity values that are comparable to or better than the best known ones. The NM algorithm (without the refining step) and the CNM algorithm usually have much worse accuracy comparing to WS and Kcut. The WS and Newman algorithms failed to finish on the physicist network, due to their excessive running time or memory usage. In addition, the communities returned by Kcut are often very close to the known communities if they are available. For example, for the Karate club network, Kcut precisely predicted the actual separation of the club caused by a dispute among its members [12]. For the football network, Kcut correctly revealed the official NCAA conference structure of the football teams [12], except for a few teams that do not belong to any conference. Because of space limit, we omit the detailed results here, and focus on networks of real applications, which will be shown in Section 5.
4.3
Running time
Table 2 shows the running time of the four algorithms on the six real-world networks. Table 3 shows the time spent on eigs and k-means by WS, Kcut and NM. CNM is based on a different rationale and does not have these two com-
ponents. As shown in Table 2, although WS is efficient for small networks of up to a few hundred of vertices, it is very inefficient on large networks. The Kcut algorithm, on the other hand, can handle networks of several thousand of vertices in less than half minute. It appears in Table 2 that CNM is the most efficient, especially for small networks. At least part of the reason is that CNM was implemented in the C language, while the other three algorithms were all implemented in MATLAB M-files. M-files are interpreted at run time, and therefore have higher overhead. Also observe that Kcut is often faster with l = 3, 4, 5 than with l = 2. Based on the analysis in Section 3.1, the time Kcut spent in eigs is approximately linear to l/ ln l, which reaches its minimum at l = 3. In contrast, the time Kcut spent on k-means is proportional to l 2 / ln l, which is monotonically increasing for l ≥ 2. The experimental results in Table 3 partially support the theoretical analysis. For large networks, the total running time of Kcut is dominated by eigs. Therefore, Kcut can take advantage of a slightly increased l to reduce its running time. When l becomes too large, however, the running time of both components increases, and the efficiency of Kcut may degrade.
5 Real applications Community discovery algorithms have a broad range of applications in many disciplines. Here, we demonstrate the utility of our algorithm on three real applications in biology, medicine, and social science, respectively.
5.1
Communities in a gene network
It is believed that biological systems are modular, consisting of groups of bio-molecules responsible for different functions, such as metabolism, reproduction, and signal transduction, etc. The relationships between bio-molecules have been mapped to several types of networks, including gene regulatory networks [18] and protein interaction networks [25]. Therefore, it is interesting to test whether these networks contain communities, and whether the community structure is related to the functional classification of
Table 3. CPU time (seconds) for program components.
Network WS K-2 K-3 K-4 K-5 NM Karate 0.08 0.16 0.16 0.11 0.1 0.11 0.1 0.2 0.08 0.22 0.11 Football 0.1 0.81 0.33 0.22 0.21 0.23 0.29 0.36 0.23 0.7 0.28 Jazz 0.11 0.29 0.26 0.06 0.31 0.23 0.25 0.3 0.25 0.5 0.25 PPI 14 7857 34 3 20 4 18 7 11 8 53 Internet 12 2892 31 3 19 5 14 6 11 9 150 Physicists - 5353 79 2451 109 1473 152 1473 170 For WS and Kcut, the first and second columns are the time taken by eigs and k-means, respectively. The last column is the time spent on eigs in the Newman algorithm.
Table 4. Enriched GO functional terms in communities.
Community size Most significant GO term f F p pHCL 1 460 ribosome biogenesis 32.8% 2.9% 1.90E-138 4.30E-120 2 159 nuclear mRNA splicing, via spliceosome 46.5% 1.4% 1.10E-105 4.20E-89 3 272 protein biosynthesis 62.9% 11.1% 9.80E-97 2.10E-65 4 334 transcription 40.4% 6.8% 8.80E-72 2.70E-17 5 172 response to DNA damage stimulus 41.9% 2.6% 9.30E-71 1.80E-31 6 449 secretory pathway 21.8% 2.9% 2.20E-62 1.00E-50 7 226 nucleocytoplasmic transport 23.9% 1.6% 5.60E-50 9.90E-34 8 346 cell cycle 29.5% 5.6% 4.80E-46 1.70E-57 9 118 nitrogen compound metabolism 39.8% 3.3% 2.70E-37 3.90E-18 10 172 proteolysis during cellular protein catabolism 23.3% 1.8% 3.90E-32 6.30E-20 11 90 oxidative phosphorylation 24.4% 0.6% 1.30E-28 5.00E-05 12 94 RNA 3’-end processing 17.0% 0.3% 1.50E-23 1.10E-09 13 9 pre-replicative complex formation and maintenance 77.8% 0.2% 1.70E-17 6.50E-08 14 14 protein amino acid N-linked glycosylation 64.3% 0.6% 1.30E-15 5.50E-14 15 205 protein targeting to mitochondrion 9.3% 0.7% 1.10E-14 4.20E-09 16 585 carbohydrate metabolism 10.1% 3.1% 3.90E-14 9.10E-06 17 8 histone methylation 75.0% 0.2% 1.40E-13 4.80E-05 18 18 mRNA catabolism 50.0% 0.8% 1.60E-13 8.30E-07 19 42 biological process unknown 73.8% 22.0% 9.40E-11 3.70E-09 20 6 chromatin assembly 100.0% 1.2% 1.30E-10 6.20E-12 f , F : percentage of genes in the community or genome associated with the GO term; p: p-value for the enrichment of a GO term in a community; pHCL : p-value for the enrichment of the same GO term in a gene clusters identified by hierarchical clustering [17].
the molecules. We applied the Kcut algorithm to study a network of ≈4500 genes in the yeast S. cerevisiae, obtained by integrating a number of heterogeneous biological data sources [17]. The vertices in the network are genes, and an edge between two genes indicates that they may be involved in some common biological process supported by literature or experimental evidence such as gene expression microarray or protein interaction data [17]. The network may contain errors, and the edges may have different meaning, depending on the data source from which they were derived. Applying Kcut, we obtained 47 communities, whose sizes range from 2 to 585. Our analysis below is focused on the 36 communities that contain more than five genes. To understand the functions of these communities, we checked the enrichment of Gene Ontology (GO) terms [31], which are a set of controlled vocabulary used to annotate genes functions, for the genes within each community. Enrichment is computed using hyper-geometric test [3]. Briefly, suppose that a community contains m genes, n of which are annotated by a function T, and that N out of M genes in the whole genome are annotated by T. the hyper-geometric test measures the probability that we would expect at least
n genes annotated by T if we had randomly drawn m genes from the genome. A low probability indicates that the community is significantly enriched with T. To account for multiple testing, we corrected the p-values using a Bonferroni procedure [3], and used p-value = 0.05 as a threshold for the significance test. All except one of the 36 communities contain significantly enriched GO terms. Overall, these communities contain 2123 enriched GO terms. In contrast, using a hierarchical clustering method, Lee et. al. obtained 55 clusters [17]. Among them, 32 clusters contributed to a total of 1746 significantly enriched GO terms, much fewer than that in Kcut. Figure 2 compares the p-values for the GO terms that are enriched in both Kcut and hierarchical clustering. As shown, most GO terms are more significantly enriched in Kcut than in hierarchical clustering, indicating the advantage of our methods against conventional graph clustering methods. Table 4 lists 20 communities that have the most significantly enriched GO terms. Many communities contain very significantly enriched GO terms. For example, about one third of the genes in community 1 have functions in ribosome biogenesis, an 11-fold enrichment that are unlikely due to chance (p < 2e-138). About 40% of genes in com-
−log10(p−value) in hierarchical clusters
200 180 160 140 120 100 80 60 40 20 0
0
50 100 150 −log10(p−value) in gene communities by Kcut
200
Figure 2. Comparison of GO enrichment munity 4 are related to transcription (p < 9e-72). In contrast, only 21% of genes in the corresponding hierarchical cluster are annotated by this term (p < 3e-17). Since genes in the same community often share functions, the community structure may be used to predict gene functions. For example, community 19 contains 42 genes. The most significant function category is “biological process unknown” (group A, 31 genes, p < 1e10). The second most significant GO term is “telomeraseindependent telomere maintenance” (group B, 5 genes, p < 1e-6). To test whether the 31 unknown genes are also related to telomere maintenance, we searched the Saccharomyces Genome Database (http://www. yeastgenome.org/) and other experimental data for more information about these genes. Using whole-genome ChIP-chip data [18], we found that all 5 group B genes are regulated by at least three of the following four transcription factors: YAP5, GAT3, MSN4, and PDR1. Interestingly, many of the 31 group B genes, but none of the other genes, are also regulated by the four transcription factors: 18 by YAP5 (p