Analysis) [3] is an open source data mining tool which ... comparison study of J48, MLP, NB, IBK, and SMO ..... mining and knowledge discovery software tools,.
International Journal of Computer Science and Information Security (IJCSIS), Vol. 14, No. 5, May 2016
An Empirical Evaluation of Data Mining Classification Algorithms Prof. Hetal Bhavsar 1, Dr. Amit Ganatra 2 Assistant Professor, Department of Computer Science and Engineering, The M. S. University of Baroda, Vadodara, Gujarat, India 1 Dean, Faculty of Technology and Engineering, CHARUSAT, Changa, Gujarat, India 2
mining, artificial intelligence, neural networks, genetic algorithm etc.
Abstract: Data Mining is the process of extracting interesting knowledge from large datasets by joining methods from statistics and artificial intelligence with database management. Classification is one of the main functionality in the field of data mining. Classification is the forms of data analysis that can be used to extract models describing important data classes The well known classification methods are Decision tree classification, Neuaral network classification, Naïve Bayes Classification, k-nearest neighbor classification and Support Vector Machine (SVM) classification. In this paper, we present the comparison of five classification algorithms, J48; which is based on C4.5 decision tree based learning, Multilayer perceptron (MLP); uses the multilayer feed forward neural network approach, Instance based K-nearest neighbour (IBK), Naive Bayse (NB), and Sequential Minimal Optimization (SMO); is an extension of support vector machine. Performance of these classification algorithms are compared with respect to classifier accuracy, error rates, building time of classifier and other statistical measures on WEKA tool. The result showed that there is no universal classification algorithm which works better for all the dataset.
Classification, one of the main functionality of data mining, can be described as supervised learning algorithm as it assigns class labels to data objects based on the relationship between the data items with a predefined class label. The classification techniques are used to learn a model from a set of training data and to classify a test data into one of the classes [1]. WEKA (Waikato Environment for Knowledge Analysis) [3] is an open source data mining tool which includes implementation of various classification algorithm like decision trees, Naïve Bayes, lazy learning, neural network, etc. To observe the performance of the different classification algorithm, this research has conducted a comparison study of J48, MLP, NB, IBK, and SMO algorithms using seven dataset available on UCI dataset repository [4]. The datasets considered for this research are: Breast Cancer, Diabetes, Vote, Car Evaluation, Spambase, Audiology, and Nursery.
Keywords: Classification, supervised learning, decision tree, naive bayse, support vector machine
The rest of the paper is organized as follows: Section 2 covers the related work in this area. Section 3 describes the classification method and its phases. Experimental results and evaluations are presented in section 4. Finally, section 5 gives the conclusion of research.
I. Introduction: The tremendous amount of information stored in databases and data repository cannot simply be analyzed manually for valuable decision making. Therefore, humans need assistance in their analysis capacity [2]. Such requirement has generated urgent need for automated tools that can assist us in transforming that vast amount of data into useful information and knowledge. Data mining involves the use of sophisticated data analysis tools to discover previously unknown, valid patterns and relationships in large data set. Data mining involves an integration of multiple fields including Statistical models, mathematical algorithm, information retrieval, databases, pattern recovery and machine learning methods. Data mining can be done with large number of algorithms and techniques which includes classification, clustering, regression, association
II. Related Work: The top 10 data mining classification algorithms: c4.5, k-Means, SVM, Apriori, EM, PageRank, AdaBoost, KNN, Naive Bayes and CART is described in [5] including their impact and new research issues. Study of a large number of techniques based on Artificial Intelligence, Perceptron-based techniques and Statistics shown that after better understanding of strength and weakness of each method, it is possible to integrate two or more algorithm together to solve a problem [6]. Despite the advantages, these ensemble methods have weaknesses like: increased storage, increased computation, and decreased comprehensibility. In [7],
142
https://sites.google.com/site/ijcsis/ ISSN 1947-5500
International Journal of Computer Science and Information Security (IJCSIS), Vol. 14, No. 5, May 2016
the comparison of different classification algorithms for hierarchical prediction for protein function based on the predictive accuracy of classifier is given. It was found that classification accuracy is increased by using different classifiers at different nodes in the classifier tree. The performance comparison of classification algorithm on breast cancer dataset to perform the diagnosis of the patient is presented in [8] [9] [10]. A comparison study of different data mining tools on several datasets with various classification methods is presented in [11], which concluded that WEKA toolkit has achieved the highest applicability and highest improvement in classification performance when moving from the percentage split test mode to the cross validation test mode compared to other tools. The comparison of various classification algorithms using WEKA on different dataset is given in [12] [13] [14]. The error rate of various classification algorithms were compared to bring out the best and effective algorithm suitable for social network data is covered in [15].
For this research, several data sets have been downloaded from the UCI repository [4] and details are shown in Table 1. Table 1: Dataset Description Dataset Name Breast Cancer Wisconsin Diabetes Vote Car Evaluation Spambase Audiology Nursery
The methodology of the study constituted of collecting datasets having different characteristics and selecting a set of classification algorithm to test the performance of classification algorithm on WEKA tool. For testing the accuracy of classifier k-fold cross validation and percentage split (also called Holdout method) mode are used. Figure 1. demonstrate the overall methodology followed for fulfilling the goal of this research.
IBKK
Integer
699
11
2
Integer Categorical
768 435
9 17
2 2
Categorical
1728
7
4
4601
58
2
226 12960
70 9
24 5
Integer, Real Categorical Categorical
C. Classification Algorithm 1. J48
SMO
J48 is an implementation of C4.5 in WEKA. C4.5 is one of the well known decision tree induction algorithm. The decision tree method is a supervised machine learning technique that builds a decision tree from a set of class labelled training samples during the machine learning process. Each internal node in a decision tree represents a test on attribute, each branch represents an outcome of the test and each leaf node represents the class label [1]. C4.5 is uses gain ratio for selection of attribute for splitting. It provides an improvement over ID3 as it deals with nominal and numerical attributes as well as able to handle missing and noisy data [16].
Testing Accuracy
k-fold CV
Number of Class
Classification is a two step process, 1. Learning step: classification algorithm built the classifier learning from the training set made up of database tuples and associated class label. 2. Testing step: model is used for testing data; the predicative accuracy of classifier is estimated using test set different from training set. The accuracy of the classification model is determined by comparing true class labels in the testing set with those assigned by the model [1].
Build Classification Model
NB
Number of Attributes
B. Building Classification Model
Collect dataset
MLP
Number of Instances
The data sets having different characteristics are chosen to evaluate the performance of classification algorithm. The dataset considered have addressed different areas, such as the number of instances varies from 200 to 13000, number of attributes ranges from 7 to 70 and the attribute type; where some datasets contain one type while other contains two types.
III. Methodology:
J48
Attribute Type
Holdout
Result Evaluation
Fig. 1 Study of Methodology
A. Dataset Description
143
https://sites.google.com/site/ijcsis/ ISSN 1947-5500
International Journal of Computer Science and Information Security (IJCSIS), Vol. 14, No. 5, May 2016
minimization principle and have the aim of determining the location of decision boundaries also known as hyperplane that produce the optimal separation of classes [1][6]. Support Vector Machine revolves around the notion of a “margin”—either side of a hyperplane that separates two data classes. Maximizing the margin and thereby creating the largest possible distance between the separating hyperplane and the instances on either side of it has been proven to reduce an upper bound on the expected generalisation error [17]. Further, application of SVM results in the global solution for a classification problem. SVM based classification is attractive, because its efficiency does not directly depend on the dimension of classified entities.
2. Multilayer Perceptron (MLP) MLP is a feed forward network that makes a model to map input data to output data. Neural network with back propagation algorithm performs learning on a multilayer feed-forward neural network [1]. A multilayer feed-forward network consists of large number of units (neurons) joined to gather in a pattern of connections. These units are: an input layer, one or more hidden layer and an output layer. The input layer, receives the information to be processed, the output layer, shows the result of processing and hidden layer, allow the signals to travel one way only, from input to output. They learn by iteratively processing a data set of training samples, comparing the network prediction for each sample with the actual target value [6] [16], where one iteration through the training set is called epoch. For experimental results the MLP is ran with two sets of epoch, 100 and 500.
D. Measures for Performance Evaluation The performance metrics used for comparison of different classification algorithm on various datasets are, prediction accuracy, correctly classified versus incorrectly classified instances, time to build the model, Kappa Statistic (KS), Mean Absolute Error (MAE), Root Mean Squared Error (RMSE).
3. Naïve Bayes Classification (NB) Naïve Bayes Classifier is the simple statistical Bayesian Classifier, which predicts the class membership probability, the probability that a given sample belongs to a particular class. It is called Naïve as it assumes that all variables contribute toward classification and are mutually correlated. This assumption is called class conditional independence [16]. This is an unrealistic assumption for most datasets; however it leads to a simple prediction framework that gives surprisingly good result in many practical cases. The Naïve Bayes Classifier is based on Bayes’ Theorem [1].
a. Classification accuracy: For assessing the classifier accuracy two well-known techniques were used: k-fold cross validation and percentage split [1]. In k-fold cross validation, data is split into k disjoint subsets (folds). Training and testing is performed k times. For each of this k experiment, k-1 folds are used for training and remaining one is used for testing. The error rate of the classifier is the average of the error rates of k experiments. In percentage split method, two-thirds of data are selected for training and one-third of data is selected for testing.
4. Instance Based Classifier (IBK)
The objective of using these two techniques to measure the accuracy, is to check whether there is an improvement in the accuracy measure when moving from the one test mode to other test mode.
IBK is an implementation of K-nearest neighbor classification algorithm in WEKA. Instance based classifiers are also called lazy learners as they store all of the training samples and do not build a classifier until a new, unlabeled sample needs to be classified [1][6]. The k-nearest neighbors’ algorithm is amongst the simplest of all machine learning algorithms. It is based on the principal that the samples that are similar are lies in close proximity. Given an unlabeled sample, K-nearest neighbor classifier searches the pattern space for the k-objects that are closest to it and assigned the class by identifying the most frequent class label. If the value of k=1 then assign the class of the training sample that is the closest to the unknown sample in the pattern space [16]. For experimental results, size of k is taken to be as 5.
b. Kappa Statistic (KS): It is a chance corrected measure of agreement between the classification and the true classes. It is calculated by taking the agreement expected by chance away from the observed agreement and dividing by the maximum possible agreement. The possible values range from +1(perfect agreement) via 0 (no agreement above that expected by chance) to -1 (complete disagreement). c. Mean Absolute Error (MAE): It is a quantity used to measure how close predictions are to the eventual outcome. It is an average of loss function over the test dataset where the loss function measures the error between actual and the predicted values.
5. Sequential Minimal Optimization (SMO) SMO (Sequential Minimal Optimization) is an extension of support vector machine. SVM are based on statistical learning theory and structural risk
d. Root Mean Squared Error (RMSE): The presence of outliers is exaggerated by mean squared error, not
144
https://sites.google.com/site/ijcsis/ ISSN 1947-5500
International Journal of Computer Science and Information Security (IJCSIS), Vol. 14, No. 5, May 2016
by MAE. RMSE is a square root of mean squared error, measures the average magnitude of the error.
Table 3. Result for Breast Cancer dataset using Percentage split
IV. Experimental results and evaluation This research presents a comparative study of various data mining classification algorithms based on various essential parameters including types of database used, number and types of attribute supported, time to build the classifier, number of correctly classified versus number of incorrectly classified instances, accuracy and other statistical measures.
Algorithm
Accuracy (%)
Error rate (%)
Time (sec)
KS
MAE
RMSE
J48
95.3782
4.6218
0.08
0.9006
0.0671
0.2124
NB
94.958
5.042
0.03
0.8913
0.048
0.2141
KNN
95.3782
4.6218
0
0.8996
0.052
0.1896
94.5378
5.4622
0.17
0.8814
0.0576
0.1856
95.3782
4.6218
1.42
0.9001
0.0524
0.1956
95.3782
4.6218
0.09
0.8996
0.0462
0.215
MLP (epoch=100) MLP (epoch=500) SMO
The data set used for experimental evaluation is in ARFF format. The simulation results are taken by running WEKA tool on Intel core i5-2430M CPU@ 2.4GHz with 4GB of RAM Machine.
Since the breast cancer dataset has 699 instances, 461 instances are used to build the model and 238 instances are used for testing the accuracy of percentage split mode. Table 3, shows that all the algorithm performs well with average accuracy of 95%. The kappa statistics for J48 is closer to 1, indicates that J48 provides the perfect agreement for classification of data items. From Table 2 and Table 3 it is also seen that, for breast cancer dataset moving from 10_fold_cv mode to percentage split mode, accuracy of model is reduced.
1. Breast Cancer Dataset Breast Cancer dataset classifies the patient’s breast cancer as begnin or malignant. The results for breast cancer dataset using WEKA in 10-fold cross validation and percentage split mode are shown in Table 2 and Table 3. From the Table 2, it is clearly seen that the highest accuracy is 96.99% for SMO and the lowest accuracy is 94.56% for J48. This shows that, for breast cancer dataset SMO algorithm performs best followed by MLP for epoch 100 and KNN. The KNN required least time to build the model followed by NB and SMO. Table 2 also shows that increasing the number of epoch from 100 to 500 for MLP, increase the time for building the model as well as reduce the accuracy of prediction.
2. Diabetes Dataset The result for diabetes dataset is shown in Table 4 and Table 5. For diabetes dataset also SMO outperforms compared to other classification algorithm with the correctly classified instances 594 with accuracy of 77.34%. Though the time required to build the model for KNN is lowest, it suffers from the lowest predication accuracy. The SMO has the lowest mean absolute error and highest root mean square error (less variance).
The Kappa Statistics for SMO is much closer to 1 (i.e. 0.9337) which indicates that SMO provides the perfect agreement for classification of data items. SMO has lesser error rate in MAE and RMSE as it provides the more perfect prediction and lesser variance in predictions.
Table 4. Result for Diabetes dataset using 10_fold_cv
Table 2. Result for Breast Cancer dataset using 10_fold_cv Algorithm
Accuracy (%)
Error rate (%)
Time (sec)
KS
MAE
RMSE
J48
94.5637
5.4363
0.06
0.8799
0.0694
0.2229
NB
95.9943
4.0057
0.03
0.9127
0.0408
0.1994
KNN
96.7096
3.2904
0
0.9275
0.0457
0.1579
96.7096
3.2904
0.17
0.9274
0.0548
0.1709
95.279
4.721
0.81
0.8958
0.0501
0.197
96.9957
3.0043
0.08
0.9337
0.03
0.1733
MLP (epoch=100) MLP (epoch=500) SMO
Algorithm
Accuracy (%)
Error rate (%)
Time (sec)
KS
MAE
RMSE
J48
73.8281
26.1719
0.13
0.4164
0.3158
0.4463
NB
76.3021
23.6979
0.03
0.4664
0.2841
0.4168
KNN
73.1771
26.8229
0
0.3874
0.3165
0.4318
76.3021
23.6979
0.17
0.4674
0.3034
0.4061
75.3906
24.6094
0.87
0.4484
0.2955
0.4215
77.3438
22.6563
0.11
0.4682
0.2266
0.476
MLP (epoch=100) MLP (epoch=500) SMO
145
https://sites.google.com/site/ijcsis/ ISSN 1947-5500
International Journal of Computer Science and Information Security (IJCSIS), Vol. 14, No. 5, May 2016
Table 5. Result for Diabetes dataset using Percentage Split
Table 7. Result for Vote dataset using Percentage Split
Algorithm
Accuracy (%)
Error rate (%)
Time (sec)
KS
MAE
RMSE
Algorithm
Accuracy (%)
Error rate (%)
Time (sec)
KS
MAE
RMSE
J48
76.2452
23.754
0.05
0.434
0.312
0.4059
J48
97.2973
2.7027
0.03
0.9447
0.0608
0.1539
NB
77.0115
22.988
0
0.463
0.266
0.3822
NB
91.2162
8.7838
0.02
0.8232
0.0912
0.2858
KNN
75.0958
24.904
0
0.400
0.310
0.4211
KNN
92.5676
7.4324
0
0.8497
0.0845
0.2173
79.3103
20.689
0.16
0.523
0.311
0.3887
97.973
2.027
0.2
0.9585
0.0292
0.1242
74.3295
25.670
0.78
0.431
0.318
0.4445
98.6486
1.3514
0.87
0.9724
0.0222
0.1134
79.3103
20.689
0.03
0.490
0.206
0.4549
96.6216
3.3784
0.03
0.9311
0.0338
0.1838
MLP (epoch=100) MLP (epoch=500) SMO
MLP (epoch=100) MLP (epoch=500) SMO
Since the diabetes dataset has 768 instances, 507 instances are used for training and 261 instances are used for testing, in percentage split. Table 5, show that SMO and MLP (epoch=100) has highest prediction accuracy followed by NB and J48. KNN has the lowest prediction accuracy. Kappa statistics is higher for MLP than SMO, means MLP (epoch=100) provide more perfection of classification compared to SMO.
Since the vote dataset has 768 instances, 287 instances are used for training and 148 instances are used for testing, in percentage split mode. Table 7, show that MLP has highest prediction accuracy followed by J48 and SMO. NB has the lowest prediction accuracy. Though MLP (epoch=500) provides highest prediction accuracy, the time required to build the model is largest compared to other algorithms, and at the same time MLP(epoch =100) provides slightly less accuracy with model building time of 0.2 seconds. MLP has lesser error rate in MAE and RMSE as it provides the more perfect prediction and lesser variance in predictions.
Results from Table 4 and Table 5 shows that, moving from 10_fold_cv to percentage spit method for diabetes dataset improves the accuracy of classification algorithm.
3. Vote Dataset Table 6 shows that for vote dataset J48 and SMO provides promising result of classification with accuracy of 96% followed by MLP with accuracy of 94%. Though the time required building the model for KNN and NB is less compared to other algorithms, they suffers from the lower predication accuracy. The J48 has the highest kappa statistics, closest to perfect agreement and lesser root mean square error.
Results from Table 6 and Table 7 shows that, moving from 10_fold_cv to percentage spit method for vote dataset improves the accuracy of classification algorithm.
4. Car Dataset Table 8 shows that for car dataset MLP provides promising result of classification with accuracy of 99% followed SMO and KNN. Though the time required to build the model with NB is very less compared MLP, it suffers from the lowest predication accuracy. MLP(epoch =100) provides slightly less accuracy compared to MLP(epoch=500) with model building time of 1.64 seconds. The MLP provides more perfect prediction and lesser variance in prediction.
Table 6. Result for Vote dataset using 10_fold_cv
Algorithm
Accuracy (%)
Error rate (%)
Time (sec)
KS
MAE
RMSE
J48
96.3218
3.6782
0.06
0.9224
0.0611
0.1748
NB
90.1149
9.8851
0.02
0.7949
0.0995
0.2977
KNN MLP (epoch=100) MLP (epoch=500) SMO
92.6437
7.3563
0
0.8475
0.0841
0.2259
94.9425
5.0575
0.25
0.8933
0.0561
0.1087
94.7126
5.2874
1.01
0.8888
0.0528
0.2078
96.092
3.908
0.09
0.9178
0.0391
0.1977
Table 8. Result for Car dataset using 10_fold_cv Time (sec)
92.3611
7.6389
0.05
0.8343
0.0421
0.1718
85.5324
14.4676
0.02
0.6665
0.1137
0.2262
93.5185
6.4815
0
0.853
0.1122
0.1953
99.3634
0.6366
1.64
0.9861
0.0115
0.0548
99.537
0.463
7.6
0.9899
0.0062
0.0456
93.75
6.25
0.52
0.8649
0.2559
0.3202
Accuracy (%)
J48 NB KNN MLP (epoch=100) MLP (epoch=500) SMO
146
Error rate (%)
Algorithm
KS
MAE
RMSE
https://sites.google.com/site/ijcsis/ ISSN 1947-5500
International Journal of Computer Science and Information Security (IJCSIS), Vol. 14, No. 5, May 2016
Table 11. Result for Spam dataset using percentage split
Table 9. Result for Car dataset using percentage split
Algorithm
Accuracy
Error rate (%)
Time (sec)
KS
MAE
RMSE
Algorithm
Accuracy (%)
Error rate (%)
Time (sec)
KS
MAE
RMSE
J48
90.9864
9.0136
0.05
0.8088
0.0509
0.1883
J48
92.1995
7.8005
0.62
0.835
0.102
0.2686
NB
87.585
12.415
0
0.719
0.1145
0.2248
NB
78.0051
21.994
0.11
0.572
0.220
0.4676
KNN
KNN MLP (epoch=100) MLP (epoch=500) SMO
90.6463
9.3537
0
0.7821
0.1152
0.2041
98.9796
1.0204
1.23
0.9776
0.0156
0.0639
99.1497
0.8503
6.16
0.9814
0.0091
0.0582
93.3673
6.6327
0.23
0.8573
0.2561
0.321
MLP (epoch=100) MLP (epoch=500) SMO
89.2583
10.741
0
0.774
0.155
0.2869
87.8517
12.148
13.63
0.735
0.145
0.3019
87.5959
12.404
68.34
0.728
0.139
0.3011
90.5371
9.4629
0.22
0.797
0.094
0.3076
For the spam dataset, 3037 instances are used for training and 1564 instances are used for testing, in percentage split mode. Table 7, show that J48 has highest prediction accuracy followed by SMO and KNN. NB has the lowest prediction accuracy. The kappa statistics for J48 is highest indicating perfect agreement for classification.
Since the car dataset has 768 instances, 1140 instances are used for training and 588 instances are used for testing, in percentage split. Table 9, show that for car dataset it gives similar result as with that of 10_fold_cv. MLP has highest prediction accuracy followed by SMO. Results from Table 8 and Table 9 shows that, moving from 10_fold_cv to percentage spit method for car dataset reduces the accuracy of classification algorithm.
Results from Table 10 and Table 11 shows that, moving from 10_fold_cv to percentage spit method for vote dataset improves the accuracy of classification algorithm.
5. Spam Dataset 6. Table 10 shows that for spam dataset J48 provides highest prediction accuracy followed by MLP (epoch=500), SMO and KNN. The KNN required least time to build the model followed by NB and SMO. Table 10 also shows that increasing the number of epoch from 100 to 500, increase model building time from nine times, with only 2% of increase in accuracy. J48 has lesser error rate in mean absolute error and root mean squared error as it provides the more perfect prediction and lesser variance in prediction.
Audiology Dataset
Table 12 shows that, for audiology dataset MLP(epoch=500) provides highest prediction accuracy followed by SMO and MLP (epoch=100). The MLP provides more perfect prediction and lesser variance in prediction. The KNN and NB required least time to build the model but they suffer from the lowest classification accuracy. Table 10 also shows that increasing the number of epoch from 100 to 500, increase model building time, seven times with that of epoch =100, with only 3% of increase in accuracy.
Table 10. Result for Spam dataset using 10_fold_cv Algorithm
Accuracy (%)
Error rate (%)
Time (sec)
KS
MAE
RMSE
J48
92.9798
7.0202
1.46
0.8528
0.0892
0.2562
NB
79.2871
20.7129
0.17
0.5965
0.2066
0.4527
Algorithm
Accuracy (%)
Error rate (%)
Time (sec)
KS
KNN
90.4151
9.5849
0
0.7983
0.1355
0.2778
J48
77.8761
22.1239
0.02
NB
73.4513
26.5487
0
KNN
62.8319
37.1681
80.0885
MLP (epoch=100) MLP (epoch=500) SMO
89.4371
10.5629
18.1
0.7787
0.137
0.2846
91.4366
8.5634
156.8
0.8205
0.108
0.2631
90.4151
9.5849
0.62
0.7959
0.0958
Table 12. Result for Audiology dataset using 10_fold_cv
MLP (epoch=100) MLP (epoch=500)
0.3096
SMO
147
MAE
RMSE
0.7418
0.022
0.1201
0.6821
0.0263
0.1362
0
0.5539
0.038
0.1441
19.9115
4.74
0.7661
0.0252
0.1094
83.1858
16.8142
27.38
0.8028
0.0177
0.1026
81.8584
18.1416
1.3
0.7872
0.0767
0.1934
https://sites.google.com/site/ijcsis/ ISSN 1947-5500
International Journal of Computer Science and Information Security (IJCSIS), Vol. 14, No. 5, May 2016
Table 13. Result for Audiology dataset using percentage split
Table 15. Result for Nursery dataset using percentage split
Algorithm
Accuracy (%)
Error rate (%)
Time (sec)
KS
MAE
RMSE
J48
83.1169
16.8831
0.05
0.8033
0.0212
0.1155
NB
71.4286
28.5714
0.02
0.6572
0.0284
0.1399
KNN
58.4416
41.5584
0
0.4935
0.0398
0.1408
83.1169
16.8831
2.62
0.8012
0.0261
0.1029
MLP (epoch=100) MLP (epoch=500) SMO
Algorithm
Accuracy (%)
Error rate (%)
Time (sec)
KS
MAE
RMSE
J48
96.4821
3.5179
0.14
0.9483
0.0186
0.1055
NB
90.6718
9.3282
0.03
0.8618
0.077
0.1766
KNN
84.4156
15.5844
13.43
0.8167
0.0178
0.0994
NA
NA
NA
NA
NA
NA
MLP (epoch=100) MLP (epoch=500) SMO
Since the audiology dataset has 226 instances, 149 instances are used for training and 77 instances are used for testing, in percentage split. Table 13, show that for audiology dataset percentage split it gives similar result as with that of 10_fold_cv.MLP has highest prediction accuracy followed by J48. SMO algorithm does not run with percentage split mode, as it terminated with shortage of memory.
0.9636
0.0854
0.1512
0.962
0.007
0.0521
97.4353
2.5647
79.84
0.962
0.006
0.0514
92.828
7.172
16.8
0.8947
0.2429
0.3207
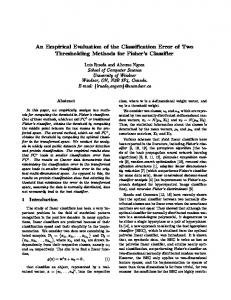
V. Observations Figure 2 and Figure 3 show the accuracy of different classification algorithms on various datasets with 10_fold_cv method and percentage split method, respectively. The following are the observations:
Table 14 shows that, for Nursery dataset MLP provides highest prediction accuracy followed by KNN and J48. The KNN and NB required least time to build the model followed by J48 and MLP (epoch=100). MLP has lesser error rate in mean absolute error and root mean squared error as it provides the more perfect prediction and lesser variance in prediction.
•
Table 14. Result for Nursery dataset using 10_fold_cv
•
Algorithm
Accuracy (%)
Error rate (%)
J48
97.0525
2.9475
0.22
0.9568
0.0153
0.0951
NB
90.3241
9.6759
0.02
0.8567
0.0765
0.1767
KNN
98.3796
1.6204
0.02
0.9761
0.0859
0.1466
99.7377
0.2623
15.91
0.9962
0.0024
0.0194
99.7299
0.2701
97.58
0.996
0.0014
0.0183
93.0787
6.9213
16.27
0.8985
0.2428
0.3202
SMO
0 15.88
Results from Table 14 and Table 15 shows that, moving from 10_fold_cv to percentage spit method for nursery dataset reduces the accuracy of classification algorithm.
Nursery Dataset
MLP (epoch=100) MLP (epoch=500)
2.4739 2.5647
Table 15, show that KNN has highest prediction accuracy followed by MLP and J48. NB and SMO have the lowest prediction accuracy. Time to build the model for KNN is least, while with MLP is highest. KNN has the highest value for Kappa statistics indication perfect agreement for classification and lesser error rate in MAE and RMSE as it provides lesser variance in predictions.
Results from Table 12 and Table 13 shows that, moving from 10_fold_cv to percentage spit method for audiology dataset improves the accuracy of J48 and MLP and reduced the accuracy of NB and KNN classification algorithm. 7.
97.5261 97.4353
Time (sec)
KS
MAE
RMSE
•
• •
Since the nursery dataset has 12960 instances, 8554 instances are used for training and 4406 instances are used for testing, in percentage split.
148
It has been observed that, k_fold_cv gives better accuracy performance for binary classification and percentage split mode gives better accuracy performance for multi classification. For breast cancer, diabetes, vote and spambase dataset which has two classes, SMO has highest correctly classified instances compared to other classification algorithms. For car, audiology and nursery dataset MLP provides highest prediction accuracy compared to SMO and J48, where the number of classes are more than two. MLP classifiers require more time to build the required model. The performance of KNN is worst for Audiology dataset, as it has 70 attributes and 24 classes. The KNN required least time to build the model for every dataset, but it suffers from having less prediction accuracy.
https://sites.google.com/site/ijcsis/ ISSN 1947-5500
International Journal of Computer Science and Information Security (IJCSIS), Vol. 14, No. 5, May 2016
120 100 80 60 40 20 0
J48 BN KNN MLP (epoch=100) MLP (epoch=500) SMO
Figure 2. Accuracy of classification algorithms on various dataset using 10-fold-cv 120 100 80
J48
60
NB
40
KNN
20
MLP (epoch=100)
0
MLP (epoch=500) SMO
Figure 3. Accuracy of classification algorithms on various dataset using percentage split
•
References:
The performance of NB is lowest for Vote, Car, Spambase and Nursery dataset, where dataset are either categorical or real.
[1] J. Han and M. Kamber, Data Mining Concepts and Techniques, Elevier, 2011.
VI Conclusion [2] M. Goebel,L. Gruenwald, A survey of data mining and knowledge discovery software tools, ACM SIGKDD Explorations Newsletter. Vol.1 No. 1, pp.20-33, June 1999 [doi>10.1145/846170.846172].
This research conducted performance comparison of five classification algorithms including decision tree, Naïve Bayes, Instance based nearest neighbour, Multilayer perceptron and Support Vector Machine on seven data sets with different characteristics in WEKA. The overall assessment showed that there is no single classification algorithm which can provide the best predictive model for all datasets. The accuracy of predictive model is affected by the selection of attributes, type of dataset, number of classes, attributes and instances. With this we conclude that the different classification algorithms are designed to perform better for different datasets.
[3] “WEKA – Data Mining Machine Learning Software”, http://www.cs.waikato.ac.nz/ml/ [4]UCI Machine Learning Repository, Available at:http://archieve.ics.uci.edu/ml/ [5] XindongWu, Vipin Kumar, J. Ross Quinlan,Joydeep Ghosh, Qiang Yang, Hiroshi Motoda, Geoffrey J. McLachlan, Angus Ng, Bing Liu, Philip S. Yu, Zhi-Hua Zhou, Michael Steinbach, David J. Hand, Dan Steinberg, “Top 10
149
https://sites.google.com/site/ijcsis/ ISSN 1947-5500
International Journal of Computer Science and Information Security (IJCSIS), Vol. 14, No. 5, May 2016
[12] Bharat Deshmukh, Ajay Patil, B. V. Pawar, “ Comparisoin of Classification Algorithms using WEKA on various Datasets, International Journal of Computer Science and Information Technology, Vol. 4, No. 2, December 2011, pp 85-90.
algorithms in data mining,” Knowledge Information system, vol. 14, pp. 1-37, 2008. [6] S. B. Kotsiantis, “Supervised Machine Learning: A Riview of Classification Techniques,” Informatica, vol. 31, pp. 249-268, 2007. [7] Secker, Andrew, et al. "An experimental comparison of classification algorithms for hierarchical prediction of protein function." Expert Update (Magazine of the British Computer Society's Specialist Group on AI) 9.3 (2007): 1722.
[13] Peiman Mamani Barnaghi, Vahid Alizadeh Sahzabi and Azuraliza Abu Bakar, “A Comparative Study for Various Methods of Classification”, International Conference on Information and Computer Networks (ICICN 2012), Vol. 27, IACSIT press, Singapore.
[8] Ryan Potter, “ Comparison of Classification Algorithms Applied to Breast Cancer Diagnosis and Prognosis”, Wiley Expert Systems, 24(1), 1731, (2007).
[14] Rohit Arora, Suman , “ Comparative Analysis of Classification Algorithms on Different Datasets using WEKA”, International Journal of Computer Applications (0975-8887), Vol. 54, No. 13, Sept.2012.
[9] Dr. Varun Kumar, Dr. Luxmi Verma, “ Binary Classifiers for Health Care Databases: A Comparative Study of Data Mining Classification Algorithms in the Diagnosis of Breast Cancer”, IJSCT, Vol. 1, Issue 2, December 2010.
[15] P. Nancy, Dr. R. Geetha Ramani, “ A Comparison on Performance of Data Mining Algorithms in Classification of Social Network Data”, International Journal of Computer Applications (0975-8887) Vol. 32, No. 8, October 2011.
[10] Mohd Fauzi bin Othman, Thomas Moh Shan Yau, “ Comparison of Different Classification Techniques Using WEKA for Breast Cancer”, IFMBE proceedings 15, pp. 520-523, 2007, springer-Verlag Berlin Heidelberg.
[16] Hetal Bhavsar, Amit Ganatra, “A Comparative Study of Training Algorithms for Supervised Machine Learning”, International Journal of Soft Computing and Engineering (IJSCE) ISSN: 22312307, Volume-2, Issue-4, September 2012.
[11] A. H. Wahbeh, Q. A. Al-Rasaideh, M. N. AlKabi, and E. M. Al-Shawakfa, “ A Comparison Study between Data Mining Tools over some Classification Methods”, International Journal of Advanced Computer Science and Applications, Special Issue on Artificial Intelligence.
[17] Vapnik, Corinna Cortes and Vladimir, “Support Vector Network,” Machine Learning, vol. 20, pp. 273-297, 1995.
150
https://sites.google.com/site/ijcsis/ ISSN 1947-5500