ward ticking auction clock. While most research on sequential auctions restricts attention to the sale of a single indivisible unit per round, we consider a more ...
An Empirical Model for Multi-Unit Sequential Dutch Auctions: the Dutch Flower Auctions Case Yixin Lu, Wolfgang Ketter, Jan van Dalen, Alok Gupta*, Eric van Heck Rotterdam School of Management, Netherlands
*Carlson School of Management, United States
Abstract We develop an empirical model for multi-unit sequential Dutch auctions where multiple units of identical products are auctioned in sequential rounds by means of a fast-paced downward ticking auction clock. While most research on sequential auctions restricts attention to the sale of a single indivisible unit per round, we consider a more general case where potential bidders can acquire multiple units in each round. Using a large dataset from a Business-toBusiness (B2B) auction market, we identify the key factors that influence the price and quantity changes in the winning bids as the sequential auction proceeds. These findings provide useful implications for auctioneers to optimize the auction parameters (e.g., starting price) and to realize higher throughput and revenue.
1
Introduction
The proliferation of online auctions has sparked tremendous interest in auctions not only as a selling mechanism, but also as an area of academic research. In the past decades, Information Systems (IS) researchers have made significant contributions to auction research by examining issues such as characterization of bidder behaviors (Bapna et al., 2004), empirical investigation of factors affecting the results of online auctions (Kauffman and Wood, 2006), and creation of test beds for exploring bidder strategies that cannot be explored analytically (Adomavicius et al., 2009). However, most of these studies have focused predominantly on Business-to-Consumer (B2C) auctions; little attention has been paid to Business-to-Business (B2B) auctions which involve much larger stakes and require more expertise in the bidding process. This research focuses on the expert bidding in the Dutch flower auctions (DFA), a complex B2B auction environment. The DFA are multi-unit sequential Dutch auctions. They are implemented using a fast-paced downward ticking auction clock. As the price falls, each bidder can bid by pressing a button indicating the quantity (which must exceed the minimum quantity set by the auctioneer) he is willing to accept at the current price (which must exceed the seller’s reserve price). The first bidder who makes a bid wins. If the winning bidder does not select the entire remaining quantity, the clock restarts at a high price and the auction reruns. Drawing on the prior work of Van den Berg et al. (2001), we develop an empirical model for the winning bids in the sequential rounds of the DFA. Different from most existing studies (e.g., McAfee and Vincent (1997) and Donald et al. (2006)) on sequential auctions, we are dealing with multi-unit demand of bidders in each round of an auction. Note that most structural properties of sequential auctions will vanish when the single-unit demand is no longer valid. Therefore, our research contributes to the empirical literature on sequential auctions by generating insights into the dynamics of winning bids in a more general setting. The DFA plays a vital role in the global flower trade (Kambil and Van Heck, 1998); they serve as efficient centers for price discovery and the exchange of flower products between suppliers
and buyers. However, due to the limited availability of proprietary data, few empirical studies have examined the design and bidding issues of the DFA. This research is among the very first to investigate the market dynamics in the DFA using a large real-world dataset. Our findings provide useful implications for auctioneers in the DFA to optimize the auction process and realize higher throughput and revenue.
2
Data
We used the transaction data of a particular type of large roses, Dolomites (Flower ID: 103668) for the period of June 1 to September 30, 2010, at one of the major DFA auction sites. We chose this specific flower type because its supply and demand were relatively stable during the given time period. Further, since our main interest is examining the sequential aspects of the winning prices and quantities, we created a subsample where the flowers on sale were as homogeneous as possible. For example, we considered flowers of length 70cm and 80cm in blooming stage 3 and with bundling size 10. To control the reputation effect among growers of the same type of flower, we restricted attention to the transaction of flowers supplied by a single grower (ID: 5644). As a result, we were left with 4350 transactions based on 382 lots, meaning on average, each lot was auctioned in 11 transactions. This feature of the data made it particularly suitable for the analysis of price and quantity dynamics in sequential rounds. Table 1 provides a stylized representation of the dataset. In this example, a lot containing 18 units was sold in 4 rounds. The auctioneer set varying minimum purchase units. Interestingly, bidders’ responses to the auctioneer’s choice of parameter setting led to: (i) sales prices that were not monotonically decreasing or increasing; (ii) a division of the lot of flowers into several sublots of unequal sizes; and (iii) a single bidder buying different sized sublots at different prices. Table 1: A sample entry in a logbook. The auctioneer’s decision variables are italicized. Transaction Seller Index ID 171 172 173 174
3
5644 5644 5644 5644
Stems Per Flower Stem ID Length Unit 103668 103668 103668 103668
70 70 70 70
50 50 50 50
Minimum Available Purchase Units Units 18 16 11 4
2 3 4 4
Starting Price Buyer (c) ID 100 41 39 40
439 395 439 563
Purchase Price Units (c) 2 5 7 4
22 20 21 20
Model Specification
In this section, we will describe the empirical model for the multi-unit sequential Dutch auctions. Consider an auction lot consisting of L units. The number of rounds N it takes to reach the end of the auction varies from a minimum of one, when all units are sold via a single transaction, to a theoretical maximum of L, when only one unit is sold in each transaction. The observed number of rounds, N = n 1 , is an outcome of the auction process and thus depends on the bidding dynamics of the auction. Within each lot, the auction clock starts at a price S1 set by the auctioneer, and ticks down until one bidder stops the clock. At that moment, both the winning price b1 and the purchase units q1 are settled. If the lot is not exhausted, the auction proceeds to the next round with a new 1
We distinguish random variables and their realizations by using upper- and lower-case letters respectively.
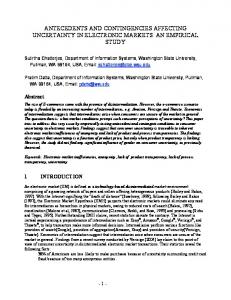
starting price, which is equal to the previous winning price plus an increment c 2 . In other words, we have Si = Bi−1 + c for i = 2, . . . , n. Winning price Bi is always between the starting price and the pre-determined reserve price bR , i.e., bR ≤ Bi ≤ Si . The number of units sold in each round, Qi , varies from zero (when price drops below bR ) to the total number of available units at the beginning of the round, Li . Hence the available units in each round are equal to the initial lot size ∑i−1 minus the sum of units sold in previous rounds, Li = L − j=1 Qj = Li−1 − Qi−1 , i = 2, . . . , n; L1 = L. Further, at the beginning of each round, the auctioneer determines the minimum purchase units mi , 1 ≤ mi ≤ Li . As a result, mi ≤ Qi ≤ Li , given that the price is above the reserve price. However, sometimes in the last round, we have mi ≥ Qi because the remaining units are less than the minimum purchase units. Figure 1 provides an overview of the distribution of the purchase units in the given data. We can see that most bidders only bought the minimum required units, which leads to the enormous amount of zeros in the right hand graph of Figure 1. Besides, the distribution is highly dispersed.
Distribution of Extra Purchase Units
0
0
500
1000
Frequency
400 200
Frequency
1500
600
2000
Distribution of Purchase Units
0
5
10 Purchase Units
15
20
0
5
10
15
20
Purchase Units − Minimum Purchase Units
Figure 1: Purchase units of Dolomites roses in the DFA (June 1-September 30, 2010): The left graph shows the distribution of absolute amount of purchase units. The right graph shows the distribution of extra amount of purchase units, i.e., purchase units - minimum purchase units. Based on these observations, a natural candidate for modeling the extra purchase units in each round is the Hurdle distribution with probability density function as follows: { fzero (0; x, γ) if y = 0, fhurdle (y; x, β, γ) = (1 − fzero (0; x, γ)) · fcount (y; x, β)/(1 − fcount (0; x, β)) if y > 0. The Hurdle model is very useful in dealing with overdispersion and accommodating extra zeros in the data (Winkelmann, 2008). It combines a count data component fcount (y; x, β) (left-truncated at y = 1) and a zero hurdle component fzero (y; x, γ) (right-censored at y = 1). In our case, y stands for the extra purchase units, i.e., Qi − mi , and x denotes the vector of potential regressors, for example, available units Si . The model parameters β, γ are estimated by Maximum Likelihood (ML), where the specification of the likelihood function has the advantage that the count 2
Currently, a fixed increment of 19 ticks is used throughout all the auction halls for an entire year.
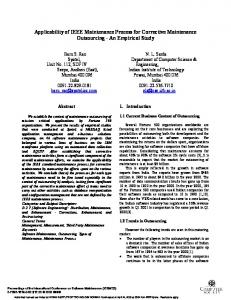
component and the zero hurdle component can be maximized separately. The corresponding mean regression relationship is given by: log(µyi ) = xTi β + log(1 − fzero (0; xi , γ)) − log(1 − fcount (0; xi , β)), where µyi is, in our case, the mean of Qi − mi , i = 1, . . . , n. The next step is to decide on the model for winning prices in sequential rounds. Drawing on the previous studies on sequential Dutch auctions, we distinguished the winning price between the first and subsequent rounds. Besides, two facts need to be taken into account when selecting the model: (i) the distribution of winning prices is defined on a two-sided closed domain [bR , Si ] for each round i; and (ii) there is a strong linear dependence relation between the current and previous round winning prices, see the right hand graph in Figure 2.
Correlation of Winning Price in Consecutive Rounds
80 60 40
Winning Price in the Previous Round
200 150
Frequency
100
0
50 0
20
250
300
100
Distribution of Winning Price
0
20
40
60 Winning Price
80
100
0
20
40
60
80
100
Winning Price in the Current Round
Figure 2: Winning prices of Dolomites roses in the DFA (June 1-September 30, 2010): The graph on the left shows a histogram of the distribution of winning prices. The graph on the right shows the correlation of winning prices in consecutive rounds. Given these considerations, we decided to use the truncated normal distribution for modeling both the first and subsequent round winning prices, i.e., Bi ∼ N (µi , σi |bR ≤ bi ≤ Si ). However, the regressors used for the first and subsequent rounds might be different. In addition, to account for the linear dependence relation between the current and previous round winning prices, we imposed the condition that µi = ω0,i + ω1,i bi−1 (i = 2, . . . , N ), i.e., the mean of the winning price in the current round is conditional on the winning price in the previous round. Similar as before, we used ML to estimate the model parameters.
4
Results and Discussion
We fitted the above models to the auction data introduced in Section 2. For the extra purchase units, two effects are significant (p-value < 0.01): available units in each round (Si , i = 1, . . . , n) and stem length. The former has a positive effect on the non-zero count component and a negative effect on the zero hurdle component, meaning the more units are available at the beginning of
a sub-auction, the more buyers are likely to bid on quantities that exceed the required minimum quantity. The stem length, on the other hand, has a negative effect on both the non-zero and zero component. This means that as the stem length increases, buyers tend to buy less units and it is less likely the absolute purchase quantity will be equal to the required minimum quantity. At first sight, this may seem surprising. Intuitively, we would expect that the less units buyers tend to bid on, the higher the possibility that the absolute purchase units are equal to the required minimum purchase units. However, since the two components in the Hurdle model, fcount and fzero , are independent, this is not necessarily the case. For the auctioneers, such relationship between stem length and extra purchase units suggests that they could achieve higher throughput (selling more units in sub-auctions) by increasing the minimum purchase units appropriately when auctioning long-stem roses. Next, we examined the factors that influence the winning prices in the sequential auctions. As has been outlined before, we distinguished the winning prices in the first and subsequent rounds. Based on the ML estimates, three factors are significant (p-value < 0.01) in influencing the first round winning price: available units (S1 ), minimum purchase units (m1 ), and the day of the week. The first two factors have negative effects on the winning price, which is quite reasonable from an economic perspective. Given a specific demand level, a higher supply (higher value of S1 ) leads to less competition among the bidders and thus results in lower winning prices. Meanwhile, a higher value of m1 also leads to less competition by raising the barrier for participation: small retailers and florists in general have very limited demand and are unlikely to bid on large units. As for the weekday effect, it turns out that winning prices on Mondays are significantly higher than those on the other days. To control for the potential unobserved determinants that influence all realized prices within a sequential auction, we chose not to fit the winning prices per se in subsequent rounds, but the price difference between the current and previous round. Based on the fitting results, two factors are significant ((p-value < 0.001)) in determining the price difference bi+1 − bi : available units Si and the price change momentum bi − bi−1 , i = 2, . . . , n. Both have negative effects, meaning that: (i) the price decline trend is weaker as the number of units that remain available decreases; (ii) a high price increase momentum (i.e., bi > bi−1 ) leads to a strong price decline in the current round. At the outset, our results contradict the existing literature on declining price anomaly. For example, Van den Berg et al. (2001) have shown that in the sequential Dutch auctions of a particular type of Dutch roses, the price decline is stronger if the number of units that remain available is smaller. Note that the auction lots used in our analysis are significantly larger (average lot-size: 158) than those used in Van den Berg et al. (2001) (average lot-size: < 11), and we observed much longer price paths (11 rounds vs. 3 rounds). It is likely that bidders adopt different strategies when switching from the small-lot auctions to the large-lot ones, and thus the resulting price paths exhibit quite different patterns. Nevertheless, the negative effects of available units and the price change momentum provide a sound explanation for the observed decreasing volatility of winning prices in sequential rounds of an auction. In addition, the negative correlation between available units and the price decline suggests that as the auction proceeds, auctioneers should decrease the increment (see Section 3) to speed up the sub-auctions and achieve higher throughput. Further, since all the transactions at the DFA must be finished by approximately 10:00am every weekday, speeding up each auction by a couple of seconds means we can push more products to the market and thus generate higher total revenue at the end of the day.
5
Conclusion
Using a large real-world dataset, we develop an empirical model for the multi-unit sequential Dutch auctions in a complex, time-critical environment. We identify the key factors that influence the price and quantity dynamics in sequential rounds. To the best of our knowledge, this is the first study that examines both price and quantity dynamics in sequential auctions where bidders have multi-unit demand in each round. Further, our research offers valuable insights into auctioneers’ decision-making processes in the DFA. The auctioneers in the DFA represent the growers. As such, their main objective is to realize high revenue. Since flowers are perishable goods, it is crucial to achieve high throughput. The auctioneers can influence the dynamics of the auction by adjusting the key parameters (i.e., starting price, reserve price, minimum purchase units, and clock speed). However, currently these parameters are not optimized. Given the time pressure, the auctioneers cannot adequately process all the market information to make informed decisions. Instead, they rely on their experience and use their intuition to decide how to set the starting price and reserve price, the minimum purchase units, and when to adjust the speed of the clock. Thus our empirical results serve as a useful starting point for auctioneers to optimize the auction parameters and achieve higher throughput and revenue. In future work, we will conduct in-depth analysis of these key auction parameters through extensive lab experiments and simulation, taking into account various characteristics of bidder behavior and the complex market dynamics.
References Adomavicius, G., A. Gupta, and D. Zhdanov (2009). Designing intelligent software agents for auctions with limited information feedback. Information Systems Research 20, 507–526. Bapna, R., P. Goes, A. Gupta, and Y. Jin (2004). User heterogeneity and its impact on electronic auction market design: An empirical exploration. MIS Quarterly 28(1), 21–43. Donald, S. G., H. J. Paarsch, and J. Robert (2006). An empirical model of the multi-unit, sequential, clock auction. Journal of Applied Econometrics 21(8), 1221–1247. Kambil, A. and E. Van Heck (1998). Reengineering the Dutch flower auctions: A framework for analyzing exchange organizations. Information Systems Research 9(1), 1–19. Kauffman, R. J. and C. A. Wood (2006). Doing their bidding: An empirical examination of factors that affect a buyer’s utility in internet auctions. Information Technology and Management 7(3), 171–190. McAfee, R. and D. Vincent (1997). Sequentially optimal auctions. Games and Economic Behavior 18(2), 246–276. Van den Berg, G. J., J. Van Ours, and M. Pradhan (2001). The declining price anomaly in dutch dutch rose auctions. The American Economic Review 91(4), 1055–1062. Winkelmann, R. (2008). Econometric Analysis of Count Data (5 ed.). Springer.