An Empirical Study of User Preference and Performance with UML Diagrams. Carol Britton, Maria Kutar, Sue Anthony, Trevor Barker, Sarah Beecham and Vitoria Wilkinson Department of Computer Science University of Hertfordshire, College Lane Hatfield AL10 9AB, UK Email: c.britton,
[email protected]
Abstract Elicitation and validation of user requirements depend, to a large extent, on the effectiveness of the tools and techniques used as a vehicle for discussion between developers and users during the requirements process. This effectiveness may, in turn, be influenced by user preference for a particular approach or requirements technique. This paper describes a study that was carried out to investigate the relationship between user preference for sequence or collaboration diagrams in UML, with their accuracy in understanding information contained in the diagrams. Results showed that user preference for one of the two diagram types before carrying out the task was not reflected in improved performance with that type of diagram compared with the other. However, after carrying out the task, user statements about which type of diagram they preferred working with were matched by improved performance with that type of diagram
1. Introduction. During requirements elicitation and validation, representations of the problem and the proposed solution are produced by developers and used as vehicles for discussion with users, to ensure that there is a shared understanding and agreement about the users’ needs and wishes regarding the system. For the purposes of elicitation and of validation, it is essential that all those involved, including users who may be untrained in the use of languages used in software development, have access to a representation that they can readily understand. It is important that the representations used during development are easy to understand so that untrained users are not forced to put effort into deciphering them, rather than concentrating on their content. The increasing number of tools and techniques designed to support the processes of requirements
elicitation and validation mean that it is often very difficult for a system developer to choose the technique that will be most effective in a particular context. One factor that may have a strong influence on the success of the requirements process is the user's preference for a particular type of technique. Intuitively, one would expect that tools and techniques that users prefer will help them to perform their job better. As Petre [1] points out “The importance of sheer likeability should not be underestimated; it can be a compelling motivator.” This intuition is, generally, supported by research, which has shown that overall, if users prefer one way of solving a problem to another, they will perform better with the technique that they prefer (see for example [2]). In the study described here, we measured users' accuracy in understanding information represented by two types of diagram that are widely used in requirements elicitation and validation. We asked participants in the study which of the two types of diagram they preferred, both before and after carrying out the task. Our expectations were that a strong preference for one type of diagram over the other would be reflected in greater accuracy in understanding the information represented by that type of diagram.
2. Links Between Preference and Performance. In recent years, studies involving subjective preference and objective performance have been carried out on different aspects and different types of software system, including websites [3] [4], moving-map systems [5], expert advisory systems [6], and graph layout algorithms [7]. A further paper by Purchase et al. on variations of UML class diagrams [8] found that, where participants felt less at ease with a notation, they appeared to be more diligent in working with it, resulting in better performance. In general, however, the findings of recent research seem to be in accord with those of a meta-survey
Proceedings of the IEEE 2002 Symposia on Human Centric Computing Languages and Environments (HCC’02) 0-7695-1644-0/02 $17.00 © 2002 IEEE
by Nielsen and Levy [2] that there is a strong positive association between subjective user preference and objective performance.
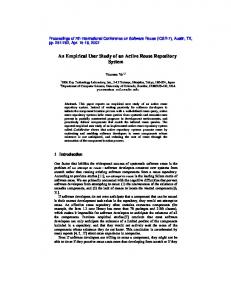
The same scenario is shown in figure 2 below, represented as a collaboration diagram. 1: request email messages 3: password
3. The Study The purpose of the study described in this paper was to investigate whether user preference for UML sequence or collaboration diagrams is reflected in improved accuracy in understanding the information contained in the preferred type of diagram. It was expected that subjective user preference would be reflected in objectively measured performance. Each of the 124 participants in the study was a first year undergraduate in Computer Science from either the University of Hertfordshire or Anglia Polytechnic University. The experience of the students ranged between having no previous experience with either diagram, to having a little experience of both diagram types. None of the participants claimed to be an expert with either type of diagram. The study was carried out using a questionnaire, which was answered anonymously by the participants. The questionnaires showed six scenarios, each represented by a sequence diagram or a collaboration diagram. Each diagram had five multiple-choice questions relating to the information contained in it; these questions were to be answered by the participants after studying the diagram. For each question participants were asked to select from true / false / can’t tell. Participants were also asked to state which of the diagram types they thought they would prefer to work with before answering the questions, and which they actually found easier to work with after answering the questions. An extract from the questionnaire showing an example sequence diagram can be seen in figure 1 below.
PC
User
Central computer
request email messages
password? password email request & password
check password
messages
PC 7: messages 2: password?
User
6: messages
4: email request & Password
5: check password
Central computer
Figure 2: Using a lift – Collaboration Diagram
4. Results Table 1 shows the mean score obtained by participants in the test for questions relating to each diagram type and pre-test and post-test preference for the diagrams. Only those participants who expressed a preference for diagram type are included. Condition
Mean score for Sequence (SD)
Mean score for collaboration (SD)
Preferred sequence diagram (Pre-test) Preferred collaboration diagram (Pre-test) Preferred sequence diagram (Post-test) Preferred collaboration diagram (Post-test)
3.23 (0.88)
3.08 (0.89)
3.07 (1.05)
3.44 (0.84)
3.31 (0.86)
3.14 (0.88)
2.24 (0.75)
3.21 (0.98)
Table 1: Mean number of correct responses and pre-test/post-test preferences for sequence and collaboration diagrams (N=78)
messages
Figure 1: Using a lift – Sequence Diagram
In order to relate pre-test and post-test preference for diagram type to the scores obtained, point bi-serial correlations were performed on the data presented in table one. The results of this analysis are shown in table 2 below.
Proceedings of the IEEE 2002 Symposia on Human Centric Computing Languages and Environments (HCC’02) 0-7695-1644-0/02 $17.00 © 2002 IEEE
Condition
Preference for diagram type before carrying out the task versus score for sequence Preference for diagram type before carrying out the task versus score for collaboration Preference for diagram type after carrying out the task versus score for sequence Preference for diagram type after carrying out the task versus score for collaboration
CorrCoe f R
DF.
Prob. P
0.15
77
P>0.05
-0.16
77
P>0.05
0.40
77`
P