An Empirical Validation of Four Different Measures to Quantify User Interface Characteristics Based on a General Descriptive Concept for Interaction Points Matthias Rauterberg
Work and Organisational Psychology Unit Swiss Federal Institute of Technology (ETH) Nelkenstrasse 11, CH–8092 Zuerich Tel: +41-1-6327082, Email:
[email protected] tude of the user ("questionnaires" and "interviews"). (3) The product-oriented view: usability quality is measured in terms of the ergonomic attributes of the product itself (quantitative measures). (4) The formal view: usability is formalised and simulated in terms of mental models (formal concepts). Karat [8] describes formal methods in the context of "theory-based" evaluation.
Abstract The main problems of standards (e.g., ISO 9241) in the context of usability of software quality are, that they can not measure all relevant product features in a task independent way. We present a new approach to measure user interface quality in a quantitative way. First, we developed a concept to describe user interfaces on a granularity level, that is detailed enough to preserve important interface characteristics, and is general enough to cover most of known interface types. We distinguish between different types of 'interaction points'. With these kinds of interaction points we can describe several types of interfaces (CUI: command, menu, form-fill-in; GUI: desktop, direct manipulation, multimedia, etc.). We carried out two different comparative usability studies to validate our quantitative measures. The results of one other published comparative usability study can be predicted. Results of six different interfaces are presented and discussed. One of the most important result is that the dialog flexibility must exceed a threshold of 15--measured with two of our metrics--to increase significantly the usability.
The interactive qualities of user interfaces currently are quantified in the context of interaction-oriented view and user-oriented view, but these both approaches are time consuming and more or less expensive [7].
2. A descriptive concept of interaction points We present a new approach to measure user interface quality in a quantitative way. First, we developed a concept to describe user interfaces on a granularity level, that is detailed enough to preserve important interface characteristics, and is general enough to cover most of known interface types (command language, CUI, GUI, multimedia, etc.). Different types of user interfaces can be quantified and distinguished by the general concept of "interaction points". Regarding to the interactive semantic of "interaction points" (IPs), different types of IPs must be discriminated (see also [3]).
1. Introduction The main problems of standards (e.g., DIN 66234, ISO 9241) to quantify software quality of usability are, that they can not measure all relevant product features in a task independent way [9]. To measure interactive qualities four different views on human computer interaction currently exists (see also [1], p. 651; [15]).
An interactive system can be distinguished in a dialog and an application manager. So, we distinguish between dialog objects (DO, e.g. "window") and application objects (AO, e.g. "text document"), and dialog functions (DF, e.g. "open window") and application functions (AF, e.g. "insert section mark"). Each function f ∈ FS, that changes the state of an application object, is an application function. All other functions are dialog functions (e.g., window operations like move, resize, close). The complete set
(1) The interaction-oriented view: usability quality is measured in terms of how the user interacts with the product ("usability testing"). This view is the most common one. All kinds of usability testing with "real" users are subsumed in this category [6]. (2) The user-oriented view: usability quality is measured in terms of the mental effort and atti435 0-8186-7355-9/96 $05.00 © 1996 IEEE
of all description terms is defined in Figure 1 and Table 1.
then the system changes from one DC to another. All dialog objects (functions, resp.) in the actual DC are either perceptible (PO, PF) or hidden (HO, HF). Four different mapping functions relate perceptible structures to hidden objects or functions.
A dialog context (DC) is defined by all available objects and functions in the actual system state. If in the actual DC the set of available functions changes,
interaction space IS
object space OS
perceptual objects PO
POs of the dialog manager PDO
µ
POs of the application manager PAO
function space FS
hidden objects HO
HOs of the dialog manager HDO
perceptual functions PF
HOs of the application manager HAO
PFs of the dialog manager PDF
ν
δ
set of all possible object representations RO
PFs of the application manager PAF
hidden functions HF
HFs of the dialog manager HDF
HFs of the application manager HAF
α
set of all possible function representations RF
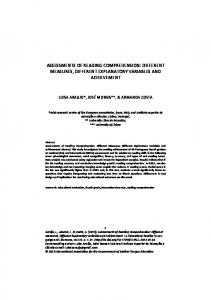
Figure 1. The interactive space (IS) consists of the object space (OS) and the function space (FS); OS and FS can be distinguished in perceptual and hidden objects and interaction points (IPs); each IP corresponds to an implemented function.
Table 1. The interactive space (IS) consists of the object space (OS) and the function space (FS); FS can be distinguished in perceptible and hidden interactive functions (PF and HF). IS := OS x FS [interaction space] DC ∈ IS [dialog context] OS := PO ∪ HO [object space] FS := PF ∪ HF [function space] PO := PDO ∪ PAO [(perceptible) representations of objects] HO := HDO ∪ HAO [hidden objects] PF := PDFIP ∪ PAFIP [(perceptible) representations of functions] HF := HDFIP ∪ HAFIP [hidden functions] PDFIP := {(df,pf) ∈ HDFIP x PF: pf = δ(df)} [(perceptible) represented DFIP] PAFIP := {(af,pf) ∈ HAFIP x PF: pf = α(af)} [(perceptible) represented AFIP] IP := DFIP ∪ AFIP [interaction points] DFIP := PDFIP ∪ HDFIP [IPs of dialog functions] AFIP := PAFIP ∪ HAFIP [IPs of application functions] δ := mapping function of a df ∈ HDFIP to an appropriate pf ∈ PF. α := mapping function of an af ∈ HAFIP to an appropriate pf ∈ PF. PDO := {(do,po) ∈ HDO x PO: po = µ(do)} [(perceptible) represented DO] PAO := {(ao,po) ∈ HAO x PO: po = ν(ao)} [(perceptible) represented AO] µ := mapping function of a dialog object do ∈ DO to an appropriate po ∈ PO. ν := mapping function of an application object ao ∈ AO to an appropriate po ∈ PO.
436
Each interaction point (IP) is related to at least one interactive function. If both mapping function's δ and α are of the type 1:m(any), then the user interface is a command interface. If both mapping function's δ and α are of the type 1:1, then the user interface is a menu or direct manipulative interface where each f ∈ FS is related to a perceptible structure PF (see Figure 3). The perceptual structure (visible, audible, or tactile) of a function (PF) can be, e.g., an icon, earcon, menu option, command prompt, or other mouse sensitive areas.
(e.g. "flatten" the menu tree; see [11]) and by allocating an appropriate PDFIP to the remaining HDFIPs.
DC: dialog context (1.level)
i/o interface
PAFIP: the perceptible representation of a HAFIP: hidden HAFIP functional interaction point of the application manager
representation space of the dialog and application objects (PDO + PAO)
The intersection of PF and PO is sometimes not empty: PF ∩ PO ≠ ∅. In the context of graphical interfaces icons are elements of this intersection, e.g., PDFIP "copy" ≡ PDO "clipboard", PAFIP "delete" ≡ PAO "trash". Each interaction point (IP) is related to at least one interactive function (see Figure 2).
a.function-1 a.function-2 a.function-3 a.function-4 a.function-5
PDFIP: the perceptible representation of a HDFIP HDFIP: hidden functional interaction point of the dialog manager
One important difference between a menu and a direct manipulative interface can be the "interactive directness". A user interface is 100% interactively direct, if the user has fully access in the actual dialog context to all f ∈ FS [10]. Good interface design is characterised by optimising the multitude of DFIPs
1
actual DC (2.level)
a.function-6
application d.f1
d.f2
d.f3
d.f4
dialog manager
Figure 2. A schematic presentation of the I/O interface, the dialog and the application manager of an interactive system with a menu tree of two levels.
[.........1.........2.........3.........4.........5.........6..].. the normal view on a text document MsWORD 4.0
PAFIP PAO
DC
TEXT.DOC COMMAND: Copy Delete Format Gallery Help Insert Jump Library Options Print Quit Replace Search Transfer Undo Window Edit document or press Esc to use menu Pg1 Ro1 Co1 {} ? Microsoft Word
PDFIP PAFIP PDO
Figure 3. An actual dialog context (DC) of the text processing program MsWord with the representation space of the interactive object (PAO: text document; PDO: clipboard), and the representation space (PF: marked by circles) of the interactive functions (PAFIP: text entry point, undo; PDFIP: menu options).
436
100% has only one DC with path lengths of one dialog step. We abbreviate the number of all different dialog paths with P.
3. Quantitative measures of user interface characteristics To estimate the amount of "feedback" of an interface a ratio is calculated: "number of PFs" (#PF = #PDFIP + #PAFIP) divided by the "number of HFs" (#HF = #HDFIP + #HAFIP) per dialog context. This ratio quantifies the average "amount of functional feedback" of the function space (FB; see Formula 1). We abbreviate the number of all different dialog contexts with D. A GUI has often a very large number of DCs. To handle this problem we take only all task related DCs into account. Doing this, our measures will give us only a lower estimation for GUIs.
To quantify the flexibility of the application manager we calculate the average number of HAFIPs per dialog context (DFA; see Formula 3). To quantify the flexibility of the dialog manager we calculate the average number of HDFIPs per dialog context (DFD; see Formula 4). A modeless dialog state has maximal flexibility (e.g., "command" interfaces, or Oberon [17]). Let us apply the five measures to our example in Figure 2. The average amount of functional feedback is: FB = 100% * (4/4 + 6/8) / 2 = 87.5% The average amount of interactive directness is: ID HAFIP = 100% * ((2*1 + 5*2) / 7)-1 = 58.3% ID HDFIP = 100% * ((2*1 + 3*2) / 5)-1 = 62.5% The average amount of flexibility is: DFA = (2 + 5) / 2 = 3.5 and DFD = (2 + 3) / 2 = 2.5 To interpret the results of our measures appropriately, we need empirical studies.
The average length (lng) of all possible sequences of interactive operations (PATH) from the top level dialog context (DC, e.g., 'start context') down to DCs with the desired HAFIP or HDFIP can be used as a possible quantitative measure of "interactive directness" (ID, see Formula 2). The measure ID delivers two indices: one for HAFIPs and one for HDFIPs. A PATH has no cycles and has not more than two additional dialog operations compared with the shortest sequence. An interface with the maximum ID of
Functional feedback:
FB = 100% * 1/D
Interactive
ID
Application
directness:
flexibility:
Dialog flexibility:
=
100%
*
DFA = 1/D
DFD = 1/D
D ∑ d=1
1/P D ∑ d=1 D ∑ d=1
P ∑ p=1
(#PFd / #HFd ) -1 lng(PATHp )
(#HAFIPd )
(#HDFIPd )
(1)
(2)
(3)
(4)
We carried out two different comparative usability studies to validate our measures [12] [2]. A third external comparative study [5] was used for a cross validation. All three investigated software products have the same application manager, but two different dialog managers each.
gement system with a new GUI-interface (desktop). The main result of this empirical investigation was, that the mean task solving time with the GUI is significantly shorter than with the CUI interface (see Table 2). How can we explain this difference? Our first interpretation of this outcome was the supposed different amount of 'transparency' [16]. One aspect of 'transparency' is 'feedback' (see [4], pp. 318-321).
4.1 Results and discussion of experiment-I We [12] compared an old, ascii-based CUI-interface (menu, as in Figure 3) of a relational database mana-
Interesting is the fact, that the GUI supports the user with less "functional feedback" (FB = 66%, Table 3) on average than the CUI (FB = 73%). This amount of FB of the CUI is caused by 22 small DCs with FB
4. The empirical validation
438
= 100%; the GUI has only 14 DCs with FB = 100%. The amount of functional feedback seems not to be related to the advantage of GUIs. There must be another reason.
Only the two measures of "flexibility" show an important difference between both interfaces (CUI: DFA = 12.1 and DFD = 10.1 versus GUI: DFA = 19.5 and DFD = 20.4, see Table 3). We interpret this result to the effect that flexibility must exceed a threshold to be effective (DFD, DFA > 15).
The "interactive directness" is not quite different between both interfaces (CUI: ID = 24.7% for AFIPs and 23.2% for DFIPs versus GUI: ID = 22.5% for AFIPs and 25.5% for DFIPs, see Table 3).
Table 2. Overview of the three empirical validation studies and their outcomes. Expe- Interface type, riment type of dialog structure
Application type
Dependent variable, No. of data points, [Reference]
I
CUI, hierarchical
Relational database
Task solving time, N = 12, [12]
I
GUI, hierarchical
Relational database
Task solving time, N = 12, [12]
II
Multimedia, hierarchical
Information system
Task solving time, N = 12, [2]
II
Multimedia, net shaped
Information system
Task solving time, N = 12, [2]
III
CUI, hierarchical
Simulation tool
Target discrepancy, N = 20, [5]
III
CUI, net shaped
Simulation tool
Target discrepancy, N = 15, [5]
Result of the dependent Statistical result of the variable mean comparison (Mean ± standard dev.) (p is alpha error) CUI: 683 s ± 556 s
GUI