A Concept to Quantify Different Measures of User Interface Attributes: a Meta Analysis of Empirical Studies Matthias Rauterberg Work and Organisation Psychology Unit (IfAP) Swiss Federal Institute of Technology (ETH) Nelkenstrasse 11, CH-8092 ZUERICH, Switzerland +41-1-632 70 82,
[email protected]
ABSTRACT There currently are several views on human computer interaction in measuring interactive qualities: (1) the interaction-oriented view, (2) the user-oriented view, (3) the product-oriented view and (4) the formal view. Two different possibilities of measurement within the product-oriented view are introduced in this paper. Different types of user interfaces can be described and differentiated by the concept of "interaction points". Regarding to the interactive semantic of "functional interaction points" (FIPs), four different types of FIPs must be discriminated. Based on the concept of FIPs, the dimensions "[visual] feedback" and "interactive directness" can be quantified. Both metrics are helpful to classify the most common user interfaces: command, menu, and direct manipulation. The classification can be validated with the outcomes of several empirical comparison studies.
1. INTRODUCTION The main problems of standards (ISO, DIN, etc.) in the context of software ergonomics is that they cannot measure user interface attributes in a quantitative and task independent way. Four different views on human computer interaction to measure interactive qualities currently exists (see also [22]; [3], p. 651). The interaction-oriented view: usability is measured in terms of how the user interacts with the product ("usability testing"). This view is the most common one. All kinds of usability testing with "real" users are subsumed in this category [11]. The user-oriented view: usability is measured in terms of the mental effort and attitude of the user ("questionnaires" and "interviews"). The formal view: usability is formalised and simulated in terms of mental models (formal concepts). Karat [10] describes formal methods in the context of "theorybased" evaluation. The product-oriented view: usability is measured in terms of the ergonomic attributes of the product (quantitative measures). All heuristic evaluations carried out by ergonomic experts investigating a concrete product fall in this category, too [8]. The interactive qualities of user interfaces currently are quantified in the context of nteraction-oriented view and user-oriented view, but these both approaches are time consuming and more or less expensive. Usability testing is constrained to the investigated task solving processes and the selected users, too. It would be helpful if usability attributes could be quantified in such a way that the extent of each attribute could be measured in task independent product features. 0-7803-3280-6/96/$5.00 © 1996 IEEE
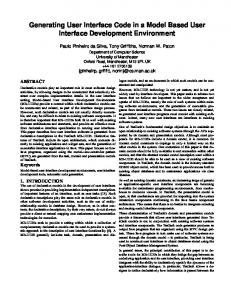
2. A QUANTITATIVE DESCRIPTION BASED ON INTERACTION POINTS It is necessary to define measures of usability for the product-oriented view, a concept of descriptive terms, which can be counted. The granularity of the descriptive terms must be on a medium level – not too specific (e.g. "push button", "menu option", etc.) and not too general (e.g. "transparent", "flexible", etc.). A level, at which it is possible to describe the different types of user interfaces ("batch", "command", "menu", "desktop") in a uniform and precise way, and at the same time a level is required that is powerful enough and easy to apply. The interaction space (IS) consists of two different interlaced spaces: the object space (OS), and the function space (FS). OS encloses all perceptible represented objects (PO) and all hidden objects (HO), which users can grasp and bring into the actual dialog context. The same situation is valid for FS: We have to distinguish between perceptible represented functions (PF) and hidden functions (HF). A concrete dialog context (DC) contains a subset of {OS ∪ FS}. An interactive system can be distinguished in a dialog and an application manager [6]. Belonging to this differentiation we distinguish between two types of objects and two types of functions: dialog object (DO, e.g. "window") and application object (AO, e.g. "text document"), and dialog function (DF, e.g. "open window") and application function (AF, e.g. "insert section mark"). Each function has a functional interaction point (FIP): AF –> AFIP, DF –> DFIP. PF is the set of all implemented representations of FIPs. The "interaction point (IAP)" introduced by Denert [5] is not differentiated enough to appropriately describe graphical user interfaces; an IAP is more or less the same as the "actual dialog context (DC)" discussed in this paper (Figure 1). A perceptible AFIP is called a PAFIP and a perceptible DFIP is called a PDFIP (see Figure 1). These perceptible structures can have visible, audible and/or tactile representations. PO is the set of all implemented representations of DOs (e.g. "button", "icon", "window", etc.) and AOs (e.g. "text document", "graphic", "data base", etc.). A perceptible AO is called a PAO and a perceptible DO is called a PDO. An AFIP changes the state of an AO, and a DFIP changes the state of a DO. All DFIPs are more or less "interactive overhead". DFIPs are only suitable to handle one of the most constrained interactive resource, namely the screen space. The complete set of all description terms is defined as follows (for a more detailed version see [21]):
– 2799 –
interaction space IS
object space OS
function space FS
perceptual objects PO
POs of the dialog manager PDO
µ
POs of the application manager PAO
perceptual functions PF
hidden objects HO
HOs of the dialog manager HDO
HOs of the application manager HAO
PFs of the dialog manager PDF
ν
PFs of the application manager PAF
δ
set of all possible object representations RO
hidden functions HF
HFs of the dialog manager HDF
HFs of the application manager HAF
α
set of all possible function representations RF
Figure 1. The interactive space (IS) consists of the object space (OS) and the function space (FS); OS and FS can be distinguished in perceptual and hidden objects and interaction points (IPs); each IP corresponds to an implemented function.
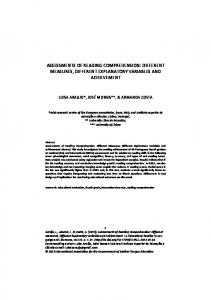
If both mapping function's δ and α are of the type 1 to m(any), then the user interface is a command interface (see Figure 2) where the command interface has only one pf∈PF, the "command prompt" (e.g. the PF in Figure 1). If both mapping function's δ and α are of the type 1:1, then the user interface is a menu or direct manipulative interface where each f∈FS is related to a perceptible structure PF on the I/O-interface. One important difference between a menu and a direct manipulative interface is the "interactive directness". A user interface is 100% interactively direct, if the user has fully access in the actual dialog context to all AFIPs [12]. Good interface design is characterized by optimising the multitude of DFIPs (e.g. "flatten" the menu tree [17]) and by allocating an appropriate PDFIP to the remaining HDFIPs. In the context of an actual dialog state the user must know what he or she can do next. To support the user in this way, different kinds of representational structures for functions (PF, e.g. "menus", "icons") have been developed (see [21]). If each functional interaction point (FIP) has its own representational interaction point (PF), then the user has 100% feedback (fFB) of all available functions. To estimate the amount of "feedback" of an interface a ratio is calculated: "number of PFs" (#PF = #PDFIP + #PAFIP) divided by the "number of HFs" (#HF = #HDFIP + #HAFIP) per dialog context. This ratio quantifies the average "amount of feedback" of the function space (fFB). (D is the number of all different dialog contexts.) [(functional) feedback]: D fFB = 1/D ∑ (#PFd / #HFd) d=1
* 100%
[interactive directness]: P -1 ID = 1/P ∑ lng(PATHp) * 100% p=1 The physical limitation of the I/O-interface (screen size) is one reason, not to present all available functional in-
teraction points (FIPs) with a specific representation (PF) on the screen. So, the user has to navigate through menu structures (= activating DFIPs) to come down to a DC with the desired AFIP (cf. [21]). The average length (lng) of "nearly" all possible sequences of dialog operations (PATH) from the top level dialog context down to DCs with the desired AFIP can be used as a good quantitative metric of "interactive directness" (ID): the reciprocal value of the average path length (lng = number of dialog steps). "Nearly" means that not all possible paths are included in this calculation, but only really used paths. An interface with the maximum ID of 100% has only one DC with path lengths of 1 dialog step. (P is the number of all different dialog PATHs.)
DC: dialog context (1.level)
actual DC (2.level)
i/o interface
PAFIP: the perceptible representation of a HAFIP HAFIP: hidden func-tional inter-action point of the application manager
representation space of the dialog and application objects (PDO + PAO)
a.function-1 a.function-2 a.function-3 a.function-4
PDFIP: the perceptible representation of a HDFIP HDFIP: hidden functional interaction point of the dialog manager
a.function-5 a.function-6
d.f1
d.f2
d.f3
d .f4
application manager
dialog manager
Figure 2. A schematic presentation of the I/O interface, the dialog and the application manager of an interactive system with a menu tree of two levels.
Today several dialog techniques are developed and in usage. The following dialog techniques and dialog objects can be distinguished with regard to traditional user interfaces: command language, function key, menu se
– 2800 –
lection, icon, and window [27]. These techniques can be summarised into three different interaction styles:
Table 1. A classification schema of most common user interfaces.
[visual] feedback (FB)
3. DESCRIPTION OF INTERFACES Command [language] interfaces (CI): This interaction style by typing in words from a set of legal commands is one of the oldest way to interact with a computer. If some or all the options and function points of a menu interface may be accessed directly through keyboard equivalents (including action codes, function keys, and softkeys) then we call this interface also a command-like interface. Pros: In the command mode the user has a maximum of direct access to all available functions and operations. This directness can be measured with the metric ID ≈ 1 (for examples see [21]). Cons: The user has no permanent feedback of all actual available function points This aspect can be measured with the metric fFB « 1 (see Table 1). Menu interface (MI): This interaction style includes rigid menu structures, pop-up and pull-down menus, form fill-in, etc. This style became technically possible only with those terminals that, essentially, can reproduce only the ASCII character set. With this type of interaction style function keys are often used in addition to manage the dialog. Pros: Most available functions are represented by perceivable interaction points (PF's). This feature can be measured with the metric fFB ≈ 100% (see Table 1). Cons: Finding a function point in deeper menu hierarchies is cumbersome; this can be measured with the metric ID » 1 (for example see Figure 2). Direct manipulative interface (DI): The development of this interaction style was based on the desktop metaphor which assumes that by depicting the work environment (i.e. of the desk: files, waste-paper basket, etc.) as realistically as possible on the I/Ointerface, it would be particularly easy for the user to adjust to the virtual world of electronic objects. Pros: All functions are represented by visible interaction points. The activation of intended functions can be achieved by directly pointing to their visible representations (see [21]). Cons: Direct manipulation interfaces have difficulty handling variables, or distinguishing the depiction of an individual element from a representation of a set or class of elements.
4. CLASSIFICATION OF INTERFACES Using the two quantitative measures "functional feedback" and "interactive directness" it is possible to classify the most common interface types: batch, command, menu, desktop (see Table 1). The command language interface is characterized by high interactive directness, but this interface type has a very low amount of visual feedback. Only graphical interfaces (GUIs) can support the user with sufficient visual feedback and with high interactive directness, too (c.f. [20] and [32]). To make this classification as understandable as possible, we describe the three classified interfaces (1) with one representative example of a concrete product and (2) with an abstract schema.
low
high
batch
menu interface MI
low
interactive directness (ID) high
command language CI
desktop style
direct manipulation DI
5. EMPIRICAL VALIDATION OF THE CLASSIFICATION A major task in our area of HCI is the development of a theoretical explanation of the outcomes presented in Figure 1 where we have available the results of a number of previous studies. Our first task is to find out what empirical relationships have been revealed in these studies so we can take them into account. In developing an understanding of these relationships, it is helpful in reviewing the studies to make up a table summarising the findings. Figure 1 show such summaries. In addition to the observed empirical outcome we recorded data on (1) compared interaction styles, (2) skill levels, (3) performance or attitude metrics, (4) the direction of the outcome, and (5) the result of the statistical test. First, we present an overview of the results of eight different empirical investigations which compared a command (CI) with a menu (MI) interface (see Table 2). To measure differences in the usage and in the personnel opinion several different metrics are used: task solving time, error rate, number of slips, error correction time, and subjective rating (for further details see in the references). The general result of this first overview (Table 2) is that there is no clear advantage neither for CI nor for MI. In nine of twenty-two measurements (41%) we can observe a clear advantage for MI, and in nine of twentytwo measurements (41%) are no significant differences; but, in four of twenty-two measurements (18%) there are significant advantages for CI. Second, we present an overview of the results of twelve different empirical investigations which compared a command (CI) with a direct manipulative (DI) interface (see Table 3). To measure differences in the usage and in the personnel opinion several different metrics are used: task solving time, number of errors, time between errors, error correction time, efficiency, and subjective rating (for further details see in the references). The general result of this second overview (Table 3) is that DI seems to be generally better than CI, not only for beginners, but also for advanced and expert users. In nineteen of twenty-five measurements (76%) we can observe an advantage for DI; in five of twenty-five measurements (20%) are no significant differences; and, only in one measurement (4%) is a significant advantage for CI.
– 2801 –
Table 2. The outcomes of nine different comparison studies between command (CI) and menu (MI) interfaces. ("CI > MI" means that the average usage/preference with/for CI is better than with/for MI; "CI < MI" means that the average usage/preference with/for MI is better than with/for CI; "CI = MI" means that there are no published data to decide; "sig." means that p ≤ 0.05; "not sig." means that p > 0.05)
Reference Streitz et al. (1987) Chin et al. (1988) Ogden & Boyle (1982) Roy (1992) Roberts & Moran (1983) Chin et al. (1988) Peters et al. (1990) Peters et al. (1990) Peters et al. (1990) Ogden & Boyle (1982) Roy (1992) Antin (1988) Hauptmann & Green (1983) Hauptmann & Green (1983) Hauptmann & Green (1983) Whiteside et al. (1985) Antin (1988) Roberts & Moran (1983) Whiteside et al. (1985) Streitz et al. (1987) Antin (1988) Whiteside et al. (1985)
interface CI, MI CI, MI CI, MI, HY CI, MI CI, MI, DI CI, MI CI, MI, DI CI, MI, DI CI, MI, DI CI, MI, HY CI, MI CI, MI, KMI CI, MI, NO CI, MI, NO CI, MI, NO CI, MI, IO CI, MI, KMI CI, MI, DI CI, MI, IO CI, MI CI, MI, KMI CI, MI, IO
skill level beginner beginner beginner advanced experts experts experts experts experts beginner advanced advanced beginner beginner beginner beginner advanced experts advanced advanced advanced experts
usability metric task solving time subjective rating preferences error rate task solving time subjective rating slips recognition errors efficiency task time task solving time subjective rating task solving time number of errors subjective rating task completion rate preferences error-free task time task completion rate task solving time task completion rate task completion rate
outcome CI < MI CI < MI CI < MI CI < MI CI < MI CI < MI CI < MI CI < MI CI < MI CI < MI CI < MI CI < MI CI = MI CI = MI CI = MI CI > MI CI > MI CI > MI CI > MI CI > MI CI > MI CI > MI
test result sig. sig. sig. sig. sig. sig. sig. sig. sig. not sig. not sig. not sig. not sig. not sig. not sig. not sig. not sig. not sig. sig. sig. sig. sig.
Table 3. The outcomes of twelve different comparison studies between command (CI) and desktop and direct manipulative (DI) interfaces. ("CI > DI" means that the average usage/preference with/for CI is better than with/for DI; "CI < DI" means that the average usage/preference with/for DI is better than with/for CI; "CI = DI" means that there are no published data to decide; "sig." means that p ≤ 0.05; "not sig." means that p > 0.05)
Reference Altmann (1987) Karat et al. (1987) Streitz et al. (1989) Sengupta & Te'eni (1991) Margono et al. (1987) Morgan et al. (1991) Morgan et al. (1991) Karat et al. (1987) Morgan et al. (1991) Margono et al. (1987) Morgan et al. (1991) Torres-Chazaro et al.(1992) Sengupta & Te'eni (1991) Tombaugh et al. (1989) Torres-Chazaro et al.(1992) Roberts & Moran (1983) Peters et al. (1990) Peters et al. (1990) Peters et al. (1990) Margono et al. (1987) Morgan et al. (1991) Tombaugh et al. (1989) Roberts & Moran (1983) Altmann (1987) Masson et al. (1988)
interface CI, DI CI, DI CI, DI CI, DI CI, DI CI, DI CI, DI CI, DI CI, DI CI, DI CI, DI CI, DI CI, DI CI, DI CI, DI CI, MI, DI CI, MI, DI CI, MI, DI CI, MI, DI CI, DI CI, DI CI, DI CI, MI, DI CI, DI CI, DI
skill level beginner beginner beginner beginner beginner beginner beginner beginner beginner beginner beginner beginner beginner advanced advanced experts experts experts experts beginner beginner advanced experts beginner advanced
6. DISCUSSION To come to a conclusion which interface style is the best, we need a lot of empirical studies. But, the most empirical studies have one of the following weaknesses ([17], p.207): Two or more commercially available systems are compared, which have different application managers (e.g.: [33] [1]), or two or more different interfaces of the same application manager are evaluated, but these systems are only prototypes in a laboratory setting (e.g., [28]). Another problem seems to be the selection
usability metric task solving time task solving time task solving time task solving time number of errors number of errors time between errors error correction time error-free time subjective rating subjective rating subjective rating efficient usage subjective rating subjective rating task solving time oblivion's errors recognition error efficiency task solving time task solving time task solving time error correction time subjective rating task solving time
outcome CI < DI CI < DI CI < DI CI < DI CI < DI CI < DI CI < DI CI < DI CI < DI CI < DI CI < DI CI < DI CI < DI CI < DI CI < DI CI < DI CI < DI CI < DI CI < DI CI < DI CI < DI CI < DI CI < DI CI > DI CI > DI
result sig. sig. sig. sig. sig. sig. sig. sig. sig. sig. sig. sig. sig. sig. sig. sig. sig. sig. sig. not sig. not sig. not sig. not sig. not sig. sig.
of real expert users. So normally empirical investigations are done with beginners only (e.g.: [13] [29]), and if the investigation tries to explain the differences between beginners and experts, trained beginners are mostly declared as experts. So, we classified "trained beginners" as "advanced" users, and the term "experts" was reserved only for users with long personal experiences in using the investigated systems. Since so far sufficient results are available with respect to a comparison of user interfaces based (1) on com
– 2802 –
mand interfaces, (2) on conventional menu selection, and (3) on direct manipulative interfaces, these three interaction styles were compared in this paper. To test the often expressed opinion, that desktop interfaces are only good for beginners--and not for experts--, this aspect should be considered, too. If the classification of the three most common interfaces in chapter 2 is valid, then we expect different outcomes of empirical comparison studies. On the side of interactive directness, the command interface is superior to menu interfaces; on the other side of functional feedback, the menu interface must show significant advantages. It is impossible to compare both interfaces empirically by separating the two factors--functional feedback and interactive directness--without destroying the characteristic of each interface style. This overlay of the two independent factors may be one reason for incongruent and inconsistent results in Table 2. One of the main goal of research in this area is the production of an integrated statement of the empirical findings of the many pieces of research done. In a broad sense, this means a theoretical analysis of how and why the many facts fit together. However, our quantitative description based on interaction points--as a broad theoretical integration--cannot be put on a sound footing until a narrower integration of the cited empirical studies has taken place. This narrow focus on single empirical outcomes of several comparison studies is the starting point for a meta-analysis [24].
To estimate the correlation between (1) the type of the comparison ("CI versus MI" or "CI versus DI") and (2) the direction of the outcome ("CI better as MI or DI" versus "CI worse as MI or DI"), we calculated the Chisquare test of the appropriate contingency table. We can find a significant correlation between both dimensions (p ≤ .044; see Table 4). This correlation means that CI has a higher chance to be better if it is compared with MI, and--on the other side--a significant lower chance to outperform DI. This meta-analytical result is a strong evidence that our classification schema (see Table 1) is one possible and plausible interpretation. Therefore, we interpret this result as an empirical validation of our two metrics fFB and ID. To find out which interaction style is appropriate for which skill level of the user, we analysed the contingency table with the two dimensions: (1) direction of the outcome ("CI better as MI or DI" versus "CI worse as MI or DI"), and (2) skill level of the users ("beginner" versus "advanced + experts"). We can find a significant correlation between both dimensions (p ≤ .018; see Table 5). This correlation means that the outcome "CI better as MI or DI" can be significantly more often observed with advanced users than with beginners. This result is a first empirical confirmation of the often expressed opinion that CI is especially good for experts.
Table 4. Contingency table of a meta-analysis only for significant differences (result = "sig."). [CELL CONTENT: observed frequency (expected frequency)]
CI vs. MI
CI vs. DI
outcome of this meta-analysis
CI better as MI,DI
4 (2.0)
1 (3.0)
Chi** = 4.07, df = 1
CI worse as MI,DI
9 (11.0)
19 (17.0)
p ≤ .044
Table 5. Contingency table of a meta-analysis only for significant differences (result = "sig."). [CELL CONTENT: observed frequency (expected frequency)]
beginner
advanced+
CI better as MI,DI
0 (2.4)
5 (2.6)
Chi** = 5.55, df = 1
CI worse as MI,DI
16 (13.6)
12 (14.4)
p ≤ .018
7. CONCLUSION Standards and norms need product oriented operationalization of interface features. To attain this goal, a description language for interface structures which is general enough to classify the different interface types and detailed enough to allow quantification is required. The descriptive concept for functional "interaction points" (FIP), which is introduced in this paper, meets these both conditions. The function space (FS) is a set of all implemented FIPs and can be distinguished in (1) functional and representational interaction points, and (2) dialog and application specific interaction points. The degree of visualisation and interactive directness can be described and measured based on these interaction points. Using the two quantitative metrics "functional feedback" (fFB) and "interactive directness" (ID) in
outcome of this meta-analysis
measuring two relevant aspects of user interactive quality it is possible to classify the most common interface types: [batch], command, menu, desktop. The command interface is characterized by high interactive directness, but has a very low amount of functional feedback. Only graphical interfaces (GUIs) can support the user with sufficient interactive directness and with high visibility. In addition to the metrics for "functional feedback" and "interactive directness" two other quantitative metrics have been defined and validated: "flexibility of the dialog interface" and "flexibility of the application interface" [20]. The empirical validation of these two additional measures was carried out with six different I/Ointerfaces of six different dialog managers for three different application managers ("relational data base sys
– 2803 –
tem", "multi media information system", and "simulation tool kit"; detailed description in [21]). The presented approach to quantify usability attributes and the interactive quality of user interfaces in a task independent way is a first step in the right direction. The next step is a more detailed analysis of the relevant characteristics and validation of these characteristics in further empirical investigations. Standardised criteria need to be developed to test user interfaces for conformity with standards.
REFERENCES [1] Altmann, A. (1987) Direkte Manipulation: empirische Befunde zum Einfluss der Benutzeroberfläche auf die Erlernbarkeit von Textsystemen. Zeitschrift für Arbeits- und Organisationspsychologie 31(3):108-114. [2] Antin, J. (1988) An empirical comparison of menu selection, command entry and combined modes of computer control. Behaviour and Information Technology 7(2):173182. [3] Bevan, N., Kirakowski, J. & Maissel, J (1991) What is Usability? in: Human Aspects in Computing: Design and Use of Interactive Systems with Terminals; (Bullinger, HJ.; ed.); Elsevier; 651-655. [4] Chin, J. P., Diehl, V. A. & Norman, D. (1988) Development of an instrument measuring user satisfaction of the human-computer interface. In: E. Soloway, D. Frye & S. B. Sheppard (eds.) Human Factors in Computing Systems CHI'88. ACM,, pp. 213-218. [5] Denert, E. (1977) Specification and design of dialogue systems with state diagrams. in: International Computing Symposium 1977; (Morlet, E. & Ribbens, D.; eds.); NorthHolland; 417-424. [6] Edmonds, E. & Hagiwara, N. (1990) An experiment in interactive architectures. In: Human-Computer Interaction INTERACT '90. (Diaper, D. et al.; eds.) Elsevier; 601-606. [7] Hauptmann, A. G. & Green, B. F. (1983) A comparison of command, menu-selection and natural-language computer programs. Behaviour and Information Technology 2(2): 163-178. [8] Jeffries, R. & Desurvire, H. (1992) Usability testing vs. heuristic evaluation: was there a contest? SIGCHI Bulletin 24(4), 39-41. [9] Karat, J. (1988) Software Evaluation Methodologies. in: Handbook of Human-Computer Interaction; (Helander, M.; ed.); Elsevier; 891-903. [10] Karat, J., Fowler, R. & Gravelle, M. (1987) Evaluating user interface complexity. In: In: H-J. Bullinger & B. Shackel (eds.) Human-Computer Interaction - INTERACT '87. North-Holland, pp. 489-495. [11] Kirakowski, J. & Corbett, M. (1990) Effective Methodology for the Study of HCI. in: Human Factors in Information Technology, vol. 5; (Bullinger, H. & Polson, P.; eds.); North-Holland. [12] Laverson, A., Norman, K. & Shneiderman, B. (1987) An evaluation of jump-ahead technique in menu selection. Behaviour and Information Technology 6(2), 97-108. [13] Margono, S. & Shneiderman, B. (1987) A study of file manipulation by novices using commands vs. direct manipulation. In: Proceedings of 26th Annual Technical Symposium, Washington D.C. Chapter of ACM Gaithersburg, MD - June, 11, 1987. ACM, pp. 154-159. [14] Morgan, K., Morris, R. & Gibbs, S. (1991) When does a mouse become a rat? or … comparing performance and preferences in direct manipulation and command line environment. The Computer Journal 34(3):265-271. [15] Masson, M., Hill, W., Conner, J. & Guidon, R. (1988) Misconceived misconception? In: E. Soloway, D. Frye & S. Sheppard (eds.) Human Factors in Computing Systems CHI'88. ACM, pp. 151-156.
[16] Ogden, W. & Boyle, J. (1982) Evaluating human-computer dialog styles: command vs. form/fill-in for report modification. In Proceedings of the 26the Annual Meeting of the Human Factors Society, pp. 542-545. [17] Paap, K. & Roske-Hofstrand, R. (1988) Design of menus. in: Handbook of Human-Computer Interaction; (Helander, M.; ed.); North-Holland; 205-235. [18] Peters, H., Frese, M. & Zapf, D. (1990) Funktions- und Nutzungsprobleme bei unterschiedlichen Dialogformen. Zeitschrift für Arbeitswissenschaft 44(3):145-152. [19] Rauterberg, M. (1992) An empirical comparison of menu-selection (CUI) and desktop (GUI) computer programs carried out by beginners and experts. Behaviour and Information Technology 11(4), 227-236. [20] Rauterberg, M. (1993) A product oriented approach to quantify usability attributes and the interactive quality of user interfaces. In: H. Luczak, A. Cakir & G. Cakir (Eds.) Work With Display Units 92. North-Holland, pp. 324-328. [21] Rauterberg, M. (1995) Four different measures to quantify three usability attributes: 'feedback', 'interactive directness' and 'flexibility'. In: P. Palanque & R. Bastide (eds.) Design Specification and Verification of Interactive Systems'95. Springer, pp. 209-223. [22] Rengger, R. (1991) Indicators of usability based on performance. in: Human Aspects in Computing: Design and Use of Interactive Systems with Terminals; (Bullinger, HJ.; ed.); Elsevier; 656-660. [23] Roberts, T. & Moran, T. (1983) The Evaluation of Text Editors: Methodology and Empirical Results. Communications of the ACM 26(4):265-283. [24] Rosenthal, R. (1984) Meta-analysis procedures for social research. (Applied Social Research Methods Series, Vol. 6), Sage. [25] Roy, G. (1992) An evaluation of command line and menu interface in a CAD environment. International Journal of Computer Integrated Manufacturing 5(2):94-106. [26] Sengupta, K. & Te'eni D. (1991) Direct manipulation and command language interfaces: a comparison of users' mental models. In: H.-J. Bullinger (ed.) Human Aspects in Computing: Design and Use for Interactive Systems and Information Management. (Advances in Human Factors/Ergonomics, 18A, pp. 429-434), Elsevier. [27] Shneiderman B (1987) Designing the User Interface. Addison-Wesley. [28] Streitz, N., Spijkers, W. A. C. & van Duren, L. L. (1987) From Novice to expert user: a transfer of learning on different interaction modes. In: H.-J. Bullinger & B. Shackel (eds.) Human-Computer Interaction - INTERACT ’87. North-Holland, pp. 841-846. [29] Streitz, N., Lieser, A. & Wolters, A. (1989) The combined effects of metaphor worlds and dialogue modes in human-computer-interaction. In: F. Klix, N. Streitz, Y. Waern & H. Wandke (eds.) Man-Computer Interaction Research MACINTER-II. Elsevier, pp. 75-88. [30] Tombaugh, J., Paynter, B. & Dillon, R. (1989) Command and graphic interfaces: user performance and satisfaction. In: G. Salvendy & M. Smith (eds.) Designing and Using Human-Computer Interfaces and Knowledge Based Systems. Elsevier, pp. 369-375. [31] Torres-Chazaro, O., Beaton, R. & Deisenroth, M. (1992) Comparison of command language and direct manipulation interfaces for CNC milling machines. International Journal of Computer Integrated Manufacturing 5(2):107-117. [32] Ulich, E., Rauterberg, M., Moll, T., Greutmann, T. & Strohm, O. (1991): Task orientation and User-Oriented Dialog Design. International Journal of Human-Computer Interaction 3(2), 117-144. [33] Whiteside, J., Jones, S., Levy, P. S. & Wixon, D. (1985) User Performance with Command, Menu, and Iconic Interfaces. Human Factors in Computing Systems-II. Proceedings of the CHI ´85. North-Holland, pp. 185-191.
– 2804 –
1996 IEEE International Conference on Systems, Man and Cybernetics
Information Intelligence and Systems
Beijing, China October 14-17, 1996
Copyright and Reprint Permission: Abstracting is permitted with credit to the source. Libraries are permitted to photocopy beyound the limit of U.S. copyright law for private use of patrons those articles in this volume that carry a code at the bottom of the first page, provided the pre-copy fee indicated in the code is paid through Copyright Clearance Center, 222 Rosewood Drive, Danvers, MA 01923. For other copying, reprint or publication permission, write to IEEE Copyrights Manager, IEEE Service Center, 445 Hoes Lane, P.O. Box 1331, Piscataway, NJ 08855-1331. All rights reserved. Copyright © 1996 by the Institute of Electrical and Electronics Engineers, Inc.
IEEE Catalog Number: 96CH35929 ISBN (Softbound Edition): 0-7803-3280-6
Volume 4 of 4 96CH35929
Sponsored by Tsinghua University