An Enhanced Approach to Optimizing the Stock Portfolio Selection based on Modified Markowitz MV Method Kuang Yu Huang, Chuen-Jiuan Jane, Ting-Cheng Chang Journal of Convergence Information Technology, Volume 6, Number 2. February 2011
An Enhanced Approach to Optimizing the Stock Portfolio Selection based on Modified Markowitz MV Method 1
Kuang Yu Huang, 2 Chuen-Jiuan Jane, 3 Ting-Cheng Chang
1 First Author
Department of Information Management, Ling Tung Univ.,
[email protected] Department of Finance and Risk Management, Ling Tung Univ.,
[email protected] 3r Department of Information Management, Ling Tung Univ.,
[email protected] doi:10.4156/jcit.vol6. issue2.24 *2,Corresponding Author
Abstract This study presents an expert system for automatically predicting the future behavior of the stock market and determining an investment portfolio which maximizes the rate of return using a hybrid GRA / MV Model. The proposed system involved a moving Average Autoregressive Exogenous (ARX) prediction model, an enhanced clustering / classification method based on Huang-index function, RS theory ,Grey Relational Analysis (GRA) model, and Markowitz MV method. ARX is used to forecast the future trends of the collected data over the next quarter or half-year period. The enhanced clustering method is used to determine the optimal number of clusters per attribute. A RS classification module then is supplied to identify the stocks within the lower approximate sets. Finally, the selected stocks are using a hybrid GRA / MV scheme in order to maximize the rate of return of the stock portfolio. The validity and effectiveness of the clustering / classification method based on Huang-index function is first evaluated prior to that of the expert system. After that, the validity of the proposed expert system is demonstrated using electronic stock data extracted from the financial database maintained by the Taiwan Economic Journal (TEJ).
Keywords: ARX Model, Huang-index Function, Rough Set, Grey Relational Analysis, Stock Portfolio, Markowitz Portfolio Model, Efficient Frontier
1. Introduction Predicting stock prices and constructing a portfolio of stocks which maximizes the rate of return on the invested capital in today’s volatile markets is notoriously difficult and represents a major challenge for traditional time-series-based systems. Consequently, a requirement exists for robust forecasting schemes capable of generating precise predictions of the future behavior of the stock market in order to provide investors with a reliable indication as to where they should best invest their capital in order to improve their rate of return. In recent decades, many applications have been proposed for predicting market trends selecting suitable stocks for investment purposes. These applications are typically based upon genetic algorithms (GAs) [1], the neural networks [2], statistical forecasting [3, 4], or rough set (RS) theory [5]. In the past, the decision as to which stocks to include within the portfolio was generally made on a qualitative or intuitive basis. However, in recent decades, investors have turned increasingly to the use of quantitative-based stock selection mechanisms in the hope of maximizing their rate of return whilst simultaneously reducing the level of risk. One of the most well known investment models is the meanvariance (MV) portfolio selection model proposed by Markowitz in 1952. The MV model is based on the assumption that for a given level of risk, investors will seek to maximize the expected return on their portfolios, whereas for a given expected return, investors will attempt to minimize the risk. In the MV approach, this concept is modeled using an “efficient frontier”, i.e. a curve representing the possible portfolio allocation decisions which maximize the return for a given risk or minimize the risk for a given return. In other words, any portfolio lying on the efficient frontier has either a higher rate of return for the same (or lower) risk than any portfolio not on the curve, or a lower risk for the same (or better) rate of return. In practice, the modified curve is obtained relatively easily utilizing a quadratic programming (QP) technique.
- 226 -
An Enhanced Approach to Optimizing the Stock Portfolio Selection based on Modified Markowitz MV Method Kuang Yu Huang, Chuen-Jiuan Jane, Ting-Cheng Chang Journal of Convergence Information Technology, Volume 6, Number 2. February 2011
However, for reasons of practicality, it may be desirable to limit the number of assets held within the portfolio and / or to impose constraints on the proportion of the portfolio devoted to any particular asset [6]. If such constraints exist, the problem of locating the efficient frontier becomes considerably more complex. Thus, in this study, the standard MV model is extended to the so-called Modifying MV (M-MV) model by incorporating constraints on the ranking relationship between the proportions of the total available capital allocated to each stock within the portfolio. Meanwhile, the ranking of the various selected stocks could be obtained form the GRA method. The hybrid stock selection model designed to maximize the rate of return of the portfolio whilst minimizing the risk subject to two constraints, namely (a) a specified number of assets within the portfolio, and (b) prescribed limits on the capital allocation to each of the stocks within the portfolio. Thus, the current study develops a mechanism for assisting investors in predicting the future behavior of the stock market such that they can make rational decisions as to how best to manage their portfolio. The proposed approach combines the ARX prediction model, the enhanced clustering method based on Huang-index function [7], RS theory [8], Grey Relational Analysis (GRA), the Markowitz portfolio selection model [9, 10], and the investment guidelines of Buffett prescribed by Hagstrom etc. [11] to construct an algorithm for forecasting financial data over a quarter or half-year period and then predicting the stock portfolio which will maximize the rate of return. In developing the algorithm, the standard Markowitz mean-variance (MV) model is extended to include cardinality constraints which limit the portfolio to a specified number of assets and impose constraints on the ranking relationship between the proportions of the total available capital allocated to each selected stock. Grey System theory proposed by Deng [12] is a multidisciplinary theory for dealing with systems characterized by poor, incomplete, and uncertain information. One of the most fundamental components of Grey system theory is that of Grey Relational Analysis (GRA), in which information from the grey system is used to quantify the respective effects of the various factors in order to determine their Grey Relational Grade (GRG). In other words, GRA provides an ideal means of analyzing the complex inter-relationships amongst the individual parameters in systems with multiple performance characteristics and has been applied to a wide variety of optimization, decision-making and classification problems in such diverse fields as finance, business, economics, design, manufacturing and production [13, 14, 15, 16]. In the stock portfolio selection system, the values of financial indices are continuous, thus, the performance of RS classification model is basically resulting from the quality of the original clustering results. Attributes clustering must be performed in prior to conduct a continuous valued dataset classification, and correct partitioning is the prelude to available classifications. Accordingly, when classifying continuous valued stock datasets with vague or missing information, it is preferable to utilize RS theory [8, 17] for classification purposes, and to integrate the RS model with some form of cluster generation / cluster index evaluation procedure [18] such that the optimal discretizing solution can be obtained. Thus, in [7], the number of clusters of attributes is optimized using a enhanced clustering method based on Huang-index function and RS theory is then applied to identify the stocks within the lower approximate sets. The remainder of this paper is organized as follows. Section 2 presents the fundamental principles of the ARX model, Huang-index function, Grey theory and the optimized Markowitz portfolio selection model, respectively. Section 3 describes the integration of these various concepts to construct the proposed stock market forecasting and portfolio selection scheme. Section 4 evaluates the performance of the proposed hybrid scheme using electronic stock data extracted from the financial database maintained by the Taiwan Economic Journal (TEJ). Finally, Section 5 presents some brief concluding remarks and indicates the intended direction of future research.
2. Review of related methodologies This section reviews the basic principles of the major methodologies applied in this study to develop the proposed stock market forecasting and portfolio selection system.
- 227 -
An Enhanced Approach to Optimizing the Stock Portfolio Selection based on Modified Markowitz MV Method Kuang Yu Huang, Chuen-Jiuan Jane, Ting-Cheng Chang Journal of Convergence Information Technology, Volume 6, Number 2. February 2011
2.1. ARX model In general, the objective of ARX prediction models is to minimize a positive function of the prediction errors. The output of the ARX model is predicted on the basis of an assumption that a system changes only gradually over time and can be identified by a set of parameters. When constructing the ARX model, these parameters are generally estimated using a system identification process. The ARX model has the form y (t ) a1 y (t 1) ... a n a y (t na ) b1u (t 1) ... bnb u (t nb ) e(t ) where y (t ) is the output, u (t ) is the input and e(t ) is a white-noise term. In the application considered in the present study, i.e. the forecasting of time-series financial data, the most important aspect of this ARX model is its one-step-ahead predictor, which has the form yˆ (t , ) T (t ) , where a1,...an , b1 ,..., bn T is obtained using the least squares method and yields
a
b
2
1 N T y (t ) yˆ (t , ) , and (t ) y (t 1),..., y (t na ), u (t 1),..., u (t nb ) . N t 1 As shown, the one-step-ahead predictor is essentially a scalar product of a known data vector (t ) and the parameter vector . In statistics, such a model is known as a linear regression model and vector (t ) is the regression vector. In the ARX model, the prediction error is given by e(t ) y (t ) yˆ (t , ) and can be computed given min
a knowledge of y (t ) and (t ) . For convenience, each instance of y (t ), (t ) is generally referred to as a data point. The corresponding prediction error is given by e(t ) y (t ) yˆ (t , ) . It can be computed given by y (t ) and (t ) , and we will refer to y (t ), (t ) as a data point.
2.2. Index function I max Assume that each instance xi in the dataset has m attributes and the l -th attribute al can be partitioned into pl clusters. The index of the cluster to which the l -th attribute al of instance xi belongs is obtained as Cl xi I max ( j ( xi (al ))) = Index ( max( j ( xi (al )))) for 1 l m,1 i n , where I max ( j ( xi (al ))) returns the index of the cluster corresponding to the maximum value amongst all the membership functions of the l -th attribute of xi .
2.3. Huang-index function When integrated with an appropriate clustering scheme based on a constant number of clusters per attribute, the Huang-index function [7] ensures the formation of a small number of compact clusters within the dataset, maximizes the separation distance between at least two of these clusters, and optimizes the accuracy of approximation. The Huang-index function has the form 1 E H (C , C ) ( 1 DC ) , C FC where C is the number of clusters per conditional and decision attribute and c is the corresponding accuracy of approximation when evaluated in terms of the c th cluster of the decision attribute d .
- 228 -
An Enhanced Approach to Optimizing the Stock Portfolio Selection based on Modified Markowitz MV Method Kuang Yu Huang, Chuen-Jiuan Jane, Ting-Cheng Chang Journal of Convergence Information Technology, Volume 6, Number 2. February 2011
In the Huang-index function, E1 is constant for a given dataset and is used only to prevent the C
second term from disappearing. In addition, FC Ec is obtained by accumulating the value of Ec c 1
n
m
for each cluster of the decision attribute ( d ), where Ec is given by Ec cj ( x j (d )) x j z c j 1
c
in which cj ( x j (d )) is the membership function [2, 7] of instance x j in the c th cluster of the decision attribute d and zc is the multi-dimensional centroid of the lower approximate sets associated with the c th cluster of the decision attribute d and is obtained by computing the mean values of the
conditional and decision attributes of each instance in the corresponding sets. Furthermore, m is the fuzzification parameter and n is the total number of data points in the dataset. Finally, the value of DC is equal to the maximum separation distance amongst the centroids of all the lower approximate C
sets associated with the different clusters of the decision attribute, i.e., DC max zi z j . Note that i , j 1
the value of DC is upper bounded by the maximum separation distance amongst all possible pairs of data points within the dataset. The details of each processing step of the enhanced clustering method are summarized in [7].
2.4. Grey relational analysis [19] In GRA, data characterized by the same set of features are regarded as belonging to the same series. The relationship between two series can be determined by evaluating the differences between them and assigning an appropriate GRA. The mathematical equation of geometry mean was used to construct the kernel of this GRA, and emphasized that the weight of every attribute was the same to a sequence. min 0i 0i max min 1
xi (k ) m m , x0 (k ) is the reference value, and xi (k ) where i 1,2,..., m , 0i 0i (k ) , oi ( k ) x0 ( k ) k 1 is the comparative value. Furthermore, min min 0i and max max 0i . i
i
Having calculated the GRG, the sequences can be ranked using a so-called grey relational ranking procedure. For example, for the case of a reference sequence x0 (k ) , the grey relational rank of xi (k ) is greater than that of x j (k ) if ( x0 , xi ) ( x0 , x j ) . The corresponding ranking is denoted as xi x j .
2.5. M-MV model The portfolio selection model was proposed by Markowitz [20] in 1952 as a means of assisting investors in balancing their investment expectations against the corresponding degree of risk when constructing stock portfolios. The model is based upon the assumption that for a given level of risk, investors will invariably attempt to maximize their expected return, while for a given expected return, investors will attempt to minimize their risk. In other words, when evaluating different potential portfolios, only those portfolios which yield the greatest rate of return at the same (or lower) level of risk will be considered by the investor. Based upon these assumptions, Markowitz proposed the concept of an “efficient frontier”, i.e. a curve depicting the set of possible portfolio allocations which yield the maximum return for any given level of risk or which minimize the risk for any given level of
- 229 -
An Enhanced Approach to Optimizing the Stock Portfolio Selection based on Modified Markowitz MV Method Kuang Yu Huang, Chuen-Jiuan Jane, Ting-Cheng Chang Journal of Convergence Information Technology, Volume 6, Number 2. February 2011
return. Thus, every portfolio lying on the efficient frontier has either a higher rate of return for the same (or lower) risk than any portfolio not on the curve, or a lower risk for the same (or better) rate of return. In the conventional Markowitz portfolio selection model, n denotes the number of different assets within the portfolio, ri is the mean return of asset i , ij is the covariance between the returns of assets
i and j , and 0,1 is the risk aversion parameter. Furthermore, the proportion of the total available capital invested in asset i is modeled using the decision variables w . Using these notations, the i
standard mean-variance (MV) Markowitz model for the portfolio selection problem is formulated as n n n minimize wi w j ij 1 ri wi , subject to a single equivalent constraint i 1 j 1 i 1 n
equation wi 1 and n range constraint equations 0 wi 1 . i 1
Although many previous studies have utilized this standard MV model to optimize the allocation of assets within a portfolio [21, 22], the model does not impose constraints on the proportion of the total available capital allocated to each selected stock. Thus, in this study, the standard MV model is extended to the so-called M-MV model by incorporating constraints on the ranking relationship between the proportions of the total available capital allocated to each stock within the portfolio. The ranking of the various selected stocks obtained form the GRA method is used to constrain decision variables wi . The additional n 1 un-equivalent allocation constraint equations on the decision variables wi are w2 w1 0, w3 w2 0,..., wn wn 1 0 . So, the M-MV model is formulated as n n n minimize wi w j ij 1 ri wi , i 1 j 1 i 1 n
subject to wi 1 , i 1
0 wi 1, i 1,2,..., n , and w2 w1 0, w3 w2 0,..., wn wn 1 0 In the M-MV model, a risk aversion parameter of = 0 indicates the desire to maximize the portfolio mean return (without considering the variance), and thus the optimal solution will comprise a portfolio containing the single asset providing the greatest mean return. By contrast, a risk aversion parameter of =1 indicates the desire to minimize the total variance associated with the portfolio (regardless of the mean return), and thus the optimal portfolio will typically consist of multiple assets. Clearly, any value of within the interval 0,1 represents a tradeoff between the mean return and the variance, and generates a portfolio solution between those associated with the extremes = 0 and 1, respectively. A detailed description and basic concepts of RS theory and GM(1,N) are presented in [18] and [8], respectively.
3. Optimized portfolio selection model This study combines the methodologies described in Section 2 to create an automatic stock market forecasting and portfolio selecting expert system. In the proposed system, financial data are collected automatically every quarter and are input to an ARX prediction model to forecast the future trends of the collected data over the next quarter or half-year period. The forecast data are then reduced using a GM(1,N) model, clustered using a clustering / classification algorithm based on Huang-index function, and then supplied to a RS classification module which selects appropriate investment stocks in accordance with a pre-determined set of decision-making rules. Finally, the selected stocks are processed by an integrated GRA / MV
- 230 -
An Enhanced Approach to Optimizing the Stock Portfolio Selection based on Modified Markowitz MV Method Kuang Yu Huang, Chuen-Jiuan Jane, Ting-Cheng Chang Journal of Convergence Information Technology, Volume 6, Number 2. February 2011
scheme in order to determine the stock portfolio which maximizes the rate of return. Note that in contrast to the standard MV Markowitz model, the M-MV model includes additional cardinality constraints which limit the portfolio to a specified number of assets and impose constraints on the ranking relationship between the proportions of the total available capital allocated to each stock within the portfolio.
3.1. Selection of decision-making attributes In the proposed model, RST and Grey relational analysis are used to process the forecast data generated by the ARX model in order to construct the optimal stock portfolio. This processing task is performed in accordance with a set of decision-making attributes, which basically tell the RST model which stocks it should at least consider and which it can immediately discount. In the current study, these decision-making attributes are selected in accordance with the investment principles advocated by Buffett prescribed by Hagstrom etc. [11]. Applying these basic investment principles, the current model implements the following decision-making attributes: D1: return on asset (after tax) greater than zero D2: return on equity greater than zero D3: gross profit ratio greater than zero D4: equity growth rate greater than zero D5: quick ratio greater than median of all industry D6: inventory turnover rate greater than median of all industry D7: constant EPS greater than zero Note that to ensure that all enterprises with a profit-making potential are included within the RST / Grey relational classification process, the threshold values of decision-making attributes D1, D2, D3, D4 and D7 are deliberately stated as “greater than 0” rather than being assigned a particular threshold value.
3.2. The optimal allocation of investment portfolio The stocks selected by the RS module are processed by a combined GRA / MV scheme in order to determine the stock portfolio which maximizes the rate of return subject to the dual constraints of a specified number of assets within the portfolio and a specified allocation of the available capital to each selected stock, respectively. In the proposed approach, the GRA model is used to rank the various selected stocks and then to include cardinality constraints which limit the portfolio to a specified number of assets. The M-MV model is then applied to compute the efficient frontier imposed a specified number of constraints on the ranking relationship between the proportions of the total available capital allocated to each stock and to evaluate the rate of return / expected risk for various points on the curve.
3.3. Detailed processing steps of automatic forecasting and optimized stock selection model The detailed processing steps in the hybrid model of forecasting and optimal allocation of a portfolio are illustrated in Figure 1. ( insert Figure 1 here) The basic steps in this model can be summarized as follows: Step 1: Data collection and attribute determination In the current model, the conditional attributes should reflect the financial quality of a company. Therefore, the proposed model specifies the following attributes: the profitability, the capitalized cost ratio, the individual share ratio, the growth rate, the debt ratio, the operational leverage and all statutory financial ratios. The decision as to which of the selected companies should actually be processed by the RS theory portfolio selection mechanism is then made by processing the forecast data generated by the ARX model in accordance with the seven decision-making attributes specified in the previous section.
- 231 -
An Enhanced Approach to Optimizing the Stock Portfolio Selection based on Modified Markowitz MV Method Kuang Yu Huang, Chuen-Jiuan Jane, Ting-Cheng Chang Journal of Convergence Information Technology, Volume 6, Number 2. February 2011
Step 2:Data preprocessing Having collected the relevant financial data every quarter, a basic pre-processing operation is performed to improve the efficiency of the ARX prediction model. For example, any data records containing missing fields (i.e. attributes) are immediately rejected. In addition, the problem of data outliers is addressed by using the Box Plots method [23] to establish an inter-quartile range such that any data falling outside this range can be automatically assigned a default value depending on the interval within which it is located. Step 3:ARX prediction As discussed earlier, the stock market is a sequentially correlated signal system, and hence the current model uses an ARX forecasting model to predict the future trends of the financial variables of each of the selected companies. In the current ARX model, forecasting is deliberately restricted to a one-step-ahead mode to prevent the accumulation of errors from previous forecasting periods. Step 4:Information reduction using GM(1,N) multivariate model To improve the efficiency of the RS theory process, certain conditional attributes are removed if they are found to have little effect on the decision-making attributes. In the proposed model, this pruning operation is performed by using the GM(1,N) method to identify the top ten influential sequences (i.e. conditional attributes) and then removing the remainder. Step 5: Clustering attributes using clustering method based on Huang-index function. In order to recognize the optimal number of clusters per attribute (conditional and decision) and the corresponding set of cluster indices, the clustering method based on Huang-index function is applied to processing the forecasting data of attribute values. Step 6: Selection of approximate sets Having clustered the forecast data, the RS method is applied to determine the lower approximate set. The generalized rules extracted by the low approximate set are all recognized rules or relationships in the investment industry. This indicates that RS classification module selects appropriate investment stocks in accordance with a pre-determined set of decision-making rules and reduces the risk of investment. In the current system, the RS model outputs the potential stocks for inclusion in the optimal portfolio. Step 7: Optimized fund allocation Having identified suitable stocks using the RS model, an integrated GRA / MV scheme is applied to determine the portfolio allocation which maximizes the overall rate of return. As described in Section 3.2, the optimal portfolio is constructed subject to three constraints, namely: (1) the number of assets within the portfolio, (2) the ranking relationship between allocations wi of each selected asset i, and (3) the maximum allocation wi of each selected asset i. Having completed all the steps described above, a check is made of the overall rate of return on the investment. If the rate of return is acceptable, a decision is made as to whether or not the model should be run for a further quarter using the existing attributes. However, if the rate of return is unacceptable, the suitability of the conditional attributes is reviewed and the attributes are amended if necessary.
4. Evaluation of proposed model using electronic stock data 4.1. Data extraction In this study, the feasibility of the proposed forecasting and stock selection model was evaluated using electronic stock data extracted from the New Taiwan Economy database (TEJ) [8, 24]. In general, financial statements for a particular accounting period are subject to a considerable delay before they are actually published. A detailed description of submission deadlines for the financial statements maintained in the TEJ database are presented in [8]. Since the last quarter data every year can not be acquired until 31st May in the following year, the data can not be used by the ARX model to predict the financial trends over the first quarter of the year. In other words, the forecasting and investing process proposed in this study can only be conducted three times each year, i.e. 5/31~09/22,
- 232 -
An Enhanced Approach to Optimizing the Stock Portfolio Selection based on Modified Markowitz MV Method Kuang Yu Huang, Chuen-Jiuan Jane, Ting-Cheng Chang Journal of Convergence Information Technology, Volume 6, Number 2. February 2011
9/22~11/15 and 11/15~05/31 next year. In addition, in the decision-making rules used in the rough set stock selection process, the Return on Equity (ROE) and constant EPS indicators are based on the full 12 months of the previous year. Thus, the forecasting period for investment purposes is actually reduced to the second quarter in 2004 to the fourth quarter in 2006, giving a total of 16 quarters in all. In executing the proposed stock forecasting and portfolio selection mechanism, the total capital available for investment was assumed to be NT$1,000,000.
4.2. Verification of optimized portfolio selection model In the following discussions, the validity and effectiveness of the proposed stock forecasting and portfolio selection mechanism is evaluated by way of 3 illustrative examples. Because that the classification results obtained through RS theory could profoundly affect he performance of the proposed expert system for selecting stock portfolio. Therefore, it commences with an example showing the validity and effectiveness of the enhanced clustering / classification method based on Huang-index function. The proposed clustering method is evaluated by an illustrative example relating to electronic stock data for the first quarter of 2006. A specified set of stock items are collected automatically every quarter and 53 financial indices associated with each stock item are obtained from the TEJ. However, for reasons of practicality, the performance analyses performed in this present case were restricted to just 8 conditional attributes and 1 decision attribute. A total of 307 records were obtained (See Table 1 for indicative values of each ratio for a selected subset of these 307 records) as the records for which some of the financial data was incomplete had deleted. The enhanced clustering / classification method provides the means to discretize the continuous values of the separate attributes within a dataset and to classify datasets where the records do not provide any category information. In contrast, supervised classification methods cluster attributes based on a consideration of category information. There are currently no classifiers available for the supervised classification of datasets with no category (class) information. Consequently, it is not possible to set up a straight comparison between the classification performance obtained by the enhanced classification method and those obtained from a supervised method. Therefore, in this illustrative example, the classification performance of the enhanced classification method is compared with those of pseudo-supervised decision-tree classification method, in which pseudo-category information is joined to a dataset which originally lacks category information. The pseudo-category information is obtained by applying the enhanced classification method to the target dataset in order to recognize the optimal number of clusters for the decision attribute. The I max function presented in Section 2.2 is then used to acquire the suitable decision attribute cluster for each record in the dataset. The resulting cluster index is then treated as pseudo-category information for the record. The optimal number of clusters for the decision attribute in this dataset is equal to 10, and therefore the pseudocategory information joined to the dataset to facilitate discretizing using the decision-tree classification method has a value in the interval [1, 10]. In this illustrative example, these two classification methods are used to classify training and testing datasets based upon a common k -fold subsample ( k =10) of the stock market dataset. Of the k subsamples, one subsample was held for use as validation data in testing the method, while the remaining k − 1 subsamples were used as training data. The classification performance of the two methods is assessed in terms of the classification accuracy (CA). For the case of the enhanced classification method, CA is defined as the ratio of the entire cardinality of the lower approximation sets in terms of each cluster of the decision attribute to the total C
number of samples in the dataset, i.e. R( X ) U . Meantime for the pseudo-supervised decisionc 1
tree classification method, the CA is defined as the ratio of the number of records for which the measured category information is identical to the added pseudo-category information to the total number of records in the dataset. The CA, the average CA and the deviation of the CA obtained for the training and testing datasets by these two classification methods are shown in Table 2. It can be found that the CA obtained for each training data and testing data obtained by the enhanced classification method is higher than those by the pseudo-supervised decision-tree classification method. Meanwhile, it can be seen that the enhanced
- 233 -
An Enhanced Approach to Optimizing the Stock Portfolio Selection based on Modified Markowitz MV Method Kuang Yu Huang, Chuen-Jiuan Jane, Ting-Cheng Chang Journal of Convergence Information Technology, Volume 6, Number 2. February 2011
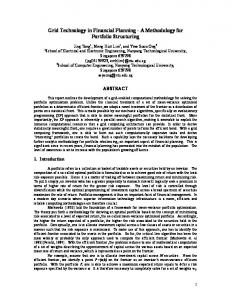
classification method yields an average CA of 0.901 for the training dataset and 0.987 for the testing dataset. In contrast, the pseudo-supervised decision-tree classification method yields average CAs of 0.591 and 0.293 for the training dataset and testing dataset, respectively. In other words, the average CA obtained by the enhanced classification method is higher than those obtained by the pseudosupervised decision-tree classification method for both datasets, respectively. In addition, it is seen that the lowest CA values obtained through the enhanced classification method for the training and testing datasets (i.e. 0.830 and 0.933, respectively) are higher than those obtained through the pseudosupervised decision-tree classification method. Consequently, the performance of the enhanced classification method in optimizing the accuracy of RS classification using a RS classification model is superior to those of the pseudo-supervised classification decision-tree method where a pseudo number of clusters is assigned to the decision attribute, respectively. In the second illustrative example, executing the GRA stock priority module, two stocks (corresponding to company codes 2393 and 2441, respectively) are selected in the fourth quarter in 2006. Figures 2(a)~2(c) illustrate the corresponding results obtained from the MV and M-MV models for the efficient frontier, the correlation between the expected return and the portfolio allocation, and the correlation between the expected risk and the portfolio allocation, respectively. Note that in Figures 2(b) and 2(c), the Weight1 and Weight2 axes indicate the relative percentage of the total capital (NT$1,000,000) invested in the 2393 stock and the 2441 stock, respectively. ( insert Figure 2 (a) here) As shown in Figure 2(a), the efficient frontier derived using the standard (unconstrained) Markowitz MV method has the form of a continuous convex shaped curve. Furthermore, it is observed that the points along the constrained efficient frontier derived using the M-MV model are a subset of those along the unconstrained frontier. These points are a subset of those along the unconstrained frontier by incorporating constraints on the proportion of the total available capital allocated to each stock within the portfolio. Meanwhile, Figures 2(b) and 2(c) show that both the return and the risk increase as a greater proportion of the total capital is invested in the 2393 stock. (insert Figure 2(b) here) (insert Figure 2(c) here) In the third illustrative example, the rate of return on a portfolio consisting of five selected stocks in the 9 investment periods between 2004 and 2006 is compared for three different stock selection models, namely pre-determined cluster based stock selection scheme [8], the fixed allocation proportion model n i 1 , where i is the grey relation order of each stock item, and n is the total ( stock weight (i ) i in
number of invested stocks), and the constrained M-MV model at the points of lowest expected risk on the corresponding frontier curve, respectively. The corresponding results are presented in Table 3. It can be shown that the accumulated rate of return attained using the proposed M-MV portfolio allocation model (90.02%) is higher than that attained using the pre-determined clustering based scheme (82.45%) or the fixed allocation proportion method. Overall, the results presented in Table 3 confirm the efficacy of the modified M-MV model in enhancing the rate of return relative to that achieved using the pre-determined clustering based scheme or fixed allocation proportion model. Thus, the overall viability and effectiveness of the proposed stock selection system is validated. (insert Table 3 here)
5. Conclusions This study has developed an expert system for predicting the future behavior of the stock market and constructing portfolios which will result in the maximum rate of return. In the proposed approach, a suitable selection of stocks for possible inclusion in the portfolio is identified using a ARX prediction model, a multivariate GM(1,N) model , a clustering / classification method based on Huang-index function, RS classification model and a hybrid GRA / MV Markowitz model. In this paper, we confirm the validity of the enhanced clustering / classification method and demonstrate the feasibility of the proposed hybrid GRA / MV Markowitz model which is employed to determine the optimal portfolio given a specified
- 234 -
An Enhanced Approach to Optimizing the Stock Portfolio Selection based on Modified Markowitz MV Method Kuang Yu Huang, Chuen-Jiuan Jane, Ting-Cheng Chang Journal of Convergence Information Technology, Volume 6, Number 2. February 2011
number of stocks within the portfolio and constraints on the ranking relationship between the proportions of the total available capital allocated to each stock within the portfolio. The major findings of this study can be summarized as follows: 1. The enhanced clustering / classification method based on Huang-index function in the proposed expert system for selecting stock portfolio is applicable to continuous valued datasets where the records do not provide any class information and may be imprecise and vague. It is not possible to establish a direct comparison between the classification results of the enhanced clustering / classification method and those of supervised methods since supervised methods rely on class information to cluster the attributes. However, it has been shown that the accuracy of classification of the enhanced clustering / classification method is better than those of pseudo-supervised decision-tree classification method when applied to a dataset to which pseudo-class information is joined to each record in order to facilitate classification. 2. The points lying on the efficient frontier obtained using the M-MV model are a subset of those on the efficient frontier obtained using the MV model since the former model differs from the latter only in terms of its inclusion of some additional un-equivalent allocation constraints. 3. The rate of return obtained using the constrained M-MV portfolio allocation model is higher than those obtained using the pre-determined clustering based scheme or fixed allocation proportion model. The results presented in this study have confirmed that the proposed expert system for stock forecasting and M-MV portfolio selection mechanism provides an effective tool for assisting investors in anticipating the future trends of the stock market and constructing optimal portfolios which maximize the rate of return whilst simultaneously reducing the level of investment risk. A future study will investigate the feasibility of obtaining further improvements in the rate of return on the investment portfolio by utilizing a Variable Precision Rough Set (VPRS) technique to accomplish the stock selection process prior to the M-MV portfolio allocation process.
6. References [1] Md. Ra.ul Hassan, Baikunth Nath, Michael Kirley, “A fusion model of HMM, ANN and GA for stock market forecasting”, Expert Systems with Applications, vol.33, pp. 171-180, 2007. [2] Jandaghi Gholamreza, Tehrani Reza, Hosseinpour Davoud, Gholipour Rahmatollah, Shadkam Seyed Amir Shahidi, “Application of Fuzzy-neural networks in multi-ahead forecast of stock price”, African Journal of Business Management, vol.4, no.6, pp. 903-914, 2010. [3] G. E. P. Box, G. M. Jenkins, Time series analysis: forecasting and control. San Fransisco, CA: Holden-Day, 1976. [4] Y. C. Tse Raymond , “An application of the ARIMA model to real estate prices in Hong Kong”, Journal of Property Finance, vol.8, no.2, pp.52-163, 1997. [5] C. Skalko. “Rough sets help time the OEX”, Journal of Computational Intelligence in Finance, vol.4, no.6, pp.20-27, 1996. [6] Xue Deng, Junfeng Zhao, Lihong Yang, Rongjun Li, “Constraint Method for Possibilistic Meanvariance Portfolio with Transaction Costs and Lending”, JCIT: Journal of Convergence Information Technology, vol. 5, no. 9, pp.73 - 84, 2010. [7] Kuang Yu Huang, “Applications of an Enhanced Cluster Validity Index method based on the Fuzzy C-means and Rough Set Theories to Partition and Classification”, Expert Systems With Applications, vol.37, pp.8757-8769, 2010. [8] Kuang Yu Huang, Chuen-Jiuan Jane, “A Hybrid Model for Stock Market Forecasting and Portfolio Selection Based on ARX, Grey System and RS Theories”, Expert Systems With Applications, vol.36, pp.5387-5392, 2009. [9] Fern á ndez Alberto, G ó mez Sergio, “Portfolio selection using neural networks”, Computers & Operations Research, vol.34, pp.1177-1191, 2007. [10] Ehrgott Matthias, Klamroth Kathrin, Schwehm Christian, “An MCDM approach to portfolio optimization”, European Journal of Operational Research, vol.15, pp.752-770, 2004.
- 235 -
An Enhanced Approach to Optimizing the Stock Portfolio Selection based on Modified Markowitz MV Method Kuang Yu Huang, Chuen-Jiuan Jane, Ting-Cheng Chang Journal of Convergence Information Technology, Volume 6, Number 2. February 2011
[11] R-G Hagstrom, B, Fisher K. L. Miller, The Warren Buffett Way: Investment Strategies of the World's Greatest Investor. JOHN WILEY & SONS (ASIA) PTE LTD, 2005. [12] J.L. Deng, “Introduction to Grey System Theory”, The Journal of Grey System, vol.1, no.1, pp.124, 1989. [13] Chaang-Yung Kung, Kun-Li Wen, “Applying Grey Relational Analysis and Grey DecisionMaking to evaluate the relationship between company attributes and its financial performance-A case study of venture capital enterprises in Taiwan”, Decision Support Systems, vol.43, pp.842852, 2007. [14] Yang-Cheng Lina, Hsin-Hsi Laib, Chung-Hsing Yeh, “Consumer-oriented product form design based on fuzzy logic: A case study of mobile phones”, International Journal of Industrial Ergonomics, vol.37, pp.531-543, 2007. [15] Juchi Hou, “Grey Relational Analysis Method for Multiple Attribute Decision Making in Intuitionistic Fuzzy Setting”, JCIT: Journal of Convergence Information Technology, vol. 5, no. 10, pp.194-199, 2010. [16] Yi-Chung Hu, “Grey relational analysis and radial basis function network for determining costs in learning sequences”, Applied Mathematics and Computation, vol.184, pp.291-299, 2007. [17] Ming-Chang Lee, “An Enterprise Financial Evaluation Model Based on Rough Set theory with Information Entropy”, JDCTA: International Journal of Digital Content Technology and its Applications, vol. 3, no. 1, pp.16-22, 2009. [18] Kuang Yu Huang, “A Hybrid Particle Swarm Optimization Approach for Clustering and Classification of Datasets”, Knowledge-Based Systems, vol. 24, pp. 420-426, 2011. [19] Kuang Yu Huang, C-J Jane, Ting-Cheng Chang, “A novel approach to enhance the classification performances of grey relation analysis”, Journal of Information & Optimization Sciences, vol.29, no.6, pp.1169-1191, 2008. [20] H. Markowitz, “Portfolio selection”, Journal of Finance, vol.7, pp.77-91, 1952. [21] Xue Deng, Junfeng Zhao, Lihong Yang, Rongjun Li, “Possibilistic mean-variance utility to portfolio selection for bounded assets”, JDCTA: International Journal of Digital Content Technology and its Applications, vol. 4, no. 6, pp. 150-160, 2010. [22] Ehrgott Matthias, Klamroth Kathrin, Schwehm Christian, “An MCDM approach to portfolio optimization”, European Journal of Operational Research, vol.15, pp.752-770, 2004. [23] Chakravarti, Laha, Roy, Handbook of Methods of Applied Statistics, vol. I, John Wiley and Sons, 1967. [24] Kuang Yu Huang, “Application of VPRS model with enhanced threshold parameter selection mechanism to automatic stock market forecasting and portfolio selection”, Expert Systems With Applications, vol.36, pp.11652-11661, 2009.
- 236 -
An Enhanced Approach to Optimizing the Stock Portfolio Selection based on Modified Markowitz MV Method Kuang Yu Huang, Chuen-Jiuan Jane, Ting-Cheng Chang Journal of Convergence Information Technology, Volume 6, Number 2. February 2011
Renew the Attributes Determination
Start
Data collection and attribute determination Data preprocessing ARX prediction Information reduction using GM(1,N) multivariate model Clustering attributes using clustering method based on Huangindex function
Selection of approximate sets Fund allocation Modeling applicable To Proceed next quarter investment
Yes
No
Yes To continue investment
No
End
Figure 1. Flow chart of forecasting and stock selection model
Figure 2 (a). MV and M-MV efficient frontiers for portfolio containing two stocks ( 2393 and 2441).
- 237 -
An Enhanced Approach to Optimizing the Stock Portfolio Selection based on Modified Markowitz MV Method Kuang Yu Huang, Chuen-Jiuan Jane, Ting-Cheng Chang Journal of Convergence Information Technology, Volume 6, Number 2. February 2011
Figure 2(b). Variation of rate of return with portfolio allocation ratio.
Figure 2(c). Variation of expected risk with portfolio allocation ratio.
Table 1. Illustrative financial data extracted from TEJ database for first quarter in 2006 Code of companies
(a)
(b)
(c)
(d)
(e)
(f)
(g)
(h)
(i)
1
-23.4
31.22
54.62
0.07
-0. 43
0.57
54.63
276.99
-0.03
2
4.14
7.86
3.72
0.231
1.23
2.34
92.52
37.07
-0.58
3
0.75
0.11
-0.65
0.01
0.73
0.11
87.63
19.39
2.01
…
…
…
…
…
…
…
305
10.22
11.99
1.77
1.50
12.79
15.01
33.09
37.68
4.01
306
5.27
7.54
2.26
0.94
6.50
9.28
62.95
18.6
5.17
307
2.38
-1.42
-3.79
-0.18
3.04
-1.81
26.67
49.74
-2.88
…
The attributes of columns are (a) Business Profit Rate (b) Pre-Tax Income % (c) Net Non-op.Inc./Rev. (d) PS-Pre_Tax Income (e) Oper.Income/Capital (f) Pre Tax Income/Capital (g) Days-A/R Turnover (h) DaysInventory Turn. (i) EPS-Net Income
- 238 -
An Enhanced Approach to Optimizing the Stock Portfolio Selection based on Modified Markowitz MV Method Kuang Yu Huang, Chuen-Jiuan Jane, Ting-Cheng Chang Journal of Convergence Information Technology, Volume 6, Number 2. February 2011
Table 2. Comparison of classification accuracy (CA) obtained from clustering / classification method based on Huang-index function and pseudo-supervised decision-tree classification method for 10-fold subsamples. i th subsamples 1 2 3 4 5 6 7 8 9 10 average CA deviation of CA
clustering / classification method based on Huang-index function training dataset testing dataset 0.920 1.000 0.978 1.000 0.888 1.000 0.891 1.000 0.830 1.000 0.884 0.935 0.931 1.000 0.884 0.933 0.884 1.000 0.921 1.000 0.901 0.987 3.92% 2.77%
#Pseudo-supervised decision-tree classification method training dataset testing dataset 0.558 0.323 0.565 0.129 0.605 0.290 0.627 0.387 0.551 0.484 0.612 0.226 0.543 0.194 0.599 0.267 0.653 0.333 0.599 0.300 0.591 0.293 3.45% 9.99%
Table 3. Rates of return obtained using three different stock selection models based on the predetermined cluster based stock selection scheme, Fixed allocation proportion, MV and M-MV efficient frontier curves, respectively. *Pre-determined cluster based stock selection scheme the year rate of rate of return return
Fixed allocation proportion model
M-MV model
rate of return
the year rate of return
rate of return
the year rate of return
-0.09%
11.87%
-3.15%
9.67%
2004 Second quarter
-2.58%
2004 Third quarter
-0.92%
-1.41%
-5.31%
2004 Fourth quarter
21.02%
13.38%
18.14%
2005 Second quarter
11.88%
2005 Third quarter
0.67%
0.43%
-0.19%
2005 Fourth quarter
13.35%
10.56%
16.95%
2006 Second quarter
10.35%
2006 Third quarter
1.15%
5.00%
11.91%
2006 Fourth quarter
27.48%
34.70%
29.63%
Accumulated 3 years rate of return
82.45%
77.65%
90.02%
Average year rate of return
17.57%
25.90%
38.98%
27.48%
14.96%
0.13%
25.95%
39.82%
25.88%
19.94%
2.10%
36.70%
43.65%
30.01%
*Note: This column gives the results from the paper published by the current authors in Expert Systems with Applications 36: 5387-5392 [8].
- 239 -