Using Multiple Feature Extraction Techniques. Rafael M. O. Cruz, George D. C. Cavalcanti and Tsang Ing Ren. AbstractâThis paper presents a novel approach ...
An Ensemble Classifier For Offline Cursive Character Recognition Using Multiple Feature Extraction Techniques Rafael M. O. Cruz, George D. C. Cavalcanti and Tsang Ing Ren
Abstract— This paper presents a novel approach for cursive character recognition by using multiple feature extraction algorithms and a classifier ensemble. Several feature extraction techniques, using different approaches, are extracted and evaluated. Two techniques, Modified Edge Maps and Multi Zoning, are proposed. The former one presents the best overall result. Based on the results, a combination of the feature sets is proposed in order to achieve high recognition performance. This combination is motivated by the observation that the feature sets are both, independent and complementary. The ensemble is performed by combining the outputs generated by the classifier in each feature set separately. Both fixed and trained combination rules are evaluated using the C-Cube database. A trained combination scheme using a MLP network as combiner achieves the best results which is also the best results for the C-Cube database by a good margin.
I. I NTRODUCTION Cursive character recognition is one of the most important areas in the field of pattern recognition. This importance is due to many potential applications such as post mail sorting, bank check analysis and so forth. The major problem in a cursive character recognition system is the diversity of the handwriting styles, which can be completely different for different writers. This variability is so evident that some systems can identify the writer based on a handwritten text [1], [2], [3]. Even the same writer can change his writing style due to variation on neurological conditions, type of the pen and position [2]. These conditions make this one of the most challenging problems in the computer vision field. Another problem in this application is the high number of classes to be considered, 52 different classes (26 lower case and 26 upper case letters) which increases the number of misclassifications between classes making this a more complicated problem when compared to handwritten digit recognition which has only 10 classes. For handwritten digit recognition, recent works show a recognition rate superior to 99%. For character recognition the highest rates are around 90%. Therefore, breakthrough improvements can still be done [4]. The selection of the feature extraction algorithm is known to be an important factor in determining the performance of the recognition system [5]. In this paper, nine feature extraction methods are evaluated using MLP networks as classifier. Two of these methods are modified versions, proposed by the authors of this paper. The others were published in previous works and proved to be successful. The results confirms the Rafael M. O. Cruz, George D. C. Cavalcanti and Tsang Ing Ren are with Center of Informatics, Federal University of Pernambuco, Recife, Brazil. Email: {rmoc,gdcc,tir}@cin.ufpe.br. Site: www.cin.ufpe.br/∼viisar
978-1-4244-8126-2/10/$26.00 ©2010 IEEE
fact that the feature extraction algorithm is one of the most (if not the most) important factor on the performance of the system. An ensemble system using the nine feature extraction methods evaluated is proposed in order to achieve high recognition rates. This is made by combining the classifiers that are trained on different features sets. The idea of combining different features spaces comes from the observations made that the combination of classifiers in different feature spaces is the most effective way of combining classifiers and usually presents better results than any base classifier [6]. This occurs because each feature extraction method extracts different information from the image that are both independent and complementary. For this purpose a diverse set of feature extraction methods using different approaches like Edges, Projections, Gradient, Concavities were selected. This diversity plays an important role in the performance of the ensemble system. The experiments were conducted using the new C-Cube database [7]. Two different tests were performed. First splitting the set into lower case and upper case sets and other using the whole set but joining some lower and upper case letters in the same class. All feature sets are evaluated and the results show the performance of the system greatly varies according to the feature set used. The results obtained show the combination of different feature sets improves the system performance. A combination module using a MultiLayer Perceptron (MLP) network is proposed to perform the combination of the feature sets, achieving the highest performance for this database. The main contributions of this paper are: 1) Evaluate several feature extraction algorithms using the same conditions (i.e., the same database/methodology); 2) Propose a modified version of the algorithms Edge Maps and Zoning for a better performance; 3) Propose an ensemble classifier, for the given task, using a diverse set of feature extraction techniques aiming to achieve high recognition rates. This paper is organized as follow: In Section II, the feature extraction algorithms are briefly introduced. In Section III, the C-Cube database is described. In Section IV, the results obtained by each feature set is analyzed. The ensemble classifier system and its results are presented in Section V. An analysis of the error is made on Section VI. Conclusion is given on the final section.
II. F EATURE E XTRACTION Feature extraction can be defined by the extraction of the most important information to perform the classification for a given task [8]. There are several feature extraction techniques proposed and its choice can be considered the most important factor to achieve high accuracy rates [5]. The algorithms used in this work are summarized below. Two of them, Multi Zoning and the Modified Edge Maps, are proposed by the authors of this paper. Evaluation of these methods are made on the results section.
algorithm does not computes the percentage of black pixel per sub-image, instead it uses the value of the pixels as features.
A. Feature Set I: Structural Characteristics This algorithm consists in extracting histograms and profiles, combining then in a single feature vector. The input image is scaled in a 32 × 32 matrix. Horizontal and vertical histograms are computed by the number of black pixels in each line and column, respectively. Radial histogram is computed by the number of black pixels in 72 directions at 5 degree intervals. Example of the histograms for a character f are shown in Figure 1. Radial In-Out and Radial Out-In profiles are calculated by the position of the first and the last black pixel, respectively, that starts from the center and goes to the border in 72 directions at 5 degree intervals. These features form a 280-dimension (32 + 32 + 72 + 72 + 72) feature vector. Details can be found in [9].
Fig. 2. Example of thinning for a character 1. (a) Original image, (b) Thinned image, (c) vertical edges, (d) Horizontal edges, (e) −450 edges, (f) 450 edges
C. Feature Set III: Image Projections
Fig. 1. Example of Histograms for a character f.(a) Horizontal Histogram, (b) Vertical Histogram, (c) Radial Histogram
B. Feature Set II: Modified Edge Maps An M × N image is thinned and scaled into a 25 × 25 matrix. The Sobel operators are used to extract four distinct edge maps: horizontal, vertical and two diagonals (45◦ and −45◦ ). These four maps and the original image are divided into 25 sub-images of 5 × 5 pixels each. The features are obtained calculating the percentage of black pixels in each sub-image (25 features per image). The features are combined to form a single feature vector containing 125 (25 × 5) features. This algorithm is a modified version of the Edge Maps proposed by Chim et al. [10]. The original
This method consists of extracting the radial and diagonal projections. To extract the radial projections, the image must first be divided into four quadrants: top, bottom, right and left. The quadrants are used to remove rotational invariance which is clearly undesirable in handwritten digit recognition. Radial projections are obtained by grouping pixels by its radial distance to the center of the image in each quadrant separately. The diagonal projection is computed simply by grouping pixels by the two diagonal lines (45◦ and −45◦ ). More details can be found in [10]. The values of each projection are normalized to a range [0; 1] through the division by the maximum value. The normalized features are concatenated in a single vector containing 128 features (16 for each radial projection and 32 for each diagonal projection). D. Feature Set IV: Multi Zoning In this algorithm, an M ×N character image is divided into several sub-images and the percentage of black pixels in each sub-image is used as feature. To achieve better recognition performance, many different configurations of division were selected and concatenated to form the feature vector. A total
of 13 different configurations (3 × 1, 1 × 3, 2 × 3, 3 × 2, 3 × 3, 1 × 4, 4 × 1, 4 × 4, 6 × 1, 1 × 6, 6 × 2, 2 × 6 and 6 × 6) were chosen, resulting in 123 (3 + 3 + 6 + 6 + 9 + 4 + 4 + 16 + 6 + 6 + 18 + 18 + 36) features.
Fig. 4. (a) Concavities Measurement, (b) feature vector, (c)Auxiliary directions, (d)Main directions [Adapted From [11]] Fig. 3.
Example of multiples divisions
E. Feature Set V: Concavities Measurement The following steps are used to measure the concavities. Firstly the image is scaled into a 18 × 15 matrix. The image is divided in six zones, each one containing its own 13-dimension feature vector. Each position of the feature vector corresponds to one of the possible configurations, i.e., number of black pixels reached and its directions. For each white pixel, the algorithm search in the four main directions the number of black pixels that it can reach as well as the directions that a black pixel is not reached. The main directions are shown in Figure 4(d). If a black pixels is reached in the four directions, a new search using the auxiliary directions is made. Auxiliary directions are shown in Figure 4(c). The position on the feature vector which is related to the configuration found in the search is incremented. The feature vector is presented in Figure 4(b). The feature vectors of each zone are combined in a single vector with 78 (13 × 6) features. A detailed version of the algorithm can be found in [11].
For each pixel, amplitude r (i, j) and phases Θ (i, j) are computed using the equations below: q 2 (i, j) + I 2 (i, j) r (i, j) = Im (3) my x Θ (i, j) = tan−1
2 (i, j) Im y 2 (i, j) Im x
(4)
For each pixel with non-zero magnitude, the gradient direction is quantized into one of eight directions at π/4 intervals. The image is divided into 16 equally spaced subimages and for each sub-image the number of pixels in each of the eight directions is used as feature. Thus, the feature vector size is 128 (16 sub-images × 8 directions). Details can be found in [12]. G. Feature Set VII: Gradient directional features This algorithm computes the gradient components in a binary image. The gradient is computed using the same steps from the MAT-based method above but using the binary image. Details can be found in [12].
F. Feature Set VI: MAT-Based Gradient directional features
H. Feature Set VIII: Median Gradient features
This algorithm computes the gradient components in a grayscale image. Grayscale images are used because they have richer information than a binary image for discrimination [12]. Thus, before start the algorithm, a binary input image is first transformed into a pseudo-grayscale image using the Medial Axial Transformation (MAT) algorithm. With the pseudo-grayscale image, the Sobel horizontal Sx and vertical Sy operators [13] are applied to the pseudograyscale image Im generating the X-gradient image Imx and the Y-gradient image Imx .
This algorithm first filters the base image by a 2D median filter before extracting the gradient. For this algorithm, the Robert Operators [13], instead of Sobel, are applied to the filtered image to generate the amplitudes and phases. The gradient is computed using the same steps from the methods above, thereafter a feature vector consisting of 128 features is extracted. Details can be found in [12].
Imx = Im ∗ Sx
(1)
Imy = Im ∗ Sy
(2)
I. Feature Set IX: Camastra 34D Features This algorithm was proposed by Camastra [4]. The image is divided into 16 cells forming a 4x4 grid with a little overlapping between the cells. This overlapping is important in order to achieve shift invariance. For each cell two operators are computed. The first is similar to the zoning algorithm, it computes the number of black pixels (foreground) for each
sub-image in relation to the total number of black pixels in the whole image. The difference is that in the Zoning algorithm, the number of black pixels is computed in relation to the number of pixels in each zone. The second is a directional operator that estimates the directions the pixels are aligned. The method defines N equally spaced lines on the selected direction and the number of black pixels in each line nj is computed. The same steps are made for the orthogonal direction. The differences between the selected direction and the orthogonal direction in each cell is used as features. The directions selected in this implementation was 0◦ with its orthogonal direction 90◦ . It results in a feature vector with 32 values. Two additional information are used as global features: The width/height ratio and the fraction of the character that is below the baseline. Therefore the final vector consists of 34 features.
more difficult division of the database, with results around 3 percentile points lower when compared to Split A. The feature vectors files that correspond to the Split B are available on the following website: http://www.idiap.ch/ ~vincia/ccc/, under the names testOrdered.vec and trainingOrdered.vec. These files perfectly match the image files test.chr and training.chr that are available on the C-Cube website. In this work only the Split B was used for the experiments because the image files of the Split A are not available.
III. C-C UBE DATABASE The C-Cube database is a public database available on the Cursive Character Challenge website1 . The database consists of 57.293 images, including both upper and lower case letters, manually extracted from the CEDAR and United States Post Service (USPS) databases. As reported by Camastra et al. [7], this database presents three advantages: 1) The database is already divided into training and test sets, so results of different researchers can be rigorously compared; 2) the database contains not only images but also their feature vectors extracted using the algorithm proposed by Camastra [4]; 3) The results obtained using the state of the art methods still leave space for significant improvements. The dataset is divided into 38.160 (22.274 lower case and 15.886 upper case) images for training and 19.133 (11.161 lower case and 7.972 upper case) images for test. All image are binary and with variable size. For each image, additional information are provided such as distance between baseline and upper line, distance of the upper extreme from the baseline and distance of the lower extreme from the baseline. The number of samples for each class is variable and were selected according to its frequency in documents extracted from the CEDAR and USPS datasets. Figures 5 and 6 show the distribution of the letters in the lower and upper case versions, respectively. It can be seen that there is a big difference in the number of pattern among the letters. Thornton et al. [14] observed, through reverse engineering, that the image files (test.chr and training.chr) do not correspond to the feature vectors (test.vec and training.vec) available on the C-Cube website. The feature vectors are from a different split of the database (i.e., some images are on the training set in one split and in the test set in the other). For this reason Thornton et al. [14] denominated the dataset of the feature vectors files (training.vec and test.vec) as Split A and the dataset of the image files (test.chr and training.chr) as Split B. It was also proved that the Split B consists in a 1 http://ccc.idiap.ch/
Fig. 5.
Lower case letter distribution in the C-Cube Database
Fig. 6.
Upper case letter distribution in the C-Cube Database
IV. E XPERIMENTS AND R ESULTS All the experiments were conducted using a three layers MLP trained using the Resilient Backpropagation [15] algorithm. The rprop algorithm was chosen because it presented both a faster convergence and better results when compared to the conventional Backpropagation. For each feature set, the number of nodes in the hidden layer were selected using the crossvalidation method [16]. The training was conducted
splitting the training set into 30.660 patterns for training and 7.500 for validation. For each feature set, the additional information provided by the database, i.e., the width/height ratio were added to the feature vector as global features. These global features contributed to an average increase between 1 and 2 percentile points in the recognition rate for all feature sets studied. For the Camastra feature set, the same vectors available on the website (trainingOrdered.vec and testOrdered.vec) were used without any modification. Two different experiments were made: First splitting upper and lower cases and other experiment with both. For the latter, as some letters present the same shape in both upper and lower case versions, they were joined into a single class. Camastra [4] used a clustering analysis to verify whether the upper and lower case versions of the same letters are similar in shape. The letters (c,x,o,w,y,z,m,k,j,u,n,f,v) presented the highest similarity between the two versions and were joined into a single class. The results for the split and joined cases are shown in Tables I and II, respectively. The results are ordered by the recognition rates. The proposed Modified Edge Maps algorithm presented the overall best result. Most feature sets presented better accuracy for the upper case letters with the exception of the method proposed by Camastra that performed better for lower case letters. This feature set also presented the best accuracy (84.37%) for the lower case letter. It can be seen that the methods based on gradients and the modified edge maps presented the best results. These methods have in common the use of directional information. The Camastra 34D feature set also uses directional features. TABLE I R ECOGNITION R ATE BY F EATURE S ET FOR THE U PPER
AND
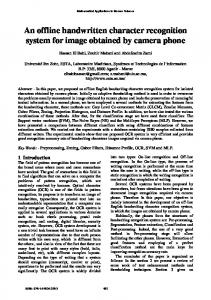
in past years as an alternative to increase efficiency and accuracy [17], [18], [19]. The main motivation for using classifier ensemble in the given task comes from the observation that the errors made by the classifiers with different feature extraction methods do not overlap. Another motivation comes from the divide and conquer paradigm, i.e., using each feature extraction method separately and combining their results instead of use a single set consisting of all feature sets. The advantage in combining classifiers working on different feature sets comes from the fact that they are a different transformation of the image to the feature space. That way, a pattern might be hard to classify in one feature set because it can be near the decision boundary. And that task should still be hard when using multiple classifiers over the same feature space. Using different feature spaces, this pattern might be close to the decision boundary in one feature space, but for the others, as it is a completely different transformation, the same pattern might be distant to the decision boundary, thus, can be easily recognized. The ensemble system is shown in Figure 7. It consists of nine feature sets presented above and a combination module. Both fixed and trained combination rules were used. The fixed combination rules used were: Sum, Product, Maximum, Median and Voting. The rules are briefly described below. For all definitions below, x is the input vector, i is the i-th class, and j is the j-th classifier. Pij (x) is the posteriori probability obtained by the j-th classifier for the i-th class with respect to the input x.
No. Nodes 490 490 300 360 400 450 320 530 500
Upper Case(%) 86.52 86.35 85.77 85.10 79.63 84.46 81.94 73.35 71.73
Lower Case(%) 81.13 79.89 79.22 79.48 84.37 78.07 77.70 81.89 79.90
Total(%) 83.55 82.58 81.95 81.81 81.74 80.74 79.53 76.90 75.10
No. nodes 490 490 300 360 400 450 320 530 500
MLP I
FS II
X2
MLP II
FS III
X3
MLP III
Y1(X1)
Recognition Rate(%) 82.49 81.46 80.83 79.96 79.97 78.60 77.07 74.90 73.85
V. E NSEMBLE S YSTEM Classifier combination methods (Classifier Ensemble/Mixture of Experts) have been widely studied
Y2(X2)
Y3(X3)
Combiner
TABLE II R ECOGNITION R ATE BY F EATURE S ET FOR THE J OINT C ASE Method Edge Binary Grad. MAT Grad. Median Grad. CAMASTRA 34D Zoning Structural Concavities Projections
X1
L OWER
C ASE S EPARATED Method Edge Binary Grad. MAT Grad. Median Grad. CAMASTRA 34D Zoning Structural Concavities Projections
FS I
FS IX
Fig. 7.
X9
MLP IX
Output
Y9(X9)
Classifier Ensemble System
A. Sum rule This rule is simply computed by adding the probabilities estimates obtained by each classifier and selecting the class with the highest value after the sum. This rule can reduce noise when the classifiers have a different noise behavior, thus achieving better performance [6]. The different noise behavior happens when classifiers are trained in different feature spaces or in the same feature space but using different
partitions of the training set. This rule can be denoted by the equation below. X Ci (x) ∼ argmax Pij (x) (5)
The results of each combination rule are shown in Table III for the split and in Table IV for the joint case. TABLE III R ECOGNITION R ATE BY F EATURE S ET FOR THE U PPER
B. Product Rule This rule obtains reliable confidence estimates when the classifiers are completely independent. The drawback of this rule is when one of the classifiers makes a estimation that is very small or even zero, leading to misclassification. The rule can be seen by the equation below. Y Ci (x) ∼ argmax Pij (x) (6)
AND
L OWER
C ASE S EPARATED
j
Method Sum Product Maximum Median Majority Vote MLP Network
Upper Case(%) 91.21 85.92 89.83 91.00 90.99 91.39
Lower Case(%) 86.94 79.52 85.22 87.33 87.44 88.45
Total(%) 88.72 82.37 87.14 88.86 88.92 89.67
TABLE IV R ECOGNITION R ATE BY C OMBINATION
RULE FOR THE J OINT
C ASE
j
C. Median Rule This rule is a robust version of the sum rule. It can be denoted by the equation below. Ci (x) ∼ M edj (Pij (x))
(7)
D. Max Rule This rule selects the classifier that have the maximum posterior probability, in other words, the classifier that is most confident in its answer. This can be seen as a classifier selection rule different than the others that are fusion rules. The problem using this approach occurs when some classifiers are over trained. The Maximum rule is denoted by the equation below. Ci (x) ∼ M axj (Pij (x))
(8)
E. Majority Vote Rule This rule works upon hard labels (i.e., classes instead of probabilities). It works simply by selecting the class that received the highest number of votes from the experts. F. Trained Combining Rule For the trained combining rule, a MLP network with one hidden layer was used. Trainined combiners usually presents better recognition rates as the combiner can adapt itself to the classification problem [6]. The MLP combiner was trained selecting 30.660 images from the training set for training and 7.500 images for validation. For each image, the posteriori probability are estimated in each feature set and used as features to the network. The additional information provided by the database as well as the width/height ration were also included. Thus, the network has 238 inputs (26 classes × 9 feature sets) + 4 global features for the split case and 355 inputs (39 classes × 9 feature sets)+4 global features for the joint case. The Resilient Backpropagation algorithm [15] was used to train the network. The number of nodes in the hidden layer was set to 300 in both experiments. The final system was built using the same MLP configurations presented in the experiments above.
Method Sum Product Maximum Median Sum Vote MLP Network
Recognition Rate(%) 88.39 85,92 85.48 87.23 87.55 89.34
It can be seen that all combination rules presented a significant gain when compared to any pair (feature extraction, classifier) exposed in Tables I and II. This gain can be explained by the fact that the combination was performed using different feature spaces. Combining different feature sets is known to be the most successful type of combination of classifiers and normally show better results than the base classifiers [6]. Other important point is that the feature sets used are based on different approaches (edges, projections, gradient, concavities). Thus, each feature set can extract information of the character image that are completely different. The product rule presented the worst result. This might be due to the fact that some of the combination rules presents a large difference in accuracy between some techniques and these rules have problems when at least one of the classifiers estimates a very small value. The trained MLP presented the best result in all cases. This can be explained by the fact that MLP networks are robust against noise and can give the correct answer even when some of the classifiers fail. The best results, obtained in the last years, for the C-Cube database are shown in Table V. The proposed combination scheme outperformed all the previous results on the Split B of the database by a good margin. Results using the Split A were not compared because the images of the Split A version of the database are not available on the website. It is also important to observe that all the past best results are based on Support Vector Machines (SVM) using the one-versusrest approach [20]. This method trains one specific classifier for each class. For this problem, a large number of classifiers would be required (26 in the best case, 52 in the worst one) which is one of the drawbacks of these approaches. The proposed system is the first to show high accuracy using Neural Networks.
TABLE V R ECOGNITION RATES FOR
THE
TABLE VI
C-C UBE DATABASE . RBF = R ADIAL
C HARACTERS W ITH
BASIS N ETWORK , HVQ = H IERARCHICAL V ECTOR Q UANTIZATION , MDF = M ODIFIED D IRECTIONAL F EATURES , SVM = SVM
Letter g p v z Q A F
WITH
R ADIAL BASIS K ERNEL Algorithm HVQ-32 [21] HVQ-16 [21] MDF-RBF [14] 34D-RBF [14] MDF-SVM [14] 34D-SVM + Neural GAS [4] 34D-MLP [4] This Paper
Recognition Rate(%) 84.72 85.58 80.92 84.27 83.60 86.20 71.42 89.34
One of the advantages of the proposed ensemble system is the parallel architecture as each feature extraction algorithms can be processed independently. This is a great advantage in computational time when compared to hierarchical or cascade approaches. The ensemble system, using the MLP combiner, has an average computation time of 9ms per character on a 2.40-GHz machine with 4 cores and 4GB of RAM, including the extraction of all the features sets and classification. The system was developed using the C++ language for high performance. Information about performances on others system were not provided for comparison. VI. A NALYSIS OF E RRORS The characters with the highest error rates are shown in Table VI. The majority of these characters, g, p, v, z and Q are the ones that have few patterns on the whole dataset as demonstrated in Figure 5. The network could not learn how to classify these patterns because of the unbalanced number of patterns between different classes. This explains the high error rates for these letters. For the character p, which is the character with the lowest number of image in the database, there are only 9 images in the training set and 4 images in the test set. All the 4 test images of this character were misclassified due to the low number of samples in the database. To solve this issue, a possible solution is to create new patterns, for the unbalanced classes, using some approaches that are widely used in handwritten digit recognition like elastic distortions [22], [23] and affine transformations [24]. The case of the characters A and F is different. These letters have two completely different writing style for their upper case version as shown in Figure 8. It can be seen that the shapes are very different. The majority of error for the uppercase A happened in the shape shown in Figure 8(a) when the version shown in Figure 8(b) is much more common in the database. The same happens to the upper case F that presented the majority of errors for the form shown in Figure 8(c) and the database has much more patterns written using the other form. A possible solution to this issue is to have two classes to represent both variations of the upper A and two classes to represent both variations of the upper F. Thus, the dataset can be better represented, improving the performance of the system.
Fig. 8.
THE
H IGHEST E RROR R ATES
No. Errors 39 4 35 5 7 119 41
(%) 30.00 100.00 52.23 64.43 38.88 25.00 24.84
Different shapes for the upper case version of the letters A and F
Some of the misclassified images by the proposed system are shown in Figure 9. Below each image is its ID, the target class and the classification made by the combination scheme using the MLP network as combiner. Based on these images, it can be seen that many of the misclassifications were made in characters that are quite ambiguous. Many of them are hard to be recognized, even by humans. Some patterns clearly present problems either by noise, large distortions, peculiar writing style and there are also problems made during the segmentation process as can be seen in the image with ID 9004. To increase the reliability of the system, a strategy to reject these ambiguous images must be investigated. On the other hand, some of the characters can be easily recognized by humans. Therefore, the recognition rate in this database can still be improved. VII. C ONCLUSIONS In this paper, a method to increase cursive character recognition rates by combining feature extractions methods is proposed. Nine feature sets, two proposed by the authors of this paper, are extracted and evaluated. The feature sets were chosen using different approaches to add diversity to the system. The experiments demonstrated that the performance using different feature extraction algorithms can be very different. The proposed Modified Edge Maps algorithm presented the highest result among the feature sets. The proposed Multi Zoning also presented a good result. A classifier ensemble consisting of the nine feature sets was proposed. Some of the most common combination rules were evaluated as well as one trained rule. The results showed all combination rule greatly improved the recognition performance. The experiment using a MLP as a trained combiner achieves the highest recognition rate, indicating that trained combining rules
Fig. 9.
Example of misclassified images
performs better than fixed rules. A comparison with recent studies were made and the proposed system outperformed all the previous results. It was detected that some of the characters that presented the highest error rates are either letters that have only few samples in the database or characters that have two completely different forms, being one of them unbalanced. Many other images are ambiguous either by segmentation problems, high distortions or peculiar writing style. Some ideas to tackle these problems and improve the reliability of the system were discussed and are subjects for future works. ACKNOWLEDGMENT This work was supported in part by the Brazilian National Research Council CNPq and by FACEPE - Fundação de Amparo à Ciências e Tecnologia do Estado de Pernambuco. R EFERENCES [1] A Schlapbach, Writer Identification and Verification, Ph.D. thesis, University of Bern, Switzerland, 2007. [2] Lambert Schomaker and Marius Bulacu, “Automatic writer identification using connected-component contours and edge-based features of uppercase western script,” IEEE Transactions on Pattern Analysis and Machine Intelligence, vol. 26, no. 6, pp. 787–798, 2004. [3] Marius Bulacu and Lambert Schomaker, “Writer style from oriented edge fragments,” In Proceedings of the 10th International Conference on Computer Analysis of Images and Patterns, pp. 460–469, 2003.
[4] Francesco Camastra, “A svm-based cursive character recognizer,” Pattern Recognition, vol. 40, no. 12, pp. 3721–3727, 2007. [5] Oivind Due Trier, Anil K Jain, and Torfinn Taxt, “Feature extraction methods for character recognition: A survey,” Pattern Recognition, vol. 29, no. 4, pp. 641–662, 1995. [6] R. P. W. Duin, “The combining classifier: to train or not to train?,” Proceedings of the 16th International Conference on Pattern Recognition, vol. 2, pp. 765–770, 2002. [7] Francesco Camastra, Marco Spinetti, and Alessandro Vinciarelli, “Offline cursive character challenge: a new benchmark for machine learning and pattern recognition algorithms.,” Proceedings of the 18th International Conference on Pattern Recognition, pp. 913–916, 2006. [8] P.A. Devijver and J. Kittler, Pattern Recognition: A Statistical Approach, Prentice-Hall, Londres, 1982. [9] E. Kavallieratou, K. Sgarbas, N. Fakotakis, and G. Kokkinakis, “Handwritten word recognition based on structural characteristics and lexical support,” Proceedings of the Seventh International Conference on Document Analysis and Recognition, pp. 562–567, 2003. [10] Y.C. Chim, Antonio Alves Kassim, and Y. Ibrahim, “Dual classifier system for handprinted alphanumeric character recognition,” Pattern Analysis and Application, vol. 4, no. 1, pp. 155–162, 1998. [11] Luiz S. Oliveira, Robert Sabourin, Flávio Bortolozzi, and Ching Y. Suen, “Automatic recognition of handwritten numerical strings: A recognition and verification strategy,” IEEE Transactions on Pattern Analysis and Machine Intelligence, vol. 24, no. 11, pp. 1438–1454, 2002. [12] Ping Zhang, Reliable recognition of handwritten digits using a cascade ensemble classifier system and hybrid features, Ph.D. thesis, Concordia University, Montreal, P.Q., Canada, 2006. [13] Rafael C. Gonzalez and Richard E. Woods, Digital Image Processing, Addison-Wesley Longman Publishing Co., Inc., third edition, 2008. [14] John Thornton, Michael Blumenstein, Vu Nguyen, and Trevor Hine, “Offline cursive character recognition: A state-of-the-art comparison,” 14th Conference of the International Graphonomics Society, 2009. [15] M. Riedmiller and H. Braun, “A direct adaptive method for faster backpropagation learning: The rprop algorithm,” Proceedings of the IEEE International Conference on Neural Networks, pp. 586–591, 1993. [16] M. Stone, “Cross-validatory choice and assessment of statistical predictions,” Journal of the Royal Statistical Society B, vol. 36, no. 1, pp. 111–147, 1974. [17] Josef Kittler, Mohamad Hatef, Robert P. W. Duin, and Jiri Matas, “On combining classifiers,” IEEE Transactions on Pattern Analysis and Machine Intelligence, vol. 20, pp. 226–239, 1998. [18] Ludmila I. Kuncheva, Combining Pattern Classifiers: Methods and Algorithms, Wiley-Interscience, 2004. [19] David M. J. Tax, Martijn van Breukelen, Robert P. W. Duin, and Josef Kittler, “Combining multiple classifiers by averaging or by multiplying?,” Pattern Recognition, vol. 33, no. 9, pp. 1475–1485, 2000. [20] Bernhard Scholkopf and Alexander J. Smola, Learning with Kernels: Support Vector Machines, Regularization, Optimization, and Beyond, MIT Press, Cambridge, MA, USA, 2001. [21] John Thornton, Jolon Faichney, Michael Blumenstein, and Trevor Hine, “Character recognition using hierarchical vector quantization and temporal pooling,” Proceedings of the 21st Australasian Joint Conference on Artificial Intelligence, pp. 562–572, 2008. [22] Marc’Aurelio Ranzato, Y-Lan Boureau, and Yann LeCun, “Sparse feature learning for deep belief networks,” Advances in Neural Information Processing Systems, pp. 1185–1192, 2008. [23] Patrice Y. Simard, Dave Steinkraus, and John C. Platt, “Best practices for convolutional neural networks applied to visual document analysis,” International Conference on Document Analysis and Recognition, vol. 2, pp. 958–963, 2003. [24] Fabien Lauer, Ching Y. Suen, and Gérard Bloch, “A trainable feature extractor for handwritten digit recognition,” Pattern Recognition, vol. 40, no. 6, pp. 1816–1824, 2007.