An Estimation Model for Test Execution Effort Paulo Borba1
[email protected]
Eduardo Aranha1,2
[email protected] 1
Informatics Center Federal University of Pernambuco PO Box 7851, Recife, PE, Brazil +55 81 2126-8430
Abstract Testing is an important activity to ensure software quality. For example, some organizations may have several development teams with their products being tested by overloaded test teams. In such situations, test team managers must be able to properly plan their schedules and resources. Also, estimates for the required test execution effort can be an additional criterion for test selection, since effort may be restrictive in practice. Nevertheless, this information is usually not available for test cases never executed before. This paper proposes an estimation model for test execution effort based on the size and execution complexity of test cases. This information is obtained from test specifications written in a controlled natural language. We evaluated the model through an empirical study on the mobile application domain, which results suggested an accuracy improvement when compared with estimations based on historical data.
1. Introduction In competitive markets such as the mobile phone market, companies that release products with poor quality may quickly lose its clients. Consequently, companies should ensure that their products conform to the clients’ expectations. A usual activity performed to ensure software quality is testing. Software testing is being considered so important that organizations can assign teams only for testing activities. For example, a big organization may have several development teams with their products being tested by overloaded test teams. In such situations, test team managers must be able to properly plan their schedules and resources. For example, test managers should be able to estimate the required effort to execute test cases and to justify requests for more
2
Mobile Devices R&D Motorola Industrial Ltda Rod SP 340 - Km 128,7A - 13820 000 Jaguariuna/SP - Brazil
resources or for extending deadlines. In addition, Model-based testing (MBT) has become popular in recent years. MBT is a technique for generating test cases from system specifications [15]. Using MBT, a high number of test cases can be automatically generated. However, it may not be possible to execute all generated test cases, since test resources are limited. In such situations, test cases are usually selected using some criteria such as the coverage metrics [19] [16]. An additional criterion that can be useful for test selection is the execution effort, since effort may be restrictive in practice. Nevertheless, this information is usually not available for test cases never executed before. Several software development estimation models have been proposed over the years. However, these models do not estimate the effort for executing a given set of test cases, since their estimations are based on software size and development complexity instead of test size and execution complexity. In this work, we address the problem of supporting test managers to plan their schedules and resources through the use of an effort estimation model for the test execution activity. Also, we want to provide execution effort estimates about generated test cases as an additional criterion for test selection. This paper proposes a test execution effort estimation model that is based on the test size and execution complexity. In Section 2, we discuss about existent software estimation models. After, Section 3 introduces a controlled natural language used for specifying tests. Next, Section 4 presents the proposed model for estimating test execution effort. After that, Section 5 presents the results of an empirical study on the mobile application domain. Finally, our conclusions are presented in Section 6.
2. Related estimation models During the last few decades, several models and techniques were created for estimating size and effort on software development. The surveys presented in [2], [12] and [7] summarize the software estimation evolution so far. Some of the related and renowned software estimation models are discussed here. The first model discussed here is Function Points Analysis (FPA) [6]. FPA gives a measure of the size of a system by measuring the complexity of system functionalities offered to the user. The size of system is determined in function points (FP), a unit-of-work measure, and this count is used for estimating the effort to develop it. The Use Case Point Analysis (UCP) [11] is an extension of FPA and estimates the size of a system based on use case specifications. Both UCP and FPA regard the development complexity of a system, while our proposed model regards the size and execution complexity of test cases. The Constructive Cost Model (COCOMO) [3] converts size metrics such as FP and SLOC (source lines of code) into effort estimation for developing systems. Its formula uses effort multipliers and scale factors, and their values are defined according to the characteristics of the development environment, teams and processes used in the project. Similar to UCP, Test Point Analysis [13] is a method for estimating the effort required to perform all functional test activities based on use case points. This model estimates the effort required for all test activities together, such as defining, implementing and executing all the tests. For example, it is not possible to estimate only the effort to execute test cases that were automatically generated.
3. Test specification language Tests are usually specified in terms of precondition, procedure (list of test steps with inputs and expected outputs) and post-condition [8]. These specifications are commonly written in natural language, often leading to problems such as ambiguity, redundancy and lack of writing standard, which difficult not only the test execution, but also its complexity estimation. However, the problems can be reduced using controlled natural languages. A controlled natural language (CNL) [17] is a subset of natural language with restricted grammar and lexicon in order to have sentences written in a more concise and standard way. This restriction reduces the number of possible ways to describe an event, action or object. The test specifications considered by this work are written using a CNL described here. In a simplified way, each sentence (test step) in the specification conforms to the following structure: a main verb and zero or more arguments.
Table 3 shows an example of test procedure written in a controlled natural language defined for the mobile application domain. Table 1. Example of a test procedure written in a controlled natural language. Step 1 2 3
4 5
Description Start the message center. Select the new message option. Insert a recipient address into the recipients field. Insert a SMS content into the message body. Send the message.
Expected Results The phone is in message center. The phone is in message composer. The recipients field is filled. The message body is populated. The send message transient is displayed. The message is sent.
The verb identifies the action of the test step to be performed during the test. The arguments provide additional information about the action represented by the verb. For instance, the phrase Start the message center has the verb start (action of starting an application) and the required argument the message center (application to be started). The CNL can have its lexicon and grammar extended for specific application domains. For example, the list of possible verbs and arguments may be different between the mobile and the Web application domains. The context of this work is related to testing mobile applications for Motorola Brazil Test Center site at the Informatics Center/UFPE. Hence, the considered controlled natural language in this paper reflects this domain [18] [9].
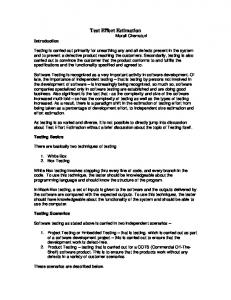
4 Test execution effort estimation model In this section, we present a new test effort estimation model developed during our research. As illustrated by Figure 1, the input of our estimation model is a test suite and the output is the estimated effort in man-hours required to execute all tests in the suite. Our test execution effort estimation model works as follows. First of all, (1) we individually analyze the test cases existing in the suite. During these analyses, (2) we assign for each test case a number of execution points, a unit of measure defined in this work for describing the size and execution complexity of test cases. After that, (3) we sum all the execution points measured from the analyzed test cases. This total describes the size and execution complexity for the whole test suite. Finally,
Figure 1. Estimating the effort to execute a test suite.
(4) we estimate the required effort in man-hours to execute all tests in the test suite based on the total number of execution points. Next, we present the details about this estimation model.
4.1
Test size and execution complexity
Our estimation model is based on the size and execution complexity of each test case in a test suite. Test size means the amount of steps required to execute the test. Test execution complexity is related to the relationship between the tester and the tested product (complexity of interaction) required during the test. These definitions are adaptations of the idea of size and complexity for software products [14] [4] [5]. Since we are proposing a metric for the size and execution complexity of a test case, it is important to have an intuitive understanding of the measured test case attribute. This leads us to the identification of empirical relations between test cases: • The relation “bigger than” indicates that one test has a bigger size and execution complexity than another. • The relation “similar to” indicates that one test has a similar size and execution complexity when compared to another. • The relation “grouped with” indicates that two tests can be grouped and the results is a test suite with size and execution complexity similar to the two test cases individually. These relations were defined intuitively by analysing the size and execution complexity of real test cases and its execution effort in stable conditions (environment, tools, team
experience, etc.). All test cases T together with the presented empirical relations R are called the empirical relation system (T, R) for the attribute size and execution complexity [5]. To measure test size and execution complexity that is characterised by (T, R), we must define a mapping M of (T, R) into (E, P), in which test cases in T are mapped into numbers (called execution points) in E and empirical relations in R are mapped to numerical relations in P. In this way, we can validate our measure demonstrating empirically that the mapping is valid for the attribute size and execution complexity. The set of all possible numbers of execution points E consists of the nonnegative integers and the set of numerical relations P consists of the relations > (greater than), ≈ (almost equal to) and + (sum). The relations of R and P are mapped following the order of their presentations in this section. Later, we discuss the validity of this mapping in Section 5.3. In practice, the execution point count of a test case gives us a quantitative reference about its size and execution complexity. In addition, it allows us to compare testers and test cases. For instance, a test case rated with 700 execution points is bigger than others rated with 590 and 350. Also, a tester that executed 5 tests rated with 500 execution points each one is faster than another that executed 15 tests rated with 100 execution points.
4.2
The measurement method
This section presents how we measure the size and execution complexity of a test case. All required information is extracted from the test specification. Although not essential, we consider in this paper that test specifications are written in the CNL discussed in Section 3. The CNL simplifies the use of our model and also efficiently supports a high level of automation of our measurement method. Figure 2 illustrates how our measurement method works. First, (a) we individually analyze each test step of the test specification. This step by step analysis was selected to make easier the method automation. We analyze each test step according to a list of characteristics (C1 to Cn ). These characteristics represent some general functional and non-functional requirements exercised when the test step is executed. Examples of possible characteristics are number of navigations between screens, number of pressed keys and use of network. The list of characteristics may not be the same for different application domains as discussed later in Section 4.4. Each characteristic considered by the model has impact in the size and execution complexity of the test and (b) this impact is rated using an ordinal scale (Low, Average and High). Later, Section 4.4 presents how guidelines help the
Figure 2. Assigning execution points to a test case.
model user to objectively choose the more appropriate level for each characteristic. After that, (c) we assign execution points for each characteristic according to its selected value. The objective here is to transform the qualitative rate into a quantitative value. For instance, a characteristic C1 rated with the Low value could be assigned to 30 execution points. However, two different characteristics rated with the same value may be assigned to different numbers of execution points. Section 4.4 also discusses about guidelines provided for assigning the correct value for each possible characteristic value. To calculate the total number of execution points of a test step, (d) we sum the points assigned for each characteristic. Then, (e) we measure the size and execution complexity of a test case by summing the execution points of each one of its test steps.
4.3. Test effort estimation The execution point count of a test suite gives us a reference about its tests size and execution complexity. Based in this information, we use the historical test execution productivity in order to estimate the required effort to execute the test suite. Test execution productivity is given in seconds per execution point, a unit-of-work measure indicating the number of seconds required to execute each execution point of a test case. For calculating the test execution productivity, testers can measure the test size and execution complexity of several test cases. Then, the execution time of each test should be collected from a historical database (if available) or by executing the test.
Figure 3. Using execution points and test execution productivity to calculate test execution effort.
As illustrated by Figure 3, (f) the test execution productivity is the total effort divided by the total number of execution points. This information is then used for estimating the execution effort of new test suites, we just need to (g) multiply its number of execution points by the test execution productivity. For instance, a test manager may verify a productivity of 3.5 seconds per execution point. Using this productivity, a new test case with 120 execution points is estimated to be executed in 7 minutes. Similar approach is used by other existing estimation models [6] [11] [13] [14]. In this approach, we assume that the test execution productivity and environment conditions are stable over time. For example, improvements in the test team, tools or environment may change the test execution productivity. In this case, the test execution productivity should be recalculated using data collected after the improvements. In summary, the test execution productivity used in the estimations should properly represent the current situation. In addition, test execution productivity should be calculated for each different test team, test type or type of tested product, since there may be significant differences in productivity.
4.4
Model configuration
Our proposed test execution effort model should be configured according to the target application domain in order to maximize the estimates accuracy. This section presents what, why and how to configure our estimation model.
Controlled natural language Test specifications written in CNL are the input of our model. As shown in Section 3, the CNL grammar and lexicon are defined according to the target application domain. For example, on the mobile application domain you have the verb take that accepts the term picture as argument. Hence, a possible test step is Take a picture. The list of verbs and possible arguments is constructed by analysing requirements documents and existing test specifications. Besides, new verbs and terms will probably occur over the time due to the specification of new requirements, technology changes, etc. The CNL grammar and lexicon is stored in a database that can be updated whenever necessary. System characteristics During the test execution effort estimation, all test steps are analyzed according to a list of characteristics. These characteristics represent some general functional and nonfunctional requirements exercised when the test step is executed. These characteristics may depend on the target application domain. We use the Delphi method [10] for obtaining a consensus from experts about the list of relevant characteristics. Examples of possible characteristics are the number of navigations between screens, the number of pressed keys and the use of network. The experts group consist of 3 to 7 experienced testers invited from different teams for attending two or more rounds. In each round, they have the opportunity to add or remove characteristics from the list. Examples of real test cases are provided as a source for identifying types of test actions, software configurations, use of tools or specific hardwares and other characteristics that may impact the size or the execution complexity of a test case. All this process is anonymous, a moderator only provides to the participants a summary of experts’ decisions and their reasons for that. Guidelines Once the experts have defined the list of characteristics to be considered by the estimation model, the experts continue attending Delphi panels, but with new objectives now. First, they have to define what are the possible values that each characteristic may have. For example, if the type of a camera was selected as a relevant characteristic for test size and execution complexity, its possible values would be automatic shooting, required manual zoom, require use of flash, etc. After identifying the possible values of each selected
characteristic, the experts group all possible values of each characteristic into three impact levels (low, average and high). The choices are made based on the impact of each value in the test execution. This part of the guidelines will help the model user to objectively choose the more appropriate level for each characteristic. Finally, the experts must define for each characteristic the number of execution points to be assigned for each one of its impact levels. The experts proceed as follows. Each characteristic is weighted from 1 to 10. These weights indicate the significance of each characteristic for the test size and execution complexity. Then, the experts give a weight from 1 to 10 for the levels Low, Average and High of each characteristic. These weights indicate the significance of each level for the characteristic. In general, values 3, 5 and 8 will respectively be used to weight the levels Low, Average and High. After that, the number of execution points assigned for a level is calculated by multiplying its weight by the weight of its characteristic. After ending the first version of the model, one or two experts are enough for updating the guidelines when necessary.
4.5
Model automation
One of the objectives of this work was to develop an estimation model that can be automated. This automation is important for supporting the development of new test generation and test selection tools. In practice, companies may not be able to execute all test cases generated by such tools, since its resources are limited. For this reason, the test execution effort should be taken in consideration. A test generation tool, for instance, could consider minimal requirement coverage and maximum execution effort as its stop criteria. The use of CNL for specifying tests makes easier the development of an estimation tool that automatically reads and interprets these specifications. In addition, all the information required for using the model, such as the list of characteristics, guidelines and test productivity can be stored in a database. Actually, the CNL grammar and lexicon is also stored in the database [18]. During the analysis of the first test cases, the estimation tool will ask the user to rate the characteristics of each test step. This information is stored in the database. Since the use of CNL reduces the number of possible ways to describe a test step, it is common that the same test step (or very similar ones) occurs many times in the same test case or in different ones. For this reason, the necessity for manual assistance during the estimations tends to became unnecessary as much as you use the tool. At the moment this paper was written, only an initial pro-
totype was created for validating the model automation capability.
5. Empirical study This section presents the empirical study we run using our test execution effort estimation model on the mobile application domain. First, we configured our estimation model for the target domain. After that, we applied the estimation model in a controlled experiment. Then, we validate the test size and complexity measure we proposed.
5.1
Model configuration for the mobile application domain
The CNL used in this empirical study was defined in [18], we just needed to reuse its definition. To define the list of characteristics, we invited 6 experienced testers. They identified the relevant characteristics and defined the guidelines in a Delphi panel that took four hours (two sessions of two hours). The results are presented in Table 2.
5.2
Experiment
We tested the presented model running an experiment. The main goal of this study was to analyze the impact on the accuracy of test execution effort estimates when using the estimation model proposed in this paper. In order to do that, we compared the estimates given by our model with the ones calculated using historical averages of test execution times, a simple and common estimation method used in practice. Following the goal-question-metric approach [1], we refined our goal for this empirical study to the questions presented next: Q1: Is the average estimation error lower when using our model rather than using historical execution times?
model. As both approaches require test execution productivity information, we split the collected execution times into two sets of data, one for training and other for testing. The tests were randomly split, where the training set contained approximately 65% of the tests. All test cases were then executed by a tester. The execution times were collected and stored in a spreadsheet for analysis. We used the test execution times of the training set to calculate: • The average test execution time (for the historical data approach). • The average time required to execute each execution point of a test case (for our proposed model). With this information, we estimated the test execution effort of the testing set using both approaches. The following metrics were collected, since they are appropriated for answering Q1 and Q2. • Magnitude of the relative estimation error per test. M REt = abs(
estimatedt − actualt ) actualt
• Mean magnitude of the relative estimation error. M M RE =
Q2: Is the average percentage of estimates within 20% of the actual values higher when using our model rather than using historical execution times? The answer for Q1 will indicate if the use of our estimation model results in a small error when regarding all estimates together. In its turn, the answer for Q2 will indicate if the number of estimates within 20% of the actual values increased when using our estimation model. For the study, we selected 33 test cases of a messaging application feature for mobile phone. These test cases were written in a controlled natural language and their size and complexity were measured using our method. We wanted to compare the precision of estimates made using historical information with estimates made using our
P
T t=1
M REt T
• Average percentage of estimates that were within N% of the actual values, with N=20. P RED(N ) =
P
T t=1 (1, if M REt
≤ T
N , 0, otherwise) 100
In order to avoid bias, we repeated the process two more times with different training and testing sets. Table 3 compare the metrics collected from the two analyzed estimation approaches. In all tests we achieved better or equivalent estimation precision. In the first test, for example, the number of estimates within 20% of the actual values increased by 100%. We also applied t-tests and confirmed the significance of the results.
5.3
Test size and complexity measure validation
In Section 4.1, we proposed a metric for the size and execution complexity attribute of a test case. We can validate this metric demonstrating empirically that the mapping between the empirical relation system (T, R) to the numerical relation system (E, P) is valid [5]. During the experiment presented in the previous section, we mapped several test cases in T into execution points in E. It is necessary to verify that the mapped relations (in R and P) is valid considering the collected data. We used expert judgement and effort information for identifying tests bigger than others and tests similar to others. We verified that the tests identified as similar have different measured numbers of execution points. However, the differences between these measures are within 20% of their values and this percentage value can be used for identifying similar test cases from their number of execution points. The consequences of this assumption is subject for further research. We also verified that tests identified as bigger than others had bigger measures for their size and execution complexity attribute. Also, the relation “grouped with” was successful confirmed by analysing the groups of test cases together.
6. Conclusions This paper presented an estimation model for test execution complexity based on the size and execution complexity measured from test specifications written in a controlled natural language. Existing estimation models in the literature are based on system specifications and they estimate the effort required to perform more activities than test execution, such as defining and implementing tests. Actually, they cannot be used to estimate the execution effort of a given test case. Our model does not require historical execution times of the test cases. This characteristic is extremely important in several situations, such as when test cases are new and different from any previous one. It is also important when you do not have reliable historical data or when you generate high numbers of test cases using model-based testing approaches. The use of a controlled natural language reduces the ambiguity helping the complexity measurement. Actually, the number of possible ways to describe the same test step in a controlled language is minimal, and we also observed that a small but concise controlled language can support a high number of different test cases. Based on these considerations, the method for measuring test execution complexity can be automated and optimized as follows. The complexity evaluation of test steps
are recorded and reused whenever possible in the complexity evaluation of other test cases. Over the time, the number of necessary evaluations tends to decrease. The evaluations of similar test steps are also reused, since their execution complexity may be determined only by its verb. For instance, the act of launching an application has the same complexity for most applications. In this example, only the exceptions need to be evaluated. With these optimizations and the possibility to automate all steps of the method, except the test step complexity evaluation, the costs for applying this method are significantly reduced. For the mobile application domain, we defined the relevant system characteristics exercised by the test cases and their weights. This definition used intuition and expert judgment through a Delphi panel [10]. We also run an empirical study aiming to test the model and to evaluate its accuracy. In addition, we demonstrated empirically the validity of our test effort and execution measures assuming a similarity criteria of 20%. Although we achieved interesting results suggesting accuracy improvements when using our method, we plan to run more experiments and verity its results (accuracy, relevant characteristics, complexity levels and weights considered in the model) in other application domains. The test execution effort estimation is a complex activity, where changes in environment conditions, team experience, use of tools, reuse of test setups and other factors should be considered. These situations can modeled by risk factors. A risk factor for test execution represents some characteristic of the test execution process that affects the final effort to execute tests. For instance, FPA and COCOMO are examples of existing models that regards risk factors for software development. We believe that is possible to extend our model in order to regard risk factors.
7. Acknowledges The first author is partially supported by Motorola, grant BCT-0021-1.03/05, through the Motorola Brazil Test Center Research Project. The second author is partially supported by CNPq, grant 306196/2004-2.
References [1] V. Basili, G. Caldiera, and D. Rombach. The goal question metric approach. Encyclopedia of Software Engineering, 1:528–532, 1994. [2] B. Boehm, C. Abts, and S. Chulani. Software development cost estimation approaches - a survey. Ann. Software Eng., 10:177–205, 2000.
[3] B. Boehm, E. Horowitz, R. Madachy, D. Reifer, B. Clark, B. Steece, W. Brown, S. Chulani, and C. Abts. Software Cost Estimation with COCOMO II. Prentice Hall, 2000. [4] L. Briand, K. E. Emam, and S. Morasca. On the application of measurement theory in software engineering. Empirical Software Engineering: An International Journal, 1(1):61– 88, 1996. [5] N. Fenton. Software measurement: A necessary scientific basis. IEEE Transactions on Software Engineering, 20(3):199–206, 1994. [6] D. Garmus and D. Herron. Function Point Analysis, Measurement Practices for Successful Software Projects. Addison Wesley, 2001. [7] M. Jorgensen and M. Shepperd. A systematic review of software development cost estimation studies. IEEE Transactions on Software Engineering, 2006. [8] P. Jorgensen. Software Testing, A Craftsmans Approach. CRC Press, second edition, 2002. [9] D. Leitao. Translating natural language descriptions into formal test case specifications. Master’s thesis, Federal University of Pernambuco/UFPE, 2006. [10] H. Linstone and M. Turoff. The Delphi Method: Techniques and Applications. http://is.njit.edu/pubs/delphibook, 2002. [11] P. Mohagheghi, B. Anda, and R. Conradi. Effort estimation of use cases for incremental large-scale software development. In Proceedings of the 27th international conference on Software engineering (ICSE05), pages 303–311. ACM Press, 2005. [12] K. Molokken and M. Jorgensen. A review of surveys on software effort estimation. In ISESE ’03: Proceedings of the 2003 International Symposium on Empirical Software Engineering, page 223. IEEE Computer Society, 2003. [13] S. Nageswaran. Test effort estimation using use case points. In 14th International Internet Software Quality Week 2001, June 2001. [14] C. Pandian. Software Metrics: A Guide to Planning, Analysis, and Application. CRC Press, Inc., 2003. [15] A. Pretschner. Model-based testing. In ICSE ’05: Proceedings of the 27th international conference on Software engineering, pages 722–723, 2005. [16] A. Rajan. Coverage metrics to measure adequacy of blackbox test suites. In ASE ’06: Proceedings of the 21st IEEE International Conference on Automated Software Engineering (ASE’06), pages 335–338. IEEE Computer Society, 2006. [17] R. Schwitter. English as a formal specification language. In Proceedings of the 13th International Workshop on Database and Expert Systems Applications (DEXA02), pages 228–232, 2002. [18] D. Torres, D. Leitao, and F. Barros. Motorola specnl: A hybrid system to generate nl descriptions from test case specifications. Sixth International Conference on Hybrid Intelligent Systems (HIS’06), page 45, 2006. [19] M. Whalen, A. Rajan, M. Heimdahl, and S. Miller. Coverage metrics for requirements-based testing. In ISSTA ’06: Proceedings of the 2006 international symposium on Software testing and analysis, pages 25–36. ACM Press, 2006.