Advances in Computer Science and its Applications (ACSA) Vol. 2, No. 1, 2012, ISSN 2166-2924 Copyright © World Science Publisher, United States www.worldsciencepublisher.org
314
An Effort Estimation Model for Agile Software Development Ziauddin, Shahid Kamal Tipu, Shahrukh Zia Gomal University, Pakistan
[email protected] Abstract: Software effort estimation process in any software project is not only essential, but also a very critical component. The success or failure of projects depends heavily on the accuracy of effort and schedule estimations, among other things. The emergence of agile methods in the software development field has presented many opportunities and challenges for researchers and practitioners alike. One of the major challenges is effort estimation for agile software development. Though traditional effort estimation approaches are used to estimate effort for agile software projects but they mostly result in inaccurate estimates. This research focuses on development of effort estimation model for agile software projects. Construction and use of the model is explained in detail. The model was calibrated using the empirical data collected from 21 software projects. The experimental results show that model has good estimation accuracy in terms of MMRE and PRED (n). Keywords: Software Effort Estimation, Agile Software Development, User Stories, Adaptive Systems
1. INTRODUCTION Software cost estimating has been an important but difficult task since the beginning of the computer era in the 1940s. As software applications have grown in size and importance, the need for accuracy in software cost estimating has grown, too. Since the early 1950s, software development practitioners and researchers have been trying to develop methods to estimate software costs and schedules [Zia et.al, 2011]. Software cost estimation models have appeared in the literature over the past three decades. However, the field of software cost estimation is still in its infancy. Although different software effort estimation techniques have been introduced, which are being effectively used in traditional software development, however the diversity of new software development methodologies has resulted in a situation where existing effort prediction models’ applicability appears to be limited. Agile software development provides one such difficulty. This methodology is based on entirely different concept of software development which is neither suitable to be calculated by FP analysis technique nor classical effort estimation methods can be applied that are specifically developed for sequential software development methodologies. Agile software development has been attached much importance as a new software engineering methodology. It emphasizes on good communication between the
developers, the rapid delivery of software, and change on demand is the key of agile software development (SCHMIETENDORF et.al, 2008). Agile methods of the software development are increasingly used for industrial projects. The application of effort estimation methods in such kind of projects is very difficult, but an important task. Classical estimation methods need well defined requirements. Agile methodologies don’t support this behavior. Rather, they see changed requests as important challenge. All these make estimation in Agile Software development a challenging task. This paper gives an overview of the available estimation techniques and describes in details estimation technique for Agile software projects. 1.1 Cost Estimation Techniques Cost estimation tools, or model-based estimation techniques use data collected from past projects combined with mathematical formulae to estimate project cost. These models need system size as input. The main model-based techniques include COCOMO, SLIM, RCA PRICE-S, SEER-SEM, and ESTIMACS. The existing effort estimation techniques are broadly classified as regressionbased models, learning-oriented models, expert based approaches and composite-Bayesian methods. Most of the software estimation models are based on regression technique (Matson et al., 1994). Regression models normally use previous data, constructed by
Ziauddin, ACSA, Vol. 2, No. 1, pp. 314-324, 2012
collecting data on completed projects and developing regression equations that characterize the relationships among the different variables (Fairley, 1992). Estimates are made by substituting the. New project parameters are substituted into mathematical model. This model is evaluated on regression data to make estimates. In these models software development effort is simply dependent variable of some predicted variables like Size, Effort adjustment factors, Scaling factors etc. for regression equation. Regression models however need certain conditions in some cases to be fulfilled particularly (Finnie et al., 1997). These conditions are discussed by Boehm and Sullivan (1999), and are based on experience from the use of regression-based models. These typical conditions include availability of a large dataset, no missing data items, no outliers, and the predictor variables are not correlated. The collection of approaches that fall under the heading of regression-models include ordinary least-squares regression (OLS), classification and regression trees (CART), stepwise analysis of variance for unbalanced data sets (stepwise ANOVA), combinations of CART with OLS regression and analogy, multiple linear regression, and stepwise regression (KEAVENEY, 2006). There are other types of model, called Learning-oriented models which are based on learning from previous estimation experience. These models attempt to automate the estimation process by training themselves from previous experience to build computerized models (Boehm et al., 2000). These models are capable of learning incrementally and refining themselves as new data are provided over time (Lee et al., 1998). Learning-oriented models cover a wide area and include techniques such as artificial intelligence approaches, artificial neural networks, case-based reasoning (Mukhopadhyay and Kekre, 1992), machine learning models, decision-tree learning, fuzzy logic models, knowledge acquisition and rule induction (Burgess and Lefley, 2001). The main model-based techniques include COCOMO, SLIM, RCA PRICE-S, SEER-SEM, and ESTIMACS. These estimation models produce an estimate of the cost, effort or duration of a project based on factors such as the size and desired functionality of the system. An important expertise based approach was found by Briand et al. (1998) to be “comparison to similar, past projects based on personal memory”. The expertise based approaches are useful when no quantified, empirical data is available (Boehm et al., 2000). They provide a practical, low-cost and highly useful process (Johnson et al., 2000). Another estimation technique used for software effort estimation is analogy based estimation. The technique examines past projects and uses the information retrieved as a guide estimate for the proposed project (Angelis et al., 2001, Jørgensen et al., 2003). The Checkpoint method is an example of an analogy-based approach to software estimation (Fairley, 1992). In this technique heuristics are derived from actual project data or a formalization of expert opinion. In order to derive these heuristics some form of
315
project data or information are used. These heuristics are, then, used to estimate productivity, quality or size (Hihn and Habib-agahi, 1991, Fairley, 1992). Expert judgment Esitimation is also one of the popular estimation technique in software effort estimation which is based on the accumulated experiences of teams of experts in order to come up with project estimates (Peters and Pedrycz, 1999, Stamelos and Angelis, 2001). This technique is used where the estimation process is primarily based on “non-explicit, non-recoverable reasoning processes”, or perception and intuition (Jørgensen, 2004b). Expert Judgment techniques have been criticized by experts for their reliance on human memory and the lack of repeatability of such memory-based approaches (Mukhopadhyay et al. (1992, (Mendes et al., 2002); however reports have proven it to be the dominant strategy in software development estimation (Jørgensen, 2004a, Höst and Wohlin, 1997, Moløkken and Jørgensen, 2003, Moløkken-Østvold et al., 2004). The Delphi technique and work breakdown structure (WBS), top-down and bottom-up estimation (Tausworthe, 1980), reasoning by analogy, formal reasoning by analogy, informal reasoning by analogy, and rules of thumb (Jones, 1996) fall under expert judgment technique. The strengths of expertise based methods and regressionbased methods were combined to introduce a new estimation approach called the Bayesian approach which is a semi-formal estimation process (Ferens, 1988). Bayesian analysis allows for the fact that the data required for use in most estimation techniques is typically of poor quality or incomplete. Expert judgment is incorporated in this approach to handle the missing data and provide a more robust estimation process (Boehm and Sullivan, 1999). Bayesian analysis has been used in many scientific disciplines and was used in the development of the COCOMO II model (Chulani et al., 1999, Boehm et al., 2000). Cost Estimation, Benchmarking and Risk Analysis (COBRA) is an example of a composite estimation model (Ruhe et al., 2003). 1.2 Agile Software Development Agile software development is a group of software development methods based on iterative and incremental development, where requirements and solutions evolve through collaboration between self-organizing, crossfunctional teams. It promotes adaptive planning, evolutionary development and delivery, a time-boxed iterative approach, and encourages rapid and flexible response to change. It is a conceptual framework that promotes foreseen interactions throughout the development cycle. The Agile Manifesto introduced the term in 2001. Early implementations of lightweight methods include Scrum (1995), Crystal Clear, Extreme Programming (1996), Adaptive Software Development, Feature Driven Development, and Dynamic Systems Development Method (DSDM) (1995). These are now typically referred to as
Ziauddin, ACSA, Vol. 2, No. 1, pp. 314-324, 2012
316
agile methodologies, after the Agile Manifesto published in 2001. Methods exist on a continuum from adaptive to predictive. Agile methods lie on the adaptive side of this continuum. Adaptive methods focus on adapting quickly to changing realities. When the needs of a project change, an adaptive team changes as well. Predictive methods, in contrast, focus on planning the future in detail. A predictive team can report exactly what features and tasks are planned for the entire length of the development process. Predictive teams have difficulty changing direction. 1.2.1
Characteristics of Agile Software Process
Modularity: The key element of agile software process is modularity which allows a process to be broken into components called activities. Iterative: Agile software processes focus on short cycles. Within each cycle, a certain set of activities is completed. Time-Bound: Time limits are set for each iteration and schedule. This duration is called Sprint. Parsimony: Agile software processes focus on parsimony. That is, they require a minimal number of activities necessary to mitigate risks and achieve their goals. Adaptive: The agile process adapts the process to attack new found risks, exposed in any iteration Similarly agile process accommodate any added activity or modification to the existing activities Incremental: An agile process does not try to build the entire system at once. Instead, it partitions the nontrivial system into increments which may be developed in parallel, at different times, and at different rates. Convergent: The basic premise of agile process is to build the system closer to the reality. This goal is achieved by applying all possible techniques to ensure success in the most rapid fashion. People-Oriented: Agile processes favor people over process and technology. They evolve through adaptation in an organic manner. Developers that are empowered raise their productivity, quality, and performance. After all, they are the best individuals in the organization to know how to make these changes. Collaborative: Agile processes foster communication among team members. Communication is a vital part of any software development project. Quickly integrating a large project while increments are being developed in parallel, requires collaboration (MILLER, 2001). 1.3 Effort Estimation Development
practice
in
agile
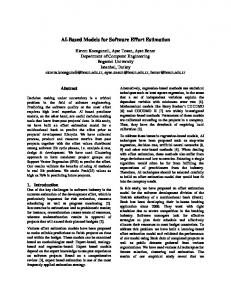
emphasis on collective effort. Second, it refuses to quantify work in terms of time because this would undermine the self-organization central to the success of methodology. This is a major break from waterfall: Instead of a manager estimating time on behalf of other individuals and assigning tasks based on conjecture, team members in Scrum use effort and degree of difficulty to estimate their own work. Agile Methodology does not prescribe a single way for teams to estimate their work. However, it does ask that teams not estimate in terms of time, but, instead, use a more abstracted metric to quantify effort. Common estimating methods include numeric sizing, t-shirt sizes, the Fibonacci sequence and even dog breeds. The important thing is that the team shares an understanding of the scale it is uses, so that every member of the team is comfortable with the scale’s values. In the Sprint Planning Meeting, the team sits down to estimate its effort for the stories in the backlog. The Product Owner needs these estimates, so that he or she is empowered to effectively prioritize items in the backlog and, as a result, forecast releases based on the team’s velocity. This means the Product Owner needs an honest appraisal of how difficult work will be. Thus it is recommended that the Product Owner does not observe the estimation process to avoid pressuring a team to reduce its effort estimates and take on more work. Even when the team estimates amongst itself, actions should be taken to reduce influencing how a team estimates. As such, it is recommended that all team members disclose their estimates simultaneously. Because individuals “show their hands” at once, this process is like a game of poker. Still, even when teams possess a shared understanding of their scale, they can’t help but estimate differently. To arrive at a single effort estimation that reflects the entire team’s sense of a story’s difficulty, it often requires numerous rounds of estimation. Veteran teams who are familiar with the process, however, should reach a consensus after just a few rounds of planning poker. Normally effort estimation takes place at the beginning of new iteration during Release Planning. A Section of the XP-Project is shown in Figure 1.
software
In waterfall a team member’s workload capacity is determined by the manager who estimates how long certain tasks will take and then assigns work based on that team member’s total available time. Agile methodology takes a considerably different approach to determining a team member’s capacity. First of all, it assigns work to an entire team, not an individual. Philosophically, this places an
Figure 1: Effort Estimation in agile Software Development 2.
RESEARCH PROBLEM
Ziauddin, ACSA, Vol. 2, No. 1, pp. 314-324, 2012
Most of the existing effort estimation techniques have been developed to support traditional sequential software development methodologies whereas Agile Software Development is iterative in nature. If these traditional techniques are used for effort estimation of Agile software projects, then the results will be definitely inaccurate. On the other hand, current practice of effort estimation for Agile software projects is based on single iteration. Therefore an effort estimation model is needed to predict development effort of Agile software project, based on characteristics of Agile Software Development methodology. 3.
PROPOSED MODEL
Most of the Software Effort Estimation Models estimate Cost, Duration and Personnel for a project. But it will not be the case for Agile Development. There are several key differences between the agile approach to team organization and the traditional approach. 1.
2.
3.
Agile teams are "whole teams". Whole team is an Extreme Programming (XP) practice that advises you to have sufficient skills within the team itself to get the job done. The implication is that the development team has the requisite testing skills, database skills, user interface skills, and so on and does not rely on external experts or teams of experts for these sorts of things. Agile teams are formed (mostly) of generalizing specialists. A generalizing specialist, sometimes called a craftsperson, is someone who has one or more technical specialties (e.g. Java programming, project management, database administration, ...) so that they can contribute something of direct value to the team, has at least a general knowledge of software development and the business domain in which they work, and most importantly actively seeks to gain new skills in both their existing specialties as well as in other areas, including both technical and domain areas. Obviously novice IT professionals, and traditional IT professionals who are often specialized in just one area, will need to work towards this goal. Generalizing specialists are the sweet spot between the two extremes of specialists, people who know a lot about a narrow domain, and generalists who know a little about a wide range of topics. Agile teams are stable. Agilest understand that changing team structure is detrimental to project success. We strive to keep our teams as stable as possible, a goal that is much easier to achieve if people are generalizing specialists.
As there is no need to estimate Personnel requirements for the project, thus the proposed model in intended to calculate Completion Time and Cost for the Agile Software project.
317
Agile practitioners and Scrum practitioners in particular have proposed a number of scales for calibrating estimated effort in projects including: • •
Ranking effort on a scale of one to three – one being the smallest, and three being the largest. Using a Fibonacci sequence [1, 2, 3, 5, 8]. A Story ranked as an eight is a Story that is too large to accurately estimate and should likely be classified as an Epic and decomposed into a smaller set of Stories.
There are other methods, but these are the two most common ones. In both cases, the estimates are not produced in terms of units of time; rather they are merely expressions of Relative Effort which is a good comparative yardstick. While both of these methods are effective and widely used, they do not take into account the underlying elements that affect effort and uncertainty. We have thus developed a different model that we find to be very effective. This model is also consistent with the way we develop rankings of Stories, Defects and Risk. 3.1 Determining the Effort There is a multitude of factors that affect our ability to accurately estimate effort. Accurate estimation requires a multidimensional view to produce accurate and effective estimates. The challenge, however, is which dimensions do we measure? If we were to classify the possibilities using a SWOT according to Internal vs. External influences, we can eliminate many of the candidates by simply focusing our attention on the things over which we have influence and conversely paying less attention to those that we can’t. We keep the vectors to two so as to keep the process as simple as possible so that we actually use the process and don’t try to sidestep it because it is too cumbersome. Using two vectors also maintains a consistency with the other areas of the methodology. 3.2 Story Size Story size is an estimate of the relative scale of the work in terms of actual development effort. Table 1 shows five values, assigned to different types of user stories according to their size. Wording of the Guideline description can be changed by the Team itself or even the criteria can be redefined. Table 1. Story Size Scales Value Guidelines • An extremely large story • Too large to accurately estimate • Should almost certainly be broken down 5 into a set of smaller Stories • May be a candidate for separation into a new project 4 • A very large Story
Ziauddin, ACSA, Vol. 2, No. 1, pp. 314-324, 2012
• • 3 2
• • • •
1
•
Requires the focused effort of a developer for a long period of time – Think in terms of more than a week of work Should consider breaking it down into a set of smaller stories A moderately large story Think in terms of two to five days of work Think in terms of a roughly a day or two of work A very small story representing tiny effort level. Think in terms of only a few hours of work.
318
• • • • 3
• • •
3.3 Complexity This is complexity of either or both the requirements of the Story and or its technical complexity. Complexity introduces uncertainty to the estimate – more complexity means more uncertainty. Table 2 shows 5 values, assigned to user stories according to their nature. Like Story Size table, these guidelines are not fixed. These can be adjusted by the team itself; however we have categorized them to accommodate all characteristics of Agile software development methodology. Table 2. User Story Complexity Scale. Value Guidelines • Extremely complex • Many dependencies on other stories, other systems or subsystems • Represents a skill set or experience that is important, but absent in the team • Story is difficult to accurately describe 5 • Many unknowns • Requires significant refactoring • Requires extensive research • Requires difficult judgment calls • Effects of the Story have significant impact external to the story itself • Very complex • Multiple dependencies on other stories, other systems or subsystems • Represents a skill set or experience that is important, but not strong in the team • Story is somewhat difficult for product owner to accurately describe • Multiple unknowns 4 • Comparatively large amount of refactoring required • Requires research • Requires senior level programming skills to complete • Requires somewhat difficult judgment calls • Effects of the Story have moderate impact
• • •
•
2
• • • • • • •
1
• • • •
external to the story itself Moderately complex Moderate number of dependencies on other stories, other systems or subsystems Represents a skill set or experience that is reasonably strong in the team Story is somewhat difficult for owner to accurately describe Moderate level of unknowns Some refactoring may be required Requires intermediate programming skills to complete Requires little research Requires few important judgment calls Effects of the Story have minimal impact external to the story itself Easily understood technical and business requirements Little or no research required Few unknowns Little if any research required Requires basic to intermediate programming skills to complete Effects of the Story are almost completely localized to the Story itself Very straightforward with few if any unknowns Technical and business requirements very clear with no ambiguity No unknowns No research required Requires basic programming skills to complete Effects of Story are completely localized to the Story itself
Using these two vectors, effort of a particular User Story is determined using the following simple formula: ES= Complexity x Size Effort for the complete project will be sum of efforts of all individual user stories.
E = ∑ni=1(ES)i
The unit of Effort is Story Point (SP). A Story Point is the amount of effort, completed in a unit time. 3.4 Determining Agile Velocity The calculation of Velocity in physics is pretty straightforward, i.e. Velocity = Distance / Time For our purposes, the distance is Units of Effort and Time (the denominator) is the length of our Sprint. Velocity is thus calculated: Vi = Units of Effort Completed / Sprint Time. The Observed Velocity is simply how many Units of Effort your team completes in a typical Sprint. In Agile term
Ziauddin, ACSA, Vol. 2, No. 1, pp. 314-324, 2012
velocity can e defined as how much product backlog effort a team can handle in one unit of time.
319
Friction Factor
Table 3. Friction Factors Stable Volatile Highly Volatile 1
0.98
0.95
Very Highly Volatile 0.91
1 1
0.98 0.99
0.94 0.98
0.89 0.96
1
0.98
0.91
0.85
3.4.1 Optimization of Velocity Optimization is a process that should be completed before you begin Calibration. There are two things of primary interest to us in our calibration. They are: i.
The Friction or consistent forces that are a constant drag on productivity and reduce Project Velocity. The Variable or Dynamic Forces that decelerate the project or team members and cause the Project Velocity to be irregular.
ii.
Optimizing both of these factors prior to Calibration will improve the stability of your Velocity calculation. As the Velocity is the basis for many of the metrics we use in Agile and Scrum, it is important to have a predictable Velocity. i) Friction: Newton’s First Law States that “Every object will remain at rest or in uniform motion in a straight line unless compelled to change its state by the action of an external force.” Forces that do not propel your project will slow it down. By minimizing the forces that slow down your project, you reduce the “Friction” that reduces your Project Velocity. Less friction means higher Velocity and greater productivity. In Software development, there are countless forces that can affect the Velocity of your team. As a team leader, project manager or executive, it is up to you to minimize the external forces that negatively impact on the team’s velocity. Friction forces are more or less constant. You can’t eliminate all of them, but you can reduce many of them. Optimizing them before Calibration is important. Friction forces include: • • • •
Team composition: Are the right people with the right skills on the team. Process: Changes to your processes: Agile methods, build, release, testing, etc… Environmental factors: Interruptions, noise, poor ventilation, poor lighting, uncomfortable seating and desks, inadequate hardware or software, etc… Team dynamics: Some team members may not play nicely with others.
As you can see, most Friction type forces are largely environmental. Their effects are long term. They are also, often the easiest to address. Individually, Friction forces are usually weak forces. Cumulatively, they can have a significant impact. Obtaining optimal Team Velocity requires that they be eliminated or reduced. Tale 3 shows four friction factors with a range of values. These values have been adjusted according to their risk severity.
Team Composition Process Environmental Factors Team Dynamics
Friction (FR) is calculated as product of all four fraction factors (FF). 4
𝐹𝑅 = �(𝐹𝐹)𝑖 𝑖=1
ii) Variable or Dynamic Forces: Variable or Dynamic forces are often unpredictable and unexpected. They decelerate your project and cause a loss of Velocity. Their effects are sometimes dramatic, but their influence is often brief. Newton’s Second Law states that that “The acceleration of an object as produced by a net force is directly proportional to the magnitude of the net force, in the same direction as the net force, and inversely proportional to the mass of the object.” For our purposes, we are viewing this from the perspective of the cost (in terms of productivity) on individuals in the team, or the team as a whole. If you can’t eliminate a force that reduces Velocity (deceleration), then do your best to make it as consistent and predictable as possible (minimal and infrequent deceleration). The more consistent and predictable the force, the more consistent your Velocity will be. • • • •
• •
• •
Team changes: Adding member, losing members, changing roles and responsibilities. New tools: Introduction of new development tools, database technologies, languages, etc… require learning, and reduce Velocity until learned. Vendor defects: Defects in third party tools and software requiring developer workarounds eat into productivity and Velocity. Responsibilities outside of the project: Team members assuming additional responsibilities outside of the project. Shifting between projects can have a dramatic effect on productivity. Personal issues: Colicky baby at home, personal health, family dynamics, etc… Stakeholders: Stakeholders may not be responsive to requests for information from the developers or tester and thus create delays. They may also have unreasonable expectations of the team. Unclear requirements: Lack of clarity or detail in requirements cause unnecessary churn and rework. Changing requirements: New project specifications might require skills that are nonexistent or weak in the team. Acquiring the skills, either by introducing new team members, or by an
Ziauddin, ACSA, Vol. 2, No. 1, pp. 314-324, 2012
•
320
existing team member acquiring the skills will impact productivity. Relocation: Moving the team to a new physical location upsets the rhythm and impacts their Velocity.
Table 4 show variable or dynamic force factors. Values are assigned on the basis of same analogy as for Size. Table 4. Dynamic Force Factors Variable Factor Normal High Very High Expected Team 1 0.98 0.95 Changes Introduction of New 1 0.99 0.97 Tools Vendor’s Defect 1 0.98 0.94 Team member’s 1 0.99 0.98 responsibilities outside the project Personal Issues 1 0.99 0.99 Expected Delay in 1 0.99 0.98 Stakeholder response Expected Ambiguity 1 0.98 0.97 in Details Expected Changes in 1 0.99 0.98 environment Expected Relocation 1 0.99 0.99
Extra High 0.91 0.96 0.90 0.98
0.98 0.96 0.95
0.98
9
𝐷𝐹 = �(𝑉𝐹)𝑖 𝑖=1
Deceleration is the rate of negative change of velocity. In our case, deceleration is the product of Friction and Dynamic Forces affecting the velocity. It is calculated as D=FR x DF In order to adjust Velocity to more predictable range, we calculate Final Velocity as: V = (Vi)D 3.5 Completion Time In order to estimate duration needed to complete the project, it is calculated as: E
T = V Days
∑n i=1(ES)i (Vi)D
∑n i=1(ES)i (Vi)D
∗
Days
The unit of T in this calculation is Days which can be then converted to Months, dividing by No. of Working Days per month, Thus
1
WD Where WD is Work Days per Month.
Months
3.6 Development COST Although there is no such attribute in this model to calculate cost, however, fortunately, team in the Agile Software Development is constant. By taking Development Team Salary as Unit, we conducted a survey of 14 Pakistani companies, at CMMI level 3 to calculate monthly expenditure per project. There are companies that have more than one team, developing more than one parallel project, therefore all the expenses have been calculated for one project per month. Average Expenses per month along with their ratio to Team Salary are presented in Tale 5. Table 5. Team salary Ratio with other Expenses Expenditure Head Amount Ratio with Team Salary Team Salary Non Technical Staff Salary
560679
1
183451
0.327194348
34821
0.062105055
8736
0.015581108
Rent
14634
0.026100496
Travelling
38279
0.068272577
Furniture
2356
0.004202048
27541
0.049120798
15239
0.027179545
12781
0.022795575
Equipment 0.97
Dynamic Force (DF) is calculated as product of all nine variable factors (VF)
=
T=
Depreciation
Utility Bills Copyright & Licensing Software Purchase & Subscription Repair & Maintenance
8393
0.01496935
Stationary
5782
0.010312496
Marketing
4782
0.008528944
24790
0.044214247
Net Ratio
1.680576587
Other Expenses
By taking the Net Ratio, the Development Cost is calculated as: COST=1.681*TS*T where TS is monthly Team Salary and T is calculated Time in Months. 3.7 Uncertainty of Calculation Prediction of completion time determination depends on your confidence in your estimates, for example, if you are 100% confident in your estimate then the calculated time will also e the most probable time, but if you are not confident in your estimation then the calculated time is only
Ziauddin, ACSA, Vol. 2, No. 1, pp. 314-324, 2012
a probable prediction. In this case the time may very in a rage depending on your confidence level. We call this range as Span of Uncertainty. Lower bound of this range is Optimistic Point whereas upper bound is Pessimistic Point. In order to calculate confidence effect on Time, we introduce another variable for Confidence Level (CL) to be used to calculate Optimistic and Pessimistic Time. Time𝑃𝑟𝑜𝑏𝑎𝑏𝑙𝑒 = T
Time𝑂𝑝𝑡𝑖𝑚𝑖𝑠𝑡𝑖𝑐 =
1 − (100 − 𝐶𝐿) ∗T 100
1 + (100 − 𝐶𝐿) ∗T 100 Span of Uncertainty = Time𝑃𝑒𝑠𝑖𝑚𝑖𝑠𝑡𝑖𝑐 − Time𝑂𝑝𝑡𝑖𝑚𝑖𝑠𝑡𝑖𝑐 Time𝑃𝑒𝑠𝑖𝑚𝑖𝑠𝑡𝑖𝑐 =
3.8 Summary of the Model
321
9
𝐷𝐹 = �(𝑉𝐹)𝑖 𝑖=1
Estimated Cost of the project is calculated as COST=1.681*TS*T Where TS is the Team Salary and T is Estimated Time. By using Confidence Level in estimates (CL), Probable, Optimistic and Pessimistic Time estimates are calculated as: Time𝑃𝑟𝑜𝑏𝑎𝑏𝑙𝑒 = T Time𝑂𝑝𝑡𝑖𝑚𝑖𝑠𝑡𝑖𝑐 = Time𝑃𝑒𝑠𝑖𝑚𝑖𝑠𝑡𝑖𝑐 =
1 − (100 − 𝐶𝐿) ∗T 100
1 + (100 − 𝐶𝐿) ∗T 100
Span of Uncertainty = Time𝑃𝑒𝑠𝑖𝑚𝑖𝑠𝑡𝑖𝑐 − Time𝑂𝑝𝑡𝑖𝑚𝑖𝑠𝑡𝑖𝑐
3.9 Example
INPUT • • • • •
N No of User Stories Work Days per Month (WD) Monthly Team Salary (TS) No of Days in one Sprint (Sprint Time) Units of Effort Completed by the Team in one Sprint • Estimator Confidence in estimation (CL) METRICS • Story Size Metric (Table 1) • Story Complexity Metric (Table 2) • Friction Factor Metric (Table 3) • Variable Factor Metric (Table 4) EVALUATION Completion time (T) is calculated as T=
∑n i=1(ES)i (Vi)D
∗
1
WD
Months
INPUT No of User Stories = 53 Team Velocity = 51 Sprint Size = 10 Days No of Working days per Month = 22 Monthly Team Salary = 500000 Confidence Level in Estimation = 90% Friction Factors Team Composition 0.95 Process Environmental Factors Team Dynamics Dynamic Force Factors Expected Team Changes
Where WD is No of Work Days in a Month and ES is the User Story Effort, Calculated as
Introduction of New Tools
ES=Complexity x Size Vi is the Initial or Raw Velocity, calculated as
Team member’s outside the project Personal Issues
Vi = Units of Effort Completed / Sprint Time. Sprint Time is the No of Days in sprint. In order to adjust velocity against friction and dynamic forces, deceleration (D) is calculated as:
Expected Delay in Stakeholder response Expected Ambiguity in Details
D=FR x DF Where FR is product of all four friction factors (FF), described in Table, which is calculated as:
Expected Relocation
4
𝐹𝑅 = �(𝐹𝐹)𝑖 𝑖=1
And DF is the product of all nine variable factors, described in Table, which is calculated as
Vendor’s Defect
0.89 0.98 0.85
0.98 0.97 0.94
responsibilities
Expected Changes in environment
RESULTS EFFORT = 300 SP INITIL VELOCITY = 5.1 FRICTION FACTOR (FR) = 0.704302 DYNAMIC FORCES = 0.76749 DECELRATION = 0.540545
0.98 0.98 0.96 0.98 0.97 0.98
Ziauddin, ACSA, Vol. 2, No. 1, pp. 314-324, 2012
322
VELOCITY = 2.4 TIME = 5.2 MONTHS COST = 5241671.27 (PAK Rs) TIME Probable = 5.2 MONTHS TIME Optimistic = 5.6 MONTHS TIME Pessimistic = 6.9 MONTHS COST Probable = 5241671.27 (PAK Rs) COST Optimistic = 4717504.14 (PAK Rs) COST Pessimistic = 5765838.40 (PAK Rs)
4.
EXPERIMENTAL ANALYSIS
In order to measure estimation accuracy of the model, we collected data of 21 previously developed projects from 6 software houses. These projects have been developed using Agile Software development methodology. This experimental analysis was performed by a group of research students, who were unaware of actual results. Table 6 shows results of the study along with MRE for Time and Cost of individual estimate. Table 6. Experimental Results
P.No
Effort
Vi
D
V
Sprint Size
Work days
Team Salary
Act: Time
Est time
Actual Cost
Estimated cost
Time MRE
Cost MRE
1
156
4.2
0.687
2.7
10
22
230000
63
58
1200000
1023207.14
7.93
14.73
2
202
3.7
0.701
2.5
10
21
260000
92
81
1600000
1680663.89
11.95
5.04
3
173
4
0.878
3.3
10
22
250000
56
52
1000000
992269.51
7.14
0.77
4
331
4.5
0.886
3.8
10
22
300000
86
87
2100000
2002767.22
1.16
4.63
5
124
4.9
0.903
4.2
10
22
300000
32
29
750000
676081.32
9.375
9.84
6
339
4.1
0.903
3.6
10
22
400000
91
95
3200000
2895132.85
4.39
9.52
7
97
4.2
0.859
3.4
10
22
250000
35
29
600000
540113.84
17.14
9.98
8
257
3.8
0.833
3
10
22
250000
93
84
1800000
1614078.94
9.67
10.32
9
84
3.9
0.646
2.4
10
22
190000
36
35
500000
507264.58
2.77
1.45
10
211
4.6
0.758
3.2
10
22
250000
62
66
1200000
1267179.55
6.45
5.59
11
131
4.6
0.758
3.2
10
22
250000
45
41
800000
786732.223
8.88
1.65
12
112
3.9
0.773
2.9
10
22
200000
37
39
650000
597142.61
5.40
8.13
13
101
3.9
0.773
2.9
10
22
200000
32
35
600000
538494.68
9.375
10.25
14
74
3.9
0.773
2.9
10
22
200000
30
26
400000
394545.65
13.33
1.36
15
62
3.9
0.773
2.9
10
22
200000
21
22
350000
330561.22
4.76
5.55
16
289
4
0.742
2.8
10
22
250000
112
103
2000000
1971485.44
8.03
1.42
17
113
4
0.742
2.8
10
22
250000
39
40
800000
770857.32
2.56
3.64
18
141
4
0.742
2.8
10
22
250000
52
50
1000000
961866.44
3.84
3.81
19
213
4
0.742
2.8
10
22
250000
80
76
1500000
1453032.29
5
3.13
20
137
3.7
0.758
2.7
10
22
220000
56
51
800000
854347.55
8.92
6.79
21
91
3.7
0.758
2.7
10
22
220000
35
34
550000
567484.33
2.85
3.17
MMRE (Time) = 7.19 % MMRE (Cost) = 5.76 % PRED Time (7.19) = 57.14 % PRED Cost (5.76) = 61.90 % 7.19% MMRE for Time and 5.76% MMRE for Cost have been observed, which is fairly low rate. Prediction at the average MMRE for Time and Cost is 57.14% and 61.9% respectively, which means that estimated results for Time are predicted to be 57.14% lower than calculated MMRE whereas estimated results for Cost are predicted to be 61.9% lower than calculated MMRE for Cost. It is quite satisfactory and acceptable estimation accuracy. CONCLUSION
In this paper a software effort estimation model for Agile Software projects has been presented. The model uses User Stories of as base for estimation. In order to address different challenges faced by the agilest, the model is developed to accommodate most of the characteristics of Agile methodology, especially Adaption and Iteration. The model is practically implantable. There may be certain flaws in the model, therefore it is hoped that the work put
Ziauddin, ACSA, Vol. 2, No. 1, pp. 314-324, 2012
forward in this paper will serve as an opening for further discussion and investigation.
REFERENCES AGARWAL, R., KUMAR, M., YOGESH, MALLICK, S., BHARADWAJ, R. M. & ANANTWAR, D. (2001) Estimating Software Projects. ACM SIGSOFT Software Engineering Notes, 26, 60-67. ANGELIS, L., STAMELOS, I. & MORISIO, M. (2001) Building a Software Cost Estimation Model Based on Categorical Data. Proceedings of the 7th International Software Metrics Symposium. BECK, K., BEEDLE, M., VAN BENNEKUM, A., COCKBURN, A., CUNNINGHAM, W., FOWLER, M., HIGHSMITH, J., HUNT, A., GRENNING, J., MELLOR, S., JEFFRIES, R., KERN, J., MARICK, B., MARTIN, R. C., SCHWABER, K., SUTHERLAND, J. & THOMAS, D. (2001) The Agile Manifesto.
323
FOWLER, M. & HIGHSMITH, J. (2001) The Agile Manifesto. Software Development, August. GOLDEN, J. R., MUELLER, J. R. & ANSELM, B. (1981) Software Cost Estimating: Craft or Witchcraft. ACM SIGMIS Database, 12, 12-14. HIHN, J. & HABIB-AGAHI, H. (1991) Cost Estimation of Software Intensive Projects: A Survey of Current Practices. Proceedings of the 13th International Conference on Software Engineering. Austin, Texas. HÖST, M. & WOHLIN, C. (1997) A Subjective Effort Estimation Experiment. Information and Software Technology, 39, 755-762. JONES, C. (1996) By Popular Demand: Software Estimating Rules of Thumb. Computer, 29, 116-118. JONES, C. (2003) Why Flawed Software Projects are Not Cancelled in Time. Cutter IT Journal, 16, 12-17.
BOEHM, B. W., ABTS, C. & CHULANI, S. (2000) Software Development Cost Estimation Approaches: A Survey. USC-CSE.
JØRGENSEN, M. (2003) How Much Does a Vacation Cost? or What is a Software Cost Estimate? ACM SIGSOFT Software Engineering Notes, 28, 1-4.
BOEHM, B. W. & SULLIVAN, K. J. (1999) Software Economics: Status and Prospects. Information and Software Technology, 41, 937-946.
JØRGENSEN, M. (2004a) A Review of Studies on Expert Estimation of Software Development Effort. Journal of Systems and Software, 70, 37-60.
BOSSAVIT, L. (2003) Project Management, The Movie. Cutter IT Journal, 16, 18-23.
JØRGENSEN, M. (2004b) Top-Down and Bottom-Up Expert Estimation of Software Development Effort. Information and Software Technology, 46, 3-16.
BRIAND, L. C., EL EMAM, K. & BOMARIUS, F. (1998) COBRA: A Hybrid Method for Software Cost Estimation, Benchmarking, and Risk Assessment. Proceedings of the 20th International Conference on Software Engineering. Kyoto, Japan. BRIAND, L. C., LANGLEY, T. & WIECZOREK, I. (2000) A Replicated Assessment and Comparison of Common Software Cost Modeling Techniques. Proceedings of the 22nd International Conference on Software Engineering. Limerick, Ireland. BURGESS, C. J. & LEFLEY, M. (2001) Can Genetic Programming Improve Software Effort Estimation? A Comparative Evaluation. Information and Software Technology, 43, 863-873. CHULANI, S., BOEHM, B. W. & STEECE, B. M. (1999) Bayesian Analysis of Empirical Software Engineering Cost Models. IEEE Transactions on Software Engineering, 25, 573583. FAIRLEY, R. E. (1992) Recent Advances in Software Estimation Techniques. Proceedings of the 14th International Conference on Software Engineering. Melbourne, Australia FERENS, D. V. (1988) Software Size Estimation Techniques. Proceedings of the IEEE 1988 National Aerospace and Electronics Conference. FINNIE, G. R., WITTIG, G. E. & DESHARNAIS, J.-M. (1997) A Comparison of Software Effort Estimation Techniques: Using Function Points with Neural Networks, Case-Based Reasoning and Regression Models. Journal of Systems and Software, 39, 281-289.
JØRGENSEN, M., INDAHL, U. & SJØBERG, D. (2003) Software Effort Estimation by Analogy and "Regression Toward the Mean". Journal of Systems and Software, 68, 253-262. JØRGENSEN, M. & MOLØKKEN, K. (2003) A Preliminary Checklist for Software Cost Management. Proceedings of the 3rd International Conference on Quality Software KEAVENEY S. and CONBOY K. (2006) Cost Estimation in Agile Development Projects. Proceedings of the 14th European Conf. Information Systems (ECIS) LEE, A., HUNG CHENG, C. & BALAKRISHNAN, J. (1998) Software Development Cost Estimation: Integrating Neural Network with Cluster Analysis. Information & Management, 34, 1-9. MATSON, J. E., BARRETT, B. E. & MELLICHAMP, J. M. (1994) Software Development Cost Estimation Using Function Points. IEEE Transactions on Software Engineering, 20, 275-287. MENDES, E., WATSON, I., TRIGGS, C., MOSLEY, N. & COUNSELL, S. (2002) A Comparison of Development Effort Estimation Techniques for Web Hypermedia Applications. Proceedings of the 8th IEEE Symposium on Software Metrics MILLER G.G. (2001) The Characteristics of Agile Software Processes. Proceedings of the 39th Int’l Conf. and Exhibition on Technology of Object-Oriented Languages and Systems (TOOLS’01)
Ziauddin, ACSA, Vol. 2, No. 1, pp. 314-324, 2012
MOLØKKEN-ØSTVOLD, K., JØRGENSEN, M., TANILKAN, S. S., GALLIS, H., LIEN, A. C. & HOVE, S. E. (2004) A Survey on Software Estimation in the Norwegian Industry. Proceedings of the 10th International Symposium on Software Metrics. MOLØKKEN, K. & JØRGENSEN, M. (2003) A Review of Software Surveys on Software Effort Estimation. Proceedings of the 2003 International Symposium on Empirical Software Engineering. MUKHOPADHYAY, T. & KEKRE, S. (1992) Software Effort Models for Early Estimation of Process Control Applications. IEEE Transactions on Software Engineering, 18, 915-924. MUKHOPADHYAY, T., VICINANZA, S. S. & PRIETULA, M. J. (1992) Examining the Feasibility of a Case-Based Reasoning Model for Software Effort Estimation. MIS Quarterly, 16, 155171. PAULK, M. C. (2002) Agile Methodologies and Process Discipline. CrossTalk, The Journal of Defense Software Engineering, 15-18. PETERS, J. F. & PEDRYCZ, W. (1999) Software Engineering: An Engineering Approach, John Wiley & Sons, Inc. RUHE, M., JEFFERY, R. & WIECZOREK, I. (2003) Cost Estimating for Web Applications, Proceedings of the 25th International Conference on Software Engineering. Portland, Oregon.
324
Syafadhli A.A.B., Mohamad D. and Sulaiman N.H., DistanceBased Ranking Fuzzy Numbers, Advances in Computational Mathematics and its Applications (ACMA), Vol. 1, No. 3, 2012; pp 146-150 TAUSWORTHE, R. C. (1980) The Work Breakdown Structure in Software Project Management. The Journal of Systems and Software, 1, 181-186. Vajargah B. and Jahanbin A., Approximation theory of matrices based on its low ranking and stochastic computation, Advances in Computer Science and its Applications (ACSA) Vol. 2, No. 1, 2012; pp 270-280 Vajargah1 B.F., Moradi M. and Kanafchian M., Monte Carlo optimization for reducing the condition number of ill conditioned matrices, Advances in Computational Mathematics and its Applications (ACMA), Vol. 1, No. 1, March 2012; pp 169-173 Viswanadham K.N.S. and Raju Y.S., Quintic B-spline Collocation Method for Eighth Order Boundary Value Problems, Advances in Computational Mathematics and its Applications (ACMA),Vol. 1, No. 1, March 2012; pp 47-52 Yang X., Zhang Y., A New Successive Approximation to Nonhomogeneous Local Fractional Volterra Equation, Advances in Information Technology and Management (AITM) Vol. 1, No. 3, 2012; pp 138-141
SCHMIETENDORF A., KUNZ M., DUMKE R. (2008) Effort estimation for Agile Software Development Projects, Proceedings 5th Software Measurement European Forum, Milan
Yu-min J., Ting X, WANG Q. and SU J., Task Planning based on Intelligence Algorithm under Uncertainty, Advances in Information Technology and Management (AITM) Vol. 1, No. 4, 2012; pp 166-169
STAMELOS, I. & ANGELIS, L. (2001) Managing Uncertainty in Project Portfolio Cost Estimation, Information and Software Technology, 43, 759-768.
Zhang Y. and Lenan Wu, Artificial Bee Colony for Two Dimensional Protein Folding, Advances in Electrical Engineering Systems Vol. 1, No. 1, March 2012, pp 19-23
Shoukat A., A Reducibility of the Kampéde Fériet Function, Advances in Computational Mathematics and its Applications (ACMA), Vol. 1, No. 1, March 2012; pp 76-79
Zhang Z., Pattern Recognition by PSOSQP and Rule based System, Advances in Electrical Engineering Systems Vol. 1, No. 1, March 2012; pp 30-34
Shubatah M.Q.H., Domination in product fuzzy graphs,Advances in Computational Mathematics and its Applications (ACMA), Vol.1,No.3,2012; pp 119-125
ZIA, Z.; RASHID, A.; UZ ZAMAN, K. (2011) Software cost estimation for component based fourth-generation-language software applications, IET Software , 5, Page(s): 103-110