Third International Workshop on Structural Health Monitoring, Stanford, CA, September 12–14, 2001.
AN EXPERIMENTAL BENCHMARK PROBLEM IN STRUCTURAL HEALTH MONITORING S.J. Dyke. D. Bernal, J.L. Beck, and C. Ventura
ABSTRACT This paper focuses on the goals of the second phase of the activities of the IASCASCE Structural Health Monitoring Task Group, involving the application of structural health monitoring techniques to data obtained from a four story steel frame structure tested July 19–21, 2000 at the University of British Columbia. Damage was simulated by removing bracing within the structure. An electromagnetic shaker and mass on the top floor of the structure were used to excite the structure. Accelerometers were placed throughout the structure to provide measurements of the structural responses. Three excitation cases were considered, including one ambient vibration level in which the shaker was turned off. INTRODUCTION Structural health monitoring allows the engineer to use sensing of the structural responses in conjunction with appropriate analysis and modeling techniques, to monitor the condition of a structure. When a structure is subjected to extreme loading, a great deal of time and effort may be required to inspect it to determine how much damage the building has experienced. Additionally, over time, structures may degrade due to normal use or overuse. In many structures the inspection process is hindered by the fact that the columns, beams, and connections are typically covered by non-structural elements, and significant efforts are required to access these areas for visual inspection. The use of health monitoring techniques would simplify such procedures, allowing the engineer to ascertain the degree of structural damage withS. J. Dyke, Dept. of Civil Engrg., Washington Univ. in St Louis, St Louis, MO, 63130 USA, email:
[email protected] D. Bernal, Dept. of Civil Engrg., Northeastern Univ., Boston, MA 02115 USA, email:
[email protected] J.L. Beck, Applied Mechanics and Civil Engrg., California Inst. of Tech., Pasadena, CA 91125 USA, email:
[email protected] C. Ventura, Dept. of Civil Engrg., Univ. of British Columbia, Vancouver, BC, CANADA, email:
[email protected] 1
out requiring visual inspection of the structural connections and components. Furthermore, information on the behavior of the structure over time or during extreme loading could lead to improved design techniques. Several recent workshops and special journal issues a have focused on structural health monitoring and damage detection, e.g. [1–4]. Numerous structural health monitoring algorithms have been developed and been implemented on experimental and full-scale structure (e.g., see Refs. [5–11]). Because the techniques are applied to different structures under various conditions, the relative merits of each algorithm are not obvious. Thus, the community would benefit from a comparison of several algorithms when applied to the same problems. At the 1996 International Workshop on Structural Control [2], a plan was formed to create task groups to study the problem of structural health monitoring. Three task groups — one per region (Europe, Asia, US) — were to be assembled. The US task groups solidified in 1999 jointly under the auspices of the International Association for Structural Control (IASC) and the Dynamics committee of the ASCE Engineering Mechanics Division. This joint IASC-ASCE task group met first in June 1999 at the 13th ASCE Engineering Mechanics Conference at Johns Hopkins University, and has several subsequent meetings. The task group is charged with developing benchmarks to study the efficacy of various structural health monitoring methods. The IASC-ASCE SHM Task Group is developing a series of benchmark SHM problems, beginning with a relatively simple problem and proceeding on to more realistic (but more difficult) problems, to evaluate the potential for this technology for civil engineering structures. Phase I of this structural health monitoring benchmark problem focused on health monitoring strategies that were applied to data generated with an analytical model of the benchmark structure [12, 13]. The benchmark structure is a 2-bay by 2-bay, 4 story steel frame structure at the University of British Columbia [6, 14]. A total of six cases were considered to evaluate various structural health monitoring approaches for pure translational motion, coupled torsional and translational motions, and incomplete sensor information. The structure was damaged by removing the stiffness contributions of various structural members. Additionally, a degree of realism was added to the problem by including sensor noise. This problem was the focus of sessions at the 2000 ASCE Engineering Mechanics Conference in Austin, Texas [12, 15–20], and the 2001 ASME/ASCE Joint Mechanics and Materials Conference in San Diego. Portions of a future special issue of the Journal of Engineering Mechanics will also be devoted to various solution methods for this problem. The results of this initial study were encouraging. Thus, a second phase of this study was initiated by the IASC-ASCE Structural Health Monitoring Task Group. Phase II considers the application of these techniques to data that is obtained experimentally. The steel frame structure at the University of British Columbia (UBC), used in Phase I of these studies, was also used as the test specimen. The experiment was conducted on July 19–21, 2000. Damage was simulated by removing bracing within the structure. An electromagnetic shaker and mass on the top floor of the structure was used to excite the structure. Accelerometers are placed throughout the structure to provide measurements of the structural responses. Three excitation cases
2
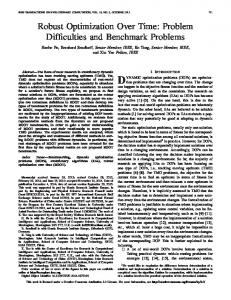
are considered, including one ambient vibration level in which the shaker was turned off. This paper first describes the structure and experimental setup, the testing procedures used during the experiment, and the various damage cases considered. We also discuss some preliminary results that were obtained using the recorded data. The data recorded during the testing of the UBC structure, a video of the experiment, and a complete description of the experimental setup are available on the ASCE Structural Health Monitoring Task Group’s web page [21]. EXPERIMENTAL SETUP Benchmark Structure The subject of the experimental benchmark problem is the 4-story, 2-bay by 2bay steel-frame scale-model structure shown in Fig. 1. It is located in the Earthquake Engineering Research Laboratory at the University of British Columbia (UBC). For the tests, the structure was mounted on a large scale shake table. However, the shake table was fixed in place and was not used to excite the structure. The structure is 2.5 m × 2.5 m in plan and is 3.6 m tall. The members are hot rolled grade 300W steel (nominal yield stress 300 MPa (42.6 kpsi)). The sections are specifically designed for this scale model. The columns are B100x9 sections and the floor beams are S75x11 sections. FIGURE 1: STEEL-FRAME SCALED A photograph of the beam-column conSTRUCTURE. nection is provided in Fig. 2. Note that the fixture connecting the braces to the structure adds a degree of flexibility to the braces. This should be considered by researchers who may consider building analytical models of the structure. To make the mass distribution more realistic, one floor slab is placed in each bay per floor: four 1000 kg slabs at each of the first, second and third levels, four 750 kg slabs on the fourth floor (see Fig. 3). Additionally, a floor grating was present on the second floor for use as a working platform. This grating added 35 kg per bay to the mass of the second FIGURE 2: CLOSE-UP OF BEAMfloor. COLUMN CONNECTIONS.
3
Y
X
(a)
(b)
FIGURE 3: MASS CONFIGURATION ON STRUCTURE (a) FLOORS 1–3 AND (b) FLOOR 4.
Excitation to the Structure The force input to the structure is provided by a Ling Dynamic Systems electroShaker dynamic shaker (Vibrator Model V450 Series). To apply enough force to the structure, mass is attached to the end of the shaker. Thus the total moving mass driven by the shaker is equal to the mass of the armature plus the mass attached to the Suppl. Masses shaker. The mass of these relevant components of the body of the shaker is 81.6 kg, FIGURE 4: ELECTRODYNAMIC The moving mass on the shaker includes SHAKER INSTALLATION. the armature (0.426 kg) and the supplemental masses attached to the end of the shaker (4.055 kg). A photograph of the shaker installation is shown in Fig. 4. The shaker is placed on the top floor of the structure along the diagonal in the center of the SW bay (see Fig. 5). The shaker has a maximum capacity of 311 N (70 lbf), a stroke of 19 mm, and a maximum achieveable velocity of 2.5 m/sec. The command to the shaker is a bandlimited white noise with components between 4.6875–30 Hz. A complete description of the shaker is available on the Task Group web site [21]. Instrumentation and Data Acquisition Several sensors were placed throughout the structure (Table 1). Four types of accelerometers were used on the structure. Additionally, one accelerometer was placed on the shaker to measure the acceleration of the moving mass, and determine the force input to the structure in the forced excitation cases. A Linear Variable Displacement Transformer (LVDT) was used to measure the displacement of the shaker mass relative to the structure.
4
Three data acquisition systems were used to record the structural responses, including a DasyLab system, a LabView system, and a Siglab system. The DasyLab and LabView systems were able to measure up to 16 channels, and the Siglab system measured four acceleration channels. On DasyLab and LabView, the data was sampled at a higher frequency and downsampled to 250 Hz, and on Siglab the sampling rate was set to 256 Hz. The Siglab system has anti-aliasing filters set to 100 Hz. The DasyLab and LabView systems do not have either analog or digital anti-aliasing filters, although several of the sensors utilize conditioning systems that include antialiasing filters (see Table 1). In some data files the sensor gains are accounted for and the values are provided in physical units (e.g., g, mm). For more details on the specific data files available, see the web site [21]. During the testing, data acquisition was started before the excitation was turned on. Thus, startup transients were recorded to allow users to synchronize the various data acquisition systems in each test if this is desired. Data was not recorded with the Labview system in the ambient vibration cases because the sensitivity of this system was not adequate. Several tests were also conducted by placing extra accelerometers on the shake table to which the structure is mounted. Although the shake table is assumed to be fixed, these tests were used to determine if the shake table was experiencing any rocking. In addition to these very specific tests, at least two accelerometers were placed on the shake table in each test case considered. The specific details of these supplemental tests are also explained on the web site [21]. TABLE 1. CHARACTERISTICS OF THE INSTRUMENTATION.
Sensor Characteristics
FBA*
DC–50 Hz
Conditioner Antialiasing Filter Cutoff –
EPISensor*
DC–200 Hz
–
5 Volts/g
Kistler (Piezo Beam)†‡
50 Hz
5 Volts/g
IC Sensors (on Structure)†
AC**–1kHz DC–350 Hz
50 Hz
0.667–1.43V/g (varies)
IC Sensors (on Shaker)*†
DC–1 kHz
50 Hz
0.222 V/g
Solartron Metrology† (on Shaker)
DC–100 Hz
50 Hz
0.611V/mm
LDVT
Accelerometers
Sensor Model
Frequency Range
Sensitivity 5 Volts/g
* Recorded with the DasyLab data acquisition system. † Recorded with the LabView data acquisition system. ‡ Recorded with the Siglab data acquisition system. ** According to documentation provided with the sensors, the time constant is 1 sec.
EXPERIMENTAL PROCEDURE A series of tests were conducted on the structure with various damage scenarios. In the tests, damage is simulated by removing braces in the structure or by loosening
5
Shaker
FIGURE 5: ACCELEROMETER AND SHAKER PLACEMENT.
the bolts at beam-column connections. The various test cases are described in Table 2. In the first test, denoted Case A, the nominal structure is tested with all braces in place. For Case B, and all subsequent tests, supplemental masses are added to the 1st (108 kg) and 2nd (51.7 kg) floors of the structure to introduce some asymmetry in the configuration. With the shaker placed on the roof along the diagonal, the structure will experience some torsion and these modes can be identified during the analysis. TABLE 2. DESCRIPTION OF TEST CASES (IN CHRONOLOGICAL ORDER).
Configuration Case Braces
Location of Brace/Connection
A
All braces*
–
B
All braces
–
C
Case B + remove one brace on floor 1
remove brace on N face, W bay
D
Case C + remove one brace on floor 3
remove brace on W face, N bay
E
Case D + loosen one connection
loosen bolts on N face to outside of W bay
F
Remove all braces, tighten loose connection
G
Case F + loosen one connection
loosen bolts on N face to outside of W bay
H
Case G + loosen second connection
loosen bolts at center connection in the E bay of N face
I
Reattach beam & repeat Case F
–
J
Repeat Case I, one day later
–
–
* Case A is the only test in which the mass is symmetrically distributed. All other cases have additional mass on the 1st and 2nd floors.
6
PRELIMINARY RESULTS 20
CSD (dB)
Transfer Function (dB)
PSD (dB)
(a) A preliminary analysis of the data 10 was conducted using the high-level 0 forced excitation test data for the nominal structure with asymmetric mass -10 distribution (Case B). The data -20 recorded with the DasyLab system was -30 employed and transfer functions from the input force to the acceleration -40 responses were determined. -50 0 50 100 Representative plots of the hi-level Frequency (Hz) vibration data from Case B are pro-20 vided in Fig. 6. The first plot in this fig(b) ure contains the spectral density -40 function for the acceleration of the shaker mass, which indicates the fre-60 quency content of the excitation to the structure. Note that the shaker is unable -80 to input significant forces at low frequencies due to stroke limitations. From 10–100 Hz the acceleration lev-100 0 5 10 15 20 25 els are relatively flat, indicating that Frequency (Hz) the excitation is uniform over this -50 (c) region. The second plot in this figure shows the transfer function from the -100 shaker acceleration to the third floor acceleration over the frequency region -150 of interest. Twenty averages were used to compute this transfer function. Note -200 that the modes are closely spaced, although the transfer function is quite -250 clean in other respects. The low fre0 5 10 15 20 25 Frequency (Hz) quency noise is due to the lack of significant force input in this region. The FIGURE 6: TYPICAL RESPONSES: third plot provides the cross-spectral (a) HI-LEVEL SHAKER ACCEL. SPECTRUM, (b) TRANSFER FUNCTION FROM SHAKER density between the first and fourth TO THIRD FLOOR ACCEL., AND floor accelerations. Note that this is (c)ACCEL. CROSS-SPECTRAL DENSITY FUNCTION significantly noisier than the transfer FOR FIRST AND FOURTH FLOOR ACCELS. function provided in (b). Two lateral and one torsional mode were identified. The first three modes of the nominal structure are shown in Fig. 7. Various researchers employed various methods, and the results were all similar to those included herein. The results are qualitatively similar to those obtained using the numerical model of the structure [12, 13], although they cannot be compared directly as the masses vary in terms of the distribution and values.
7
y
z
z
x
y
z
z
z
x
y
x
x
y
MODE 1: 5.82 HZ MODE 2: 6.14 HZ (LATERAL WEAK DIRECTION) (LATERAL STRONG DIRECTION)
y
x
MODE 3: 12.9 HZ (TORSIONAL)
FIGURE 7: RESULTS OBTAINED IN PRELIMINARY DATA ANALYSIS.
SUMMARY Experiments have been conducted to obtain data for the second phase of a benchmark problem in structural health monitoring. Preliminary results were obtained to identify the first three modes of the structure. Phase II of this benchmark problem on structural health monitoring is currently being considered by the IASC-ASCE Task Group on Structural Health Monitoring. Phase I of this benchmark problem is expected to be a focus of a future issue of the Journal of Engineering Mechanics. The Task Group would appreciate any comments or suggestions on this work. More details on this study, as well as the current and future efforts of the Task Group, are available on the Task Group’s web site [21]. ACKNOWLEDGMENTS Support to conduct this experiment was provided in part by NSF grants CMS– 9733272 and EEC–9820506. The authors also wish to thank the other members of the IASC-ASCE SHM Task Group for their assistance, suggestions, and cooperation in the development of this benchmark problem; particularly: Raimondo Betti (Columbia Univ.), Joel P. Conte (UCLA), Erik. A. Johnson (Univ. of Southern Calif.), Lambros Katafygiotis (Hong Kong Univ. of Sci. and Tech.), H.F. Lam (Hong Kong Univ. of Sci. and Tech.), Sami F. Masri (Univ. of Southern Calif.), and Andrew Smyth (Columbia Univ.). Thanks especially to Houman Ghalibafian and Medhi 8
Kharrazi at the University of British Columbia for their assistance in setting up and conducting the experiment described herein. Also, thanks to Kelvin Yuen (Calif. Inst. of Technology), and to Ellen Beckmann and Suzy Hyun (Wash. Univ. St. Louis) for assistance in conducting the experiment and to Juan Caicedo (Wash. Univ. St. Louis) for providing several of the graphics contained herein. REFERENCES 1. Chang, F.-K. (1999). Structural Health Monitoring, Proceedings of the 2nd International Workshop on Structural Health Monitoring, Stanford University, September 8–10, 1999, Technomic Publishing Co., Lancaster, PA. 2. Chen, J.C., ed. (1996). Proceedings of the Second International Workshop on Structural Control: Next Generation of Intelligent Structures, Hong Kong, December 18–21, 1996. Available on the web pages of the US Panel on Structural Control Research http://cwis.usc.edu/dept/civil_eng/ structural/welcome.html . 3. Ghanem, R. (ed.), 2000. Journal of Engineering Mechanics, Special Issue on Structural Health Monitoring, July. 4. Yao, J.T.P. (ed.), 2001. Computer-aided Civil and Infrastructure Engineering, Special Issue on Structural Health Monitoring, Vol. 16, 2001, No. 1. 5. Doebling, S.W., C.R. Farrar, M.B. Prime, and D.W. Shevitz (1996). “Damage Identification and Health Monitoring of Structural and Mechanical Systems from Changes in their Vibration Characteristics: A Literature Review.” Los Alamos National Laboratory Report, LA-13070-MS (http://www.lanl.gov/projects/ncsd/pubs/lit_review.pdf). 6. Black, C.J., and C.E. Ventura. “Blind Test on Damage Detection of a Steel Frame Structure.” Proceedings of the 16th International Modal Analysis Conference (IMAC XVI), Santa Barbara, California, February 2–5, 1998, pp. 623–629. 7. Farrar, C.R., and James, G.H., III (1997). “System Identification from Ambient Vibration Measurements on a Bridge,” Journal of Sound and Vibration, 205(1), pp. 1–18. 8. James, G.H., Carne, T.G., Lauffer, J.P., and Nord, A.R., “Modal Testing Using Natural Excitation,” Proceedings of the 10th International Modal Analysis Conference, San Diego, California, 1992. 9. James, G.H., Carne, T.G., and Mayes, R.L., “Modal Parameter Extraction from Large Operating Structures using Ambient Excitation,” Proceedings of the 14th International Modal Analysis Conference, Dearborn, Michigan, 1996. 10. Beck, J.L, Vanik, M.W., and Katafygiotis, L.S., “Determination of Modal Parameters from Ambient Vibration Data for Structural Health Monitoring,” Proceedings of the First World Conference on Structural Control, Pasadena, CA, June 3–7, 1994, pp. TA3 3–12. 11. Beck, J.L., Vanik, M.W., Polidori, D.C., and May, B.S., “Structural Health Monitoring Using Ambient Vibrations,” Proceedings of the Structural Engineers World Congress, Paper T118-3, San Francisco, July 19-23, 1998. 12. Johnson, E.A., Lam, H.F., Katafygiotis, L., and Beck, J., “A Benchmark Problem for Structural Health Monitoring and Damage Detection,” Proceedings of the 14th ASCE Engineering Mechanics Conference, Austin, Texas, May 21-24, 2000. 13. Johnson, E.A., H.F. Lam, L.S. Katafygiotis, and J.L. Beck. 2001. “The Phase I IASC-ASCE Structural Health Monitoring Benchmark Problem using Simulated Data,” ASCE Journal of Engineering Mechanics, in review. 14. Park, S., N. Stubbs and R.W. Bolton., “Damage Detection on a Steel Frame Using Simulated Modal Data.” Proceedings of the 16th International Modal Analysis Conference (IMAC XVI), Santa Barbara, California, February 2-5, 1998, pp. 612–622. 15. Lus, H. and Betti, R., “Damage Identification in Linear Structural Systems,” Proceedings of the 14th ASCE Engineering Mechanics Conference, Austin, Texas, May 21-24, 2000.
9
16. Bernal, D. and Gunes, B., “Observer/Kalman and Subspace Identification of the UBC Benchmark Structural Model” Proceedings of the 14th ASCE Engineering Mechanics Conference, Austin, Texas, May 21-24, 2000. 17. Katafygiotis, L. S., Lam, H. F. and Mickleborough, N., “Application of a Statistical Approach on as Benchmark Damage Detection Problem” Proceedings of the 14th ASCE Engineering Mechanics Conference, Austin, Texas, May 21-24, 2000. 18. Corbin, M., Hera, A., and Hou, Z., “Locating Damage Regions Using Wavelet Approach,” Proceedings of the 14th ASCE Engineering Mechanics Conference, Austin, Texas, May 21-24, 2000. 19. Au, S.K. Yuen, K.V., and Beck, J., “Two-Stage System Identication Results for Benchmark Structure,” Proceedings of the 14th ASCE Engineering Mechanics Conference, Austin, Texas, May 21-24, 2000. 20. Dyke, S.J., Caicedo, J.M., and Johnson, E.A., “Monitoring of a Benchmark Structure for Damage Detection,” Proceedings of the 14th ASCE Engineering Mechanics Conference, Austin, Texas, May 21-24, 2000. 21. IASC-ASCE Structural Health Monitoring Task Group Web Page: http://wusceel.cive.wustl.edu/ asce.shm/
10