This is a pre-print version of the paper appearing in Jl. of Interactive Learning Research (2010) 21 (1), 5-45. ©AACE. Printed with permission (http://www.aace.org).
An Exploratory Study of Interactivity in Visualization Tools: ‘Flow’ of Interaction HAI-NING LIANG, PAUL C. PARSONS, HSIEN-CHI WU, AND KAMRAN SEDIG The University of Western Ontario, Canada
[email protected] [email protected] [email protected] [email protected] This paper deals with the design of interactivity in visualization tools. There are several factors that can be used to guide the analysis and design of the interactivity of these tools. One such factor is flow, which is concerned with the duration of interaction with visual representations of information—interaction being the actions performed by users on these representations and the reactions given back by the representations. Four forms of flow can be identified: 1) continuous action, continuous reaction; 2) continuous action, discrete reaction; 3) discrete action, continuous reaction; and 4) discrete action, discrete reaction. Structuring micro-level interactions of tools based on these forms of flow can have varying effects on the cognitive processes of users. Based on this classification of flow, four versions of an interactive visualization tool were created and studied. The testbed for this study was 3D geometric solids— more specifically, Platonic and Archimedean solids. A multi-method empirical study was conducted to evaluate the usability of these four interfaces and their effect on learning, visual thinking, and exploration. This paper reports some findings of this study.
This is a pre-print version of the paper appearing in Jl. of Interactive Learning Research (2010) 21 (1), 5-45. ©AACE. Printed with permission (http://www.aace.org).
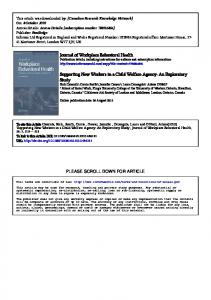
1. Introduction Interface design is challenging. A substantial amount of research effort has been channeled into making tools easy and intuitive to use so that users can perform their tasks efficiently and effectively (Preece et al., 2002). These productivity tools are intended to minimize effort, while maximizing performance. In contrast, most visualization tools intended to facilitate knowledge-oriented activities have different goals. Instead of minimizing effort, they attempt to encourage and engage users into thinking and reflecting on the concepts being explored (Sedig et al., 2001). The interface of such tools, besides needing to be easy to learn and intuitive to work with, should be able to engage users in sense-making and knowledge construction. Design of interactive visualization tools involves at least two related aspects: representation design and interaction design (Thomas & Cook, 2005; Spence, 2007). Representation design is concerned with the creation of appropriate visual encodings to support users’ sense-making and other knowledge-oriented activities. The same information (e.g., concept, structure, and/or idea) can be depicted using different types of representations. Each type can influence how users reason about and think with the represented information. More importantly, the type of representation affects the amount of cognitive effort needed during interpretative analysis, reasoning, and mental manipulation (Larkin & Simon, 1987; Zhang & Norman, 1995; Cheng et al., 2001). For example, Figure 1 shows two types of representations. Figure 1a displays information using a map, which emphasizes the relational properties among the encoded 3D shapes. In contrast, Figure 1b presents only one object which can be changed into any of the shapes displayed on the map. Although all the shapes are present in latent form, users can view only one shape at the time. As a result, the map may be better for promoting the examination of relationships and comparative reasoning, while the single object representation may be more fitting for encouraging the investigation of structural properties (Sedig et al., 2005).
(a)
(b)
Figure 1. Two types of representations of the same content Interaction design, the second design aspect, is concerned with the manner in which users are allowed to operate or act upon the representations. Just as there can be different ways of representing information, there can also be varied ways by which users can interact with these representations (Sedig & Sumner, 2006). Some ways are more conducive for reflective thinking and learning purposes, while others can have unwanted learning outcomes (Svendsen, 1991; Golightly, 1996; Holst, 1996; Sedig et al., 2001).
This is a pre-print version of the paper appearing in Jl. of Interactive Learning Research (2010) 21 (1), 5-45. ©AACE. Printed with permission (http://www.aace.org).
For example, Svendsen (1991) reports that, in solving graphical puzzles, participants who used a command- or text-based interface reflected more and were more strategic in their actions, and, thus, learned more than those who used a mouse-based interface. Likewise, Sedig et al. (2001) describe how different operationalizations of mouse-based interactions affect children’s processing of information and their degree of reflection on 2D transformational geometry concepts. Rather than allowing children to directly manipulate and move 2D geometric pieces (e.g., squares, triangles) to solve puzzles, they have to do so by acting upon the pieces indirectly, by manipulating another intermediary representation. The latter operationalization of the same interaction seems to have encouraged children to reflect more on their actions, leading to an improved learning experience. Users’ visual exploration and reasoning can be characterized at multiple levels of granularity (Gotz & Zhou, 2008). These levels are tasks, sub-tasks, actions, and events. Tasks and sub-tasks represent high-level structures of a user’s cognitive processes, such as their goals and sub-goals. Tasks include scenarios such as analyzing the stock market or making sense of a particular shape transforming into another. Sub-tasks aid in the completion of tasks, and examples include finding the best and worst stocks, or finding how many edges a shape has. Actions refer to executable steps taken by users while completing a task, such as probing, arranging, composing, comparing, and so on (Sedig & Sumner, 2006). Events are at the lowest level of granularity. They are micro-level occurrences such as mouse clicks or drags, keyboard strokes, and menu-item selections, which are performed in unison with actions to complete tasks. To perform tasks, one often needs to process information retrieved from internal representations, as well as information perceived from external representations, in an integrative and dynamic manner (Zhang, 2000). The theory of distributed cognition proposes the idea that cognition is not solely a product of one’s internal cognitive processes, but rather an emergent property of interactions among internal and external representations and artifacts (Hollan, Hutchins, & Kirsh, 2000; Karasavvidis, 2002; Zhang & Norman, 1994; Salomon, 1993; Hutchins, 1995). In this context, external representations and artifacts are not only peripheral aids to cognition, rather they are essential components of cognitive processes, distributed across the mind of the user and their environment. External representations serve to anchor and structure cognitive behavior, by constraining, supporting, guiding, transforming, and enhancing the cognitive processes and activities of users (Zhang, 1991; Sedig & Liang, 2008). Interactive visualization tools comprise a subset of these external representations and artifacts. These tools are situated at the level of the interface, playing a mediating role between users and the information with which they are interacting (Sedig & Liang, 2006). It is often the case that researchers discuss only high-level details when designing visual tools for the purpose of supporting knowledge-oriented activities. This study, however, demonstrates that the choice of actions, coupled with low-level events, has an effect on the cognitive processes of users. It is the structure of interaction, that is, the micro-level interactions in the form of events, which can be operationalized in certain ways in order to affect the reasoning and sensemaking processes of users. In the context of interaction design, the facet that examines how interactions can and should be operationalized is interactivity design. Recently, Sedig and Liang (2006) have devised a framework that can be used to analyze and design the interactivity of
This is a pre-print version of the paper appearing in Jl. of Interactive Learning Research (2010) 21 (1), 5-45. ©AACE. Printed with permission (http://www.aace.org).
visualization tools. This paper extends that previous research and explores an application of the factor of interaction flow and its effect on visual exploration and reasoning. To this end, an educational visualization tool was created and an empirical usability study was conducted with four versions of the tool involving high school students. This paper reports some findings of this study. The remainder of this paper is structured as follows. The next section will provide some terminological and conceptual background information, including an elaboration of the concepts of interaction, interactivity, and the factor of flow. Next, the research methodology will be described, including the visualization context, the study tool, and study design. The section after that will report the results of the study, followed by a discussion section. Finally, the last section will present the conclusions derived from this study. 2. Background and terminology Interaction is concerned with the dialectic process of a user acting upon a representation through the intermediary of a human-computer interface, and the representation responding back to this action for the user to interpret. Interaction can act as an epistemic extension of static representations by adding a temporal dimension to them. This temporality of representations can extend their communicative power as users can dynamically explore them in order to discover their latent meanings and hidden properties. Interaction enables users to transform, manipulate, and navigate through the distinct elements and features of representations. As such, interaction has a great influence on what and how a user explores, reasons with, and learns from the representations. That is, the manner in which interaction is operationalized can determine whether and how different cognitive processes are supported, enhanced, canalized, guided, promoted, scaffolded, and/or constrained (Sedig & Liang, 2006). In this context, interaction design can play an important role in visualization tools, as designers can operationalize an interaction in such a way that promotes thinking and reflection of the represented content. More importantly, this can be achieved in a tacit manner, just as users explore the embedded representations in the tool. Interaction and interactivity, although closely related, are distinct concepts. Whereas interaction refers to the action and response provided in return, interactivity refers to the feel, properties, and quality of interaction (Sedig & Liang, 2006). For instance, interaction with a representation can be through manipulation. However, this interaction can be through direct manipulation of a representation or through indirect manipulation— i.e., via a second intermediary representation. Whereas in both cases interaction is manipulation, the feel and properties (i.e., interactivity) of direct and indirect manipulation are different, which can affect users’ attentive processes and degree of learning (for a more detailed discussion and examples, see Golightly, 1996; Sedig et al., 2001). Interactivity of representations (or tools) can affect the amount of cognitive effort users put into making sense of the inherent features and meanings of the representations, how their different thought and reasoning processes are supported, how deeply they learn, how engaged they become with the tool, and the interchange between them and the tool (Kirsh, 1997; Burgoon et al., 2000; Preece et al., 2002).
This is a pre-print version of the paper appearing in Jl. of Interactive Learning Research (2010) 21 (1), 5-45. ©AACE. Printed with permission (http://www.aace.org).
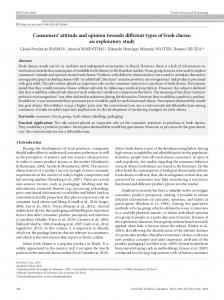
Sedig & Liang (2006) have suggested that a set of factors can assist in the analysis and design of the interactivity of visualization tools. These factors can serve as a descriptive and conceptual framework to aid in the design of such tools. Each of these factors of interactivity can be operationalized and structured in certain ways, which can affect the cognitive processes of users. One of these factors, which has been chosen as the focus of this study, is flow1. In this study the low-level operational structure of interaction has been analyzed and tested, and has been shown to have an impact on the way users reason and make sense of represented information. The study was performed to validate one of the elements of the previous framework (flow) and to examine its impact on users’ cognitive processes. Flow is a factor that is present in all types of interaction. It is concerned with the duration of interaction with a representation. As such, flow is equally about the action performed on the representation, as well as the reaction given by the representation. In the context of interaction with information spaces, many researchers (such as Spence, 2007) refer only to continuous action, or to continuous action coupled with continuous reaction, which they then call continuous interaction. That is, no distinction is made between the continuity or discreteness of the action and that of the reaction. This approach may be fine for certain purposes, but interaction should be examined in greater detail for the purpose of facilitating knowledge-oriented activities. Both action (cause) and reaction (effect) aspects of interaction occur in time. This being the case, interaction flow can happen in two ways: continuous and discrete. Whereas continuous flow occurs when both cause and/or effect happen in a fluid, uninterrupted manner over a span of time, discrete flow occurs when both cause and/or effect take place in a distinct, separate manner, at one instance in time. Given continuous and discrete flow, users can perceive interaction in four ways: continuous action, continuous reaction (C-C); continuous action, discrete reaction (C-D); discrete action, continuous reaction (D-C); and discrete action, discrete reaction (D-D). Using the figures below, instances of applying the four forms of flow are provided next. In the event of a user wanting to interact with a representation, the forms can guide the operationalization of action and reaction. An instance of C-C flow can be seen in Figure 2. This data analysis tool (www.miner3d.com) is meant to assist users in understanding the effects of drugs in an Alzheimer study. Figure 2a shows the original window with multiple sliders on the right that are controlled by continuously dragging the bidirectional arrows (i.e., continuous action). The effect of dragging the arrows is shown in Figure 2b, and is simultaneously and continuously displayed in a fluid manner and without any time delay (i.e., continuous reaction). Figure 3 shows another example of C-C flow, this time in a tool for exploring planets (Google Earth). In order to rotate the earth, users click and drag in the direction of rotation (i.e., continuous action), and the effect is shown immediately and fluidly (i.e., continuous reaction).
1
Other factors include: affordance, cognitive offloading, constraints, distance, flexibility, focus, and transition (Sedig & Liang, 2006).
This is a pre-print version of the paper appearing in Jl. of Interactive Learning Research (2010) 21 (1), 5-45. ©AACE. Printed with permission (http://www.aace.org).
(a)
(b)
Figure 2. C-C flow with visual analytics software Used with permission from www.miner3d.com
(a) (b) Figure 3. C-C flow with Google Earth (www.earth.google.com) In the case of C-D, the action is performed in the same manner as in C-C—i.e., continuously. However, the effect of the action is not continuously shown, but displayed only after the action has been fully completed (i.e., discrete reaction). Figure 4 shows an example of C-D flow in a tool for geographic analysis and route-panning (Google Maps). Users drag the slider on the left (Figure 4a) to increase or decrease the zoom in the same manner as the C-C examples above, however the reaction does not occur until the dragging has stopped and the mouse button has been released (Figure 4b).
This is a pre-print version of the paper appearing in Jl. of Interactive Learning Research (2010) 21 (1), 5-45. ©AACE. Printed with permission (http://www.aace.org).
(a) (b) Figure 4. C-D flow with Google Maps (www.maps.google.com) In the case of D-C, instead of allowing dragging of components (i.e., continuous action), these can only be clicked on (i.e., discrete action). This type of flow is also available with Google Maps, when using the pan tool in the top left corner. When a mouse-click takes place to pan in a particular direction (i.e., discrete action), an animated process shows the effect of the action smoothly and continuously (i.e., continuous reaction).
(a)
(b)
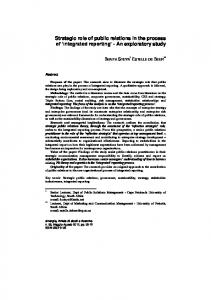
Figure 5. D-D flow with a biology tool Used with permission from www.cellsalive.com Finally, in the case of D-D, similar to D-C, the action is performed through mouseclicks. When a mouse-click takes place (i.e., discrete action), the effect is shown instantly (i.e., discrete reaction). Figure 5 provides an example of a tool for learning about cell mitosis that uses D-D flow. Users are initially presented with the first stage of mitosis (Figure 5a). By clicking on any of the stages on the right side of the tool (i.e., discrete action), the effect will be shown immediately, with no transitional process being shown (i.e., discrete reaction). Figure 5b shows the result of a user clicking on the second phase. Although there might be other ways of operationalizing these four forms of flow, the important point to note here is that each form can lead to different styles of exploration. This might even affect how one reasons with the representations and the amount of effort needed to understand the transitional changes of the representations. The categorization based on the concept of flow is useful for designers of visualization tools as it can assist them in deciding how to operationalize interactions in ways that may encourage greater reflection and exertion of mental effort. For example, designers can control whether actions are performed in a continuous or discrete fashion. Similarly, designers can choose whether the reactions to these actions are provided continuously or discretely. Norman (1988) has devised an action cycle framework that describes the steps taken to achieve a goal while interacting with an external artifact. Users must devise a goal or intended task, and decide on actions needed to meet the desired goal. Once this is done, users execute the actions, using low-level events in order
This is a pre-print version of the paper appearing in Jl. of Interactive Learning Research (2010) 21 (1), 5-45. ©AACE. Printed with permission (http://www.aace.org).
to meet their goal. Now that an action has been completed, users must make sense of the reaction given from the tool, and compare the result to the original goal. Norman refers to the amount of effort needed to evaluate the effect of the interaction with the tool and how well original goals have been met as the gulf of evaluation. When flow is in a continuous manner, it is expected that the gulf of evaluation would be small. But when the flow of an interaction is discrete, the gulf of evaluation may be bigger, since more mental processing is required to make sense of the changes. Continuity of action might be more natural and provide users with a greater sense of control over their exploration. However, as reversal of action is easy, when provided with continuous actions, users’ exploration might be less planned and more opportunistic. When actions can only be performed discretely, reversal of actions might be more difficult, encouraging users to do more planning and thinking before committing to an action. In the same way, there are differences between reactions that are provided continuously or discretely. An instance of how continuous reaction can be provided is animation. Animation might be beneficial for understanding as it can draw users’ attention to what is important. One of the drawbacks of animation, however, is that it may increase the visual explicitness of representations, which might then cause the reduction of mental effort and reasoning on the part of users due to overconfidence in the amount of knowledge obtained from the animation (Jones & Scaife, 2000). In contrast, when reactions are provided discretely, users only see the initial and final resulting states of the representation. This being the case, users need to connect the two by mentally visualizing the intermediate stage(s). This can be difficult for some users, especially when the initial and final states of the representations are conceptually distant from one another. As such, by creating this disconnect, discreteness of reactions can be used to promote deeper reasoning during exploration. Similarly, designers can manipulate how cause and effect are provided during userrepresentation interaction. Generally, in tools that facilitate knowledge-oriented activities, cause and effect are linked; however, they can be separated. As it allows users to perceive cause and effect concurrently, linking the two in time may be more intuitive and natural, but it might require less effort and reflection during interaction. On the other hand, separating cause from effect (e.g., when the provision of effect is withheld and delayed) may implicitly encourage users to visualize or conceive the effect in their minds first. When the effect is actually given, users can confirm or rectify their earlier mental conceptions. As such, this delay might help elicit greater reflective, self-monitoring, and self-correcting cognition (Corbett & Anderson, 2001), as opposed to a more automatic, shallow processing of information promoted when cause and effect are provided without such delay (Liang & Sedig, 2007). The following section presents the research methodology, which includes the visualization tool, the context domain, the four different interfaces of the tool, and the usability evaluation. 3. Research methodology A visualization tool was created to investigate the effect on visual exploration and reasoning when interaction is operationalized based on the four forms of flow. This tool allowed its users to interact with representations of 3D geometric solids and explore their structural properties and relational transformations. Four versions of the tool were made
This is a pre-print version of the paper appearing in Jl. of Interactive Learning Research (2010) 21 (1), 5-45. ©AACE. Printed with permission (http://www.aace.org).
available, with each version corresponding to an application of one of the four forms of interaction flow. A usability study was conducted involving high-school students. 3.1.1. Problem domain and justification The problem domain chosen to conduct this research is 3D geometry, and, in particular, Platonic and Archimedean solids. Platonic solids are 3D shapes that are composed of one type of regular polygons2. Because of this property, Platonic solids look identical from every vertex. A cube, for example, is a Platonic solid since it is composed of only squares, with three squares meeting at each vertex. Archimedean solids, on the other hand, are shapes composed of two or more types of regular polygons. Platonic and Archimedean solids are closely related and can be obtained from one another. Simultaneous truncation of all the vertices and/or edges of a Platonic solid can result in other Platonic or Archimedean solids. For example, the truncation of all eight vertices of the cube will result in the truncated cube, which is an Archimedean solid as it is composed of two regular polygons (i.e., octagons and triangles). This truncation process is similar to that of cutting or chopping off successively and symmetrically the vertices and/or edges until the faces of the solids become regular (see figures 6 and 7).
Figure 6. Sequence of snapshots in the truncation of all the vertices of a cube
Figure 7. Sequence of snapshots in the truncation of all the vertices and edges of a cube Platonic and Archimedean solids provide a viable testbed for this study. This domain area was chosen for the following three reasons. First, although Platonic and Archimedean solids can be described using algebraic (i.e., symbolic) representations, they readily lend themselves to be communicated using visual (i.e., diagrammatic) representations. Because the emphasis of this research is on visual reasoning and exploration, the solids can serve well for examining whether design based on the flow factor can have an effect and what this effect might be. Second, the successive truncation of vertices and/or edges represents transitional, metamorphic processes (Morey et al., 2001). Understanding these processes might not be easy and requires thinking and 2
A regular polygon is a 2D shape whose sides are all of equal length. Hence, a rectangle is not a regular polygon, but a square is a regular polygon.
This is a pre-print version of the paper appearing in Jl. of Interactive Learning Research (2010) 21 (1), 5-45. ©AACE. Printed with permission (http://www.aace.org).
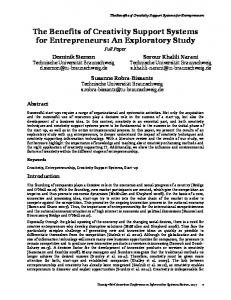
reasoning about how one solid changes or morphs into another (see figures 6 and 7). That is, users need to compare two solids (i.e., a beginning morphing solid and a final morphed solid) and the many intermediate solids in between. It is possible to manipulate how users act upon the solid representations and how the representations respond to users’ actions according to the four forms of flow. Third, transformation of 3D geometric solids has parallel and widespread applications in other domain areas, such as geological, biological, and chemical transitions. For example, various metamorphic rock types can form from sedimentary rock through changes in temperature, pressure, deviatory stress (tension, compression, shearing), or chemical active fluids. As such, results from this study can have implications in the design of visualization tools intended to support learning in other domain areas. To conduct this study, four versions of a visualization tool dealing with Platonic and Archimedean solids were created. Each version corresponded to an implementation of one form of interaction flow. Before describing how users can interact with the different versions of the tool, its interface layout and main components will be briefly provided next, as they are similar in all four versions. 3.1.2. Study tool: Interface layout and components Figure 8 shows a screen capture of the layout and components of the study tool. The tool has four panels: three ‘map’ panels (panels 1-3) and the Enlarged Solid Panel (panel 4). The three maps group related solids and lay them out as triangular maps. The maps communicate the transitional processes by which solids can be obtained from each other. Each map corresponds to a Platonic solid. The solid displayed on the top right corner represents the base Platonic solid, whereas the remaining solids (displayed on the intersecting lines) indicate the locations of other regular solids that can be obtained from the base Platonic solid. Three types of spatial information are encoded in these maps: 1) landmark, or the location of each regular solid on the maps; 2) route, or the transitional routes connecting the solid landmarks; and 3) survey, the entire space of landmarks and transitions in the maps. As such, the manner in which the maps organize the space of solids is intended to help users in understanding their relationships and transformations (Glasgow et al., 1995; Tversky, 2000). The maps display three types of solids: Selected, Twin, and Regular. The Selected Solid represents the currently in-focus shape on the maps. There is at most one Selected Solid and the map where it is located becomes the only active map. This solid is emphasized by a surrounding yellow circle. For example, the current Selected Solid is shown in Figure 8 and is located on the Cube Map (Panel 3). Users can move the Selected Solid anywhere on the active map (how users move the Selected Solid differs according to each version and is discussed later). A Twin Solid has the same structural properties as the Selected Solid, but differs in the way it is obtained. This is because Platonic solids share similar properties and are closely related. For instance, in Figure 8, the Selected Solid (Panel 3) is on the Cube Map but there is also one Twin Solid on the Octa Map (Panel 2). This means that the same solid can be obtained from either the octahedron or the cube. Also, besides showing structurally-congruent shapes, the Twin Solid enables users to navigate across maps. That is, users can only move to another map when there is a Twin Solid on it. This is a design constraint put in place to encourage users to explore and understand the relationships among the solids.
This is a pre-print version of the paper appearing in Jl. of Interactive Learning Research (2010) 21 (1), 5-45. ©AACE. Printed with permission (http://www.aace.org).
Panel 1
Panel 2
Panel 4
Panel 3
Figure 8. Screen capture of the visualization tool The fourth panel displays the enlarged version of the Selected Solid. It is provided to assist users in exploring the structural properties of the solids with more ease. The Enlarged Solid displays three kinds of information: 1) the deriving Platonic solid, represented by the outer wire frame; 2) the location of the Selected Solid, indicated by the dot located on the triangle; and 3) the actual in-focus solid, displayed as the internal shape with colored faces. The Enlarged Solid and the maps are dynamically-linked (see Figure 9). Dynamic linking is important for learning systems where multiple representations are used (Scaife & Rogers, 2005; Sedig & Liang, 2006). In the tool, once users have identified a solid they want to explore further by interacting with the Selected/Twin Solid, they can switch their interaction and focal to the Enlarged Solid, where they can rotate the solid to perform exploratory and other related activities.
This is a pre-print version of the paper appearing in Jl. of Interactive Learning Research (2010) 21 (1), 5-45. ©AACE. Printed with permission (http://www.aace.org).
Figure 9. Snapshots of the dynamic linking of the Cube Map and the Enlarged Solid Before describing in detail, Table 1 shows the summary of the four different versions of the study tool based on how actions can be carried out and how the effects are displayed. When interacting with the Selected/Twin Solid, both the Selected and Enlarged solids are affected. On the other hand, when interacting with the Enlarged Solid, the effect is restricted only to itself—i.e., the Selected/Twin Solid is not affected by it. Action
Maps (Morphing of both the Selected/Twin Solid and Enlarged Solid)
Reaction
Action Enlarged Solid (Rotating of the solid) Reaction
C-C Continuously dragging of Selected/Twin Solid
C-D Continuously dragging of Selected/Twin Solid
Continuous update of the Selected/Twin Solid
Continuous update of the Selected/Twin Solid
Continuous update of the Enlarged Solid to match the Selected Solid
Instant update of Enlarged Solid occurs only after mouse drag is stopped
Continuously dragging of the Enlarged Solid
Continuously dragging of outer frame of Enlarged Solid
Continuous update of the Enlarged Solid
Instant update of internal solid matching it to the outer frame occurs only after mouse drag is stopped
D-C Discretely clicking on locations within the maps Continuous and automated update in the form of animated movement and morphing of the Selected/Twin solids Continuous and automated update in the form of animated morphing of the Enlarged Solid
D-D Discretely clicking on locations within the maps Instant jumping of the Selected/Twin solids from current location to new location
Discretely clicking on the arrows located around the Enlarged Solid Continuous and automated update in the form of animated movement of Enlarged Solid
Discretely clicking on the arrows located around the Selected Solid Instant update of the Enlarged Solid rotated towards the selected rotational direction
Instant update of the Enlarged Solid to match the Selected Solid
Table 1. Different implementations of the study tool based on the four types of interaction flow 3.1.3. Continuous-Continuous (C-C) interface The C-C interface is shown in Figure 8. In this interface, actions can be performed continuously, with reactions provided in a continuous manner. As stated earlier, users can interact with the active map, indicated by its darker colored lines and the presence of the Selected Solid. In this interface, users can position the mouse-cursor on the Selected Solid and, while pressing the mouse-button, drag the solid around continuously and position it anywhere on the map (i.e., continuous action). As the Selected Solid is being dragged, the Enlarged Solid changes and updates itself continuously, matching shape of Selected Solid (i.e., continuous reaction). Figure 9 shows an instance of C-C interaction. Similarly, when interacting with the Enlarged Solid, both action and reaction aspects are continuous. For instance, when users want to rotate the solid, they can do so by
This is a pre-print version of the paper appearing in Jl. of Interactive Learning Research (2010) 21 (1), 5-45. ©AACE. Printed with permission (http://www.aace.org).
positioning the mouse-cursor on the solid and dragging it towards the direction of their preference. This results in constant and continuous update of the Enlarged Solid. 3.1.4. Continuous-Discrete (C-D) interface The C-D interface looks exactly like the C-C interface. Also, the way in which actions can be performed is similar to the C-C version—i.e., continuously. The difference between these two interfaces is primarily based on how reactions are provided. During continuous action with the Selected Solid, the Enlarged Solid does not update itself until the action has stopped, when the mouse-button is released—i.e., discrete reaction. That is, although the Selected Solid can be moved around the map continuously, only after this action is no longer performed does the Selected Solid instantly redisplay itself to match the Selected Solid—i.e., discrete action. The C-D form of interaction flow attempts to separate cause and effect. This particular application of C-D in the tool, by beholding and delaying the provision of reactive feedback, is intended to promote visualizing the resulting solids in users’ minds without the constant need for visual feedback. The aim is to facilitate greater reflection and thinking and the development of retentive, selfmonitoring, and self-correcting processes (Corbett & Anderson, 2001). In the same way, when interacting with the Enlarged Solid, only the reaction aspect differs from the C-C interface. In the C-D interface, while acting continuously upon the solid, only the Platonic wire frame is continuously being updated, leaving the internal solid unchanged (see Figure 10). The continuous update of the wire frame is intended to provide some limited operational feedback so that users are cognizant that an action is being performed. The internal solid updates itself only when the mouse action has stopped, after which the solid is instantly changed to match the orientation of the wire frame. This delay is intended to encourage users to perform more premeditated planning of and thinking about the final orientation of the solid before actually releasing the mouse- button.
Figure 10. Snapshots of interacting with the Enlarged Solid based on the C-D form 3.1.5. Discrete-Continuous (D-C) interface In the D-C interface, actions are to be performed in a discrete manner, while the reactions are presented in a continuous fashion. This interface restricts actions to be performed only through mouse-clicks. To perform an action, users can click anywhere on the active map. After each mouse-click, a smooth animation shows the Selected Solid moving towards the final destination—i.e., the location where the mouse-click has taken place. Similarly, while the Selected Solid is moving, the Enlarged Solid updates itself continuously to match the morphing Selected Solid. Figure 11 shows a sequence of
This is a pre-print version of the paper appearing in Jl. of Interactive Learning Research (2010) 21 (1), 5-45. ©AACE. Printed with permission (http://www.aace.org).
snapshots displaying the animated movement of the Selected Solid after an action has been issued, where the final destination of the animation is indicated by the hand-cursor. Discrete actions happen one at a time. Upon committing to an action, users lose control of communication until the animation ends, only then can they commit to the next action. As there is time cost associated with each action and reversal of action is not easy, users might need to resort in more premeditated actions.
Figure 11. Snapshots of the animated movement of the Selected Solid In the D-C interface, to allow discrete action with the Enlarged Solid, a set of interactive directional arrows have been added to the solid representation (see Figure 12). To act upon the Enlarged Solid, users first need to choose a direction towards which they want to rotate the solid. Then, to actually rotate the solid, users can click on the arrow matching the chosen direction. After the action is issued, a smooth animation is run showing the continuous rotation of the solid by a predefined amount.
Figure 12. Interacting with the Enlarged Solid through the directional arrows 3.1.6. Discrete-Discrete (D-D) interface The D-D interface is exactly the same as the D-C interface. Also, the way by which actions are performed are the same for both interfaces. The difference between them lies in the manner in which reactions are presented. While in the D-C interface reactions are continuously provided in the form of animations, in the D-D interface, reactions are discrete, occurring instantly after a mouse-click action. So, unlike the other interfaces, the
This is a pre-print version of the paper appearing in Jl. of Interactive Learning Research (2010) 21 (1), 5-45. ©AACE. Printed with permission (http://www.aace.org).
D-D interface allows ‘jumping’ from one location to another within the active map. This is the case since the Selected Solid can move from its current location to any location using mouse-clicks, without the need to observe the intermediate solids. To an extent, this is the fastest way for users to navigate from one location to another. Similar to the D-C interface, interaction with the Enlarged Solid is through the directional arrows. The difference, however, is that instead of providing continuous reaction in the form of animation, in the D-D interface, the response is given as an immediate rotation of the solid in a chosen direction. 3.2. Usability evaluation This section describes the empirical usability study that was conducted to evaluate the four interface versions of the visualization tool. The study was intended to investigate whether and how each operationalization of the four of forms interaction flow affects visual thinking, reasoning, and exploration. 3.2.1. Design A multi-method (both quantitative and qualitative) research design was used, incorporating a number of types of data-gathering instruments (achievement results, video transcripts, video screen captures, interviews, and direct observations). The multimethod design was used to help triangulate and cross-validate the different types of findings and results. This study compared four groups, each group interacting with one of the four interfaces. As such, this study did not have a control group in the traditional sense. Rather, it was intended to offer a comparative evaluation of the four interfaces. This method of comparing different approaches without having a control group is common in educational settings (Ary et al., 2003). 3.2.2. Participants Forty grade 11-12 high-school students, ages ranging from 16 to 19, participated in this study3. Teachers from a local school were initially approached to see whether they would like their students to participate in the study. After the teachers invited their students to participate, the first forty who responded were selected. None of the participants had used the visualization tool before and all students were computer-literate. Also, none of the participants had been taught the mathematical concepts embedded in the tool in formal educational settings. 3.2.3. Sources of data Five sources of data were used to do the analysis and evaluation of the visualization tool: 1) achievement results, obtained from the pre- and post-test scores; 2) video and screen capture transcripts, obtained from video tapes and screen captures of the participants’ interactions with the tool; 3) questionnaire answers, obtained from the survey conducted at the end of the study; 4) interview transcripts, obtained from video tapes of the post-hoc interviews with some participants; and 5) direct observations, obtained from the 3
One participant could not complete the study; so, the sample size was reduced to thirty-nine.
This is a pre-print version of the paper appearing in Jl. of Interactive Learning Research (2010) 21 (1), 5-45. ©AACE. Printed with permission (http://www.aace.org).
recordings made of participants’ overall patterns of usage and body language not easily captured through video recordings. 3.2.4. Procedure All participants were asked to complete a multiple-choice geometry test before and after interacting with the tool. The pre- and post-test contained the same questions. After the pre-test, participants were randomly distributed into four groups (one group for each interface: C-C, C-D, D-C, and D-D), with each participant assigned to work with one other participant on a set of question-based tasks. Pairing of participants (with 5 pairs for each group) is based on the co-discovery usability testing method (Kennedy, 1989). In this method, two participants learn how to use and work with a program while conversing with each other. This conversation helps evaluators gain a better understanding of the usability of the program. In the study, each pair interacted with the program for about two and a half hours: three sessions of about 45 minutes on three consecutive days were held during normal school hours. As participants interacted with the visualization tool, they were videotaped and written notes were made of their overall pattern of use and their verbal comments. Also, a computer screen-capturing program recorded participants’ interaction with the tool along with their verbal comments. Finally, after the last session with the tool, all participants wrote a post-test, which was identical with the pre-test. After the post-test, participants completed a questionnaire which collected feedback about their impressions of the tool. Some participants were also briefly interviewed to help clarify some of the comments they made during their interaction with the tool and the answers they gave on the tests and questionnaire. 3.2.5. Tasks Participants were requested to complete sixteen question-based tasks using the visualization tool. These tasks were intended to provide participants with predefined goals to make collection of data efficient and effective within the limited duration of the study. The tasks were designed based on the types of potential actions users might perform to make sense of representations as discussed by different researchers (e.g., Keller & Keller, 1993; Zhou & Feiner, 1998). Some of these actions include: identify, locate, distinguish, categorize, compare, associate, correlate, and rank. Each task was composed of several questions. These questions have different levels of difficulty. Some questions required only one type of action; whereas others are more involved and required a combination of several actions. Examples of questions which required only one type of actions included: ‘How many faces, corners, and edges does the above shape have?’ requiring a ‘identify’ type of action; ‘Can you get [picture of an Archimedean solid] by cutting off the corners of [picture of a Platonic solid]?’ requiring a ‘associate’ type of action; or ‘From which of the following three shapes [figures of the 3 Platonic solids] can you get this shape [figure of an Archimedean solid]?’ requiring a ‘correlate’ type of action. Instances of more involved questions included: ‘What type of faces do you get when you cut off the edges of any shape?’ requiring both ‘compare,’ ‘distinguish,’ and ‘categorize’ types of actions; and ‘What is the relationship between the shapes you get from the cube and the shapes you get from the octahedron?’ also requiring ‘compare,’ ‘distinguish,’ and ‘categorize’ types of actions.
This is a pre-print version of the paper appearing in Jl. of Interactive Learning Research (2010) 21 (1), 5-45. ©AACE. Printed with permission (http://www.aace.org).
4. Results This section reports the results of the study in two subsections: 1) analysis of the quantitative results, which include test achievement results, task-performance related data, and questionnaire answers; and 2) analysis of the qualitative results, which include comments made by participants about each version of the tool during their interaction with it and during interviews as well as notes taken by researchers. 4.1. Analysis of the quantitative results This subsection is intended to assess whether interacting with the tool had any effect on the learning (based on the test results) and exploration of the 3D solids (based on the questionnaire answers and task-performance data). 4.1.1 Geometry Test achievement results Generally, participants achieved a higher score in the post-test than on the pre-test. As Figure 13 shows, the media of the post-test is much higher than the media of the pre-test.
Figure 13. Boxplot of pre- and post-test results in % for all participants Table 2 presents the descriptive statistical data for all participants. As expected, the mean for the post-test is higher than the pre-test. Table 3 shows the results of the overall statistical analysis. Regardless of the interface they used, the mean increase for all participants was 22.8% with a standard deviation of 12.9%. At an inference level, a onesided paired-sample t-test was conducted. The hypothesis tested was that participants would perform better on the post-test. The results indicate a significant improvement in test scores (tdiff(38)=10.97; P