and (6) show the encoding of the standard deviation and the degree of some .... The exploratory analysis is reported as Lucy, a physiologist, conducts various ...
Eurographics Conference on Visualization (EuroVis) (2013) M. Hlawitschka and T. Weinkauf (Editors)
Short Papers
HumMod Browser: An Exploratory Visualization Tool for Model Validation of Whole-Body Physiology Simulation Jian Chen1 , Keqin Wu1 , William A. Pruett2 , and Robert L. Hester2 1 The 2 Department
DaVinCI Lab, CSEE, University of Maryland, Baltimore County, USA, email: {jichen, keqin}@umbc.edu of Physiology and Biophysics, University of Mississippi Medical Center, USA, email: {wpruett, rhester}@umc.edu
Abstract We present HumMod Browser, a multi-scale exploratory visualization tool that lets physiologists validate human physiology simulation results. Showing correlations, exploring causality relationships, analyzing important attributes, and comparing numerous set of ensemble runs are common tasks in model validation. The lack of interactive exploration often hinders efforts to employ classical graph-visualization approaches in these tasks. Our HumMod Browser contributes to the interaction design and provides powerful multi-scale coordinated uncluttered interactive exploration based on tag-cloud visualization and a metaphorical interface. Two case studies containing more than 6000 physiology attributes suggest the usefulness of HumMod Browser in physiological simulation validation tasks. Categories and Subject Descriptors (according to ACM CCS): I.3.8 [Computer Graphics]: Application—; J.3 [Computer Applications]: Life and Medical Sciences—Medical Information Systems
1. Introduction The mathematical modeling in human physiology has developed tremendously and more than 6000 attributes have been integrated to simulate organism functions using physical and chemical laws [HBH∗ 11]. Validating such mathematical models becomes increasingly challenging because of the complexity of these simulated attributes: the uncertainty of these time-dependent attributes must be studied together in the entire human body system. Visual analytics is considered to be an important approach to model validation, because it allows human beings to combine their domain knowledge and perceptual abilities with computational power in the reasoning process. However, analytical tools do not exist for tasks in the physiology domain and the exploratory process is still in dire need of effective visual analytics tools to help understand the mathematical models. In particular, tools for model validation are lacking. Support from existing visualization approaches for validation tasks is fairly limited. Validation tasks include but are not limited to the following: Showing correlations: Correlations between model variable, especially between baseline values from in-vivo experc The Eurographics Association 2013.
iments and eventual values must be incorporated. In particular, with some pathological conditions, careful experiments must be done to determine factors that perform badly following protocols. Relationship exploration: It is important to examine the relationship among attributes to learn how they interact with one another. For example, different age- and sex-matched individuals can have different bifurcating responses to 750 ml hemorrhage: some have circulatory collapse while others exhibit no physiological symptoms of the blood loss. Careful examination of why these differences occur is studied in ensemble simulations. Few existing exploratory tools allow users to explore large attribute relationships with functions make possible a realistic knowledge discovery process. Importance analysis: Attribute importance involves measurement metrics, such as statistical significance. Related to the relationship exploration above, physiologists need to carry out analyses of multidimensional attributes or additional complex information. This is a critical yet difficult task. For example, parameter sets can yield stable models but unstable responses to perturbation, as in the hemorrhage example above. Finding the significant changes in such a large
Chen, Wu, Pruett and Hester / HumMod Browser: An Exploratory Visualization Tool for Model Validation of Whole-Body Physiology Simulation
space may make it difficult for the physiologists to explore such information in enough detail.
3. HumMod Browser 3.1. Causality Map and Importance Measure
Scalable interaction: physiologists often need to identify and compare various ensemble runs containing timedependent attributes. We define grouping manipulations that allow physiologists quickly to generate new runs according to given clinical protocols for given attributes. Such interaction techniques are sorely needed yet less studied in ensemble simulations. This paper presents HumMod Browser, a novel work-inprogress visual analytics tool (Figure 1). It enables physiologists to perform scalable interaction and attributes analysis in a physiology model of HumMod that contains more than 6000 attributes. It makes a significant extension to the meaningful metaphor of bubbles [BRZ∗ 10] to design new interactions supporting effective and efficient visual exploration of numerous attributes. It allows causality exploration, copyand-paste routines for scalable multiple ensemble comparisons, visualization of attribute changes, and contextualizing the analytical process. HumMod Browser is the first visualization tool to address unique validation issues in physiology related to variable changes and causality relationships.
2. Related Work Causality Visualization. Causal relationship visualization is a relatively new area, and most causality visualizations use some form of graph layout [ET03], but scaling the graph display to a large network remains problematic. Some techniques demand a large display space, such as treerings [Hol06,XLW∗ 11]; others avoid this by removing edges (e.g., adjacency matrix [Ber67] and its extensions of Matrix Zoom [AvH04] and MatrixExplorer [HF06]) or by dynamic data exploration [SCGM00]. Empirical studies suggest that an animated graph is better than static graphs in enhancing users’ speed and accuracy in recalling causal relationships [KIL07]. Our HumMod design follows the design implications of these studies to focus on interactive data exploration. Ensemble Exploration of Large Simulation Data. The power of ensemble exploration to support knowledge discovery has been realized in numerous techniques, e.g., optimizing visual encoding [SZD∗ 10], providing informative guidelines [FKLT10], interactive sensemaking [MHS07] and storytelling tools [MLF∗ 12], geoscience data visualizations [EKHW08], volumetric medical visualization [WH07], and novel metaphorical interface designs [LBP∗ 11]. But none of these tools address validation tasks in large timedependent attributes space, where many ensemble simulation runs of the same attributes can be compared many times. Most existing storytelling tools integrate and combine views to provide contextual information that supports linear storytelling of a sequence of queries and ignore the non-linearity in the knowledge discovery process.
The attribute relationships form a static causality map that is calculated from the mathematical equations in the simulation models. The attributes on the right side of the equation cause the attributes on the left to change, so that there is an edge between each of this relationship. Because there is a baseline measurement for each attribute in clinical settings, the fluctuation of an attribute on the left side of the equation caused by attribute changes on the right (or an edge between two nodes) is not always significant. In this study, the significance of each attribute in the simulation is measured by the deviation of the resulting attribute’s value from its mean. If that value is beyond two standard deviations of its mean, the attribute causing this change is considered significant. Such dynamics can change with every simulation and every individual patient. Besides this statistical significance measure, we also use the degree of connectivity; the in-degree measures the number of attributes that can cause an attribute to change and out-degree measures how many attributes this variable can change. These two degrees can be calculated in the causality map to measure their importance: the greater the degree (indegree or out-degree) of an attribute in the graph, the greater its influence on other attributes.
3.2. Showing Changes: Importance-Driven Tag Clouds A tag cloud is a list of tags in which the tag sizes reflect their popularity [LZT09]. Tags can be displayed in various ways, e.g., sorted alphabetically [FLF∗ 11] or by size. HumMod Browser uses tag clouds to display the attributes’ variances, significances, and degrees; the tags in the central position of the highest varying attributes are emphasized. In particular, tag sizes are decided by a user-selected measurement metrics for a pie menu, either by the standard deviation or the degree in the causality graph representation. Using tag sizes is better than using length and volume because size, as a visual property, is best suited for quantitative purposes [Mac86]. HumMod Browser uses a random space-filling method [CVW09] and a Poisson random-number generator to place tags in an order such that larger tags have a greater chance of being placed near the center of the tag cloud: smaller tags are thus more likely to be placed near the boundary of the tag cloud, since the inner area may already be occupied by the larger ones placed earlier. Figure 1, (5) and (6) show the encoding of the standard deviation and the degree of some attributes. HumMod Browser also displays detailed time-varying attributes with described features as the line plot or a quantile representation showing the changes in the attributes over time. c The Eurographics Association 2013.
Chen, Wu, Pruett and Hester / HumMod Browser: An Exploratory Visualization Tool for Model Validation of Whole-Body Physiology Simulation Data Manager
Project view
Tag cloud by standard deviation
Tag cloud by degree of connectivity
1 2 5
Tag Cloud 3
8 6
Grouped bubbles for comparison 4
7
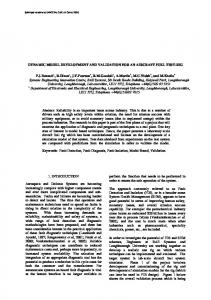
Figure 1: HumMod Browser Interface: an example query of some physiological attributes (yellow tags are not part of the visual interface.)
3.3. Interactive Relationship Query Interactions play an essential role in HumMod Browser. The user can effectively select a node (an attribute) with desirable features (significance and degree of connectivity) from a pie menu for complex relationship analysis tasks in validating their mathematical model. Fluid query workflow. HumMod Browser maintains a query flow. Every tag in the tag clouds can be selected by mouse click to activate another tag cloud or other information of interest. The tag clouds and new information are displayed in a bubble metaphorical interface [BRZ∗ 10]. We have made significant extensions to the bubble metaphor to define bubbles’ interaction behaviors that are suitable to verification tasks physiologists want to perform. We consider each bubble a segment of physiologists’ thinking points: the linkages between bubbles show the query process. Along a bubble chain, the color and direction of the edge connecting two bubbles indicate the different relationships between the selected tag in the parent bubble and the context of the child bubbles. The current design enables the query of parent-children hierarchy, caused-by, cause, and time-plot (Figure 2). Users can select from these choices to bring up a new bubble by clicking on the tag and then making the corresponding choice on a pie menu. Arrows in different directions are used to indicate two-way causal relationships. For example, physiologists interested in seeing all the attributes’ dependencies on a level-n name inside a bubble can choose to show it in a new bubble. In the same way, a bubble containing all attributes dependent on a selected name inside an existing bubble can be shown. Those names in the new bubble are also in the same level n and are shown through tag clouds. c The Eurographics Association 2013.
Figure 2: Directional edges are colored to encode the relationships between a pair of connected tag cloud bubbles. The green color indicates hierarchical parent-children relationships in data; the purple and orange colors show the bi-directional causal relationships; and the pink color shows the detailed time-series plot.
The color scheme is chosen among the qualitative color sequences provided by ColorBrewer [HB03]. Figure 1 (7) illustrates our four-color definition in the color scheme and Figure 2 shows the corresponding directional edge encoding of the causal relationships. Multi-attribute copy and paste for comparative data analysis. To support comparative data analysis, we let physiologists build an alternate analysis on top of existing ones. Dragging one bubble into another bubble groups the two bubbles and show the same query process. The query process, recorded through the bubble chain connected with it, can be applied to another attribute by a copy-and-paste operation. The user can also replicate a bubble or a group of them and redefine the input data; all subsequent variable interactions are automatically propagated to all linked bubbles. These replicating, editing, and grouping facilitate new and
Chen, Wu, Pruett and Hester / HumMod Browser: An Exploratory Visualization Tool for Model Validation of Whole-Body Physiology Simulation
comparative data analysis to support efficient information access. Scalable interface to access contextual analysis. Our interface supports visual display of theoretically unlimited size (Figure 1 (1)) in which physiologists need not delete a data analysis. They can set the current view and save views in XML format. Loading the XML file shows the past queries, thus supporting asynchronous collaboration among physiologists to see one another’s data explorations. The current focus is displayed and physiologists can move to any project space to start a new analysis. Moreover, HumMod Browser lets users apply a query instance to different variable or datasets, query the visualization history, and visually compare different results. 4. Case Studies We present two case studies to illustrate the usefulness of HumMod Browser for physiologists to explore both hierarchical and causal relationships within physiological systems. 4.1. Understanding Variable Interactions Within the Lungs The exploratory analysis is reported as Lucy, a physiologist, conducts various queries to produce the display. The numbers in Figure 3 index the order of the bubbles created in the process. This case study uses the lungs, the most important physiological organ, to demonstrate the interactive study of relationship exploration among attributes. Lucy first selects a dataset by dragging from the control panel a bubble showing level-0 attribute names (Figure 3, Step 1). Lucy notices that the Lungs variable shows the second-highest average standard deviations. She is curious and decides to find out what variables are related to Lungs. She opens its level-1 attributes, revealing that the attribute Breathing contributes the most to Lungs’s large standard deviation. By examining the edges connecting the bubbles (Step 3), she finds that the attribute TotalVentilation also causes the Lungs to change. Lucy further queries all variable names depending on Lungs by clicking the in-degree from the pie menu. A new bubble with an orange boundary pops up (Step 4). Side-by-side comparison of these two bubbles reveals that the level-0 attribute CO2 appears in both bubbles. This means that CO2 has a cyclic effect on Lungs in that CO2 and Lungs have mutual effects on each other. Lucy finally looks at the time plots of two attributes of Outflow and Pressure, in order to understand how these time-varying variables update themselves in the simulation (5, 6). 4.2. Comparison of Normal and Pathological Conditions Comparison of abnormal outputs with the normal one could provide certain insights into possible attributes that relate
Figure 3: Lucy queries the selected “Lungs” attribute.
to pathological conditions. To compare different ensemble runs, Lucy performs a simultaneous query on them. An example is shown in Figure 1 right. Bubbles 5 and 6 contain level-0 variables of two different ensemble runs. The normal case is shown at the bottom and the abnormal case at the top. Lucy groups the two bubbles, because she wants to query them simultaneously. The sizes of the tags reveal the differences between the two cases. Time-series plots are shown to reveal subtle differences between the same variables from different simulation runs. Lucy also places the time-series bubbles of the same attributes closer together to compare them. This case study shows that the differences between the normal and pathological conditions may not be easily seen and can require case-by-case analysis.
5. Conclusions We have presented HumMod Browser, a new exploratory visual interface to assist physiologists in learning causality relationships in validating mathematical modeling data. Our preliminary design demonstrated its uses in several new methods: (1) expansion the metaphorical interface to facilitate interactive data exploration for validation tasks; (2) support of numerous selection and copy-and-paste operations in which attributes are copied simultaneously; and (3) support of non-linear data exploration where users’ input and output in numerous exploration steps are analyzed to support further exploration. Though not validated, this design might be able to facilitate large ensemble run comparisons. This paper also represents a new domain of uses visualizing physiological datasets, that has to our knowledge been addressed only rarely. Accompanying videos are online at http://www.csee.umbc.edu/~jichen/Videos.
Acknowledgement This work is partially supported by the National Science Foundation under grant numbers DBI-1260795, IIS1341254, and EPS-0903234. The authors would like to thank Katrina Avery for her editorial support and the anonymous reviewers for their insightful comments. c The Eurographics Association 2013.
Chen, Wu, Pruett and Hester / HumMod Browser: An Exploratory Visualization Tool for Model Validation of Whole-Body Physiology Simulation
References [AvH04] A BELLO J., VAN H AM F.: Matrix zoom: A visual interface to semi-external graphs. In IEEE Symposium on Information Visualization (2004), pp. 183–190. doi:10.1109/INFOVIS.2004.46. 2 [Ber67] B ERTIN J.: Semiology of graphics: diagrams, networks, maps. University of Wisconsin Press, 1967. 2 [BRZ∗ 10] B RAGDON A., R EISS S. P., Z ELEZNIK R., K ARU MURI S., C HEUNG W., K APLAN J., C OLEMAN C., A DEPU TRA F., L AV IOLA J R J. J.: Code bubbles: rethinking the user interface paradigm of integrated development environments. In Proceedings of the 32nd ACM/IEEE International Conference on Software Engineering-Volume 1 (2010), pp. 455–464. doi:10.1145/1806799.1806866. 2, 3 [CVW09] C OLLINS C., V IEGAS F. B., WATTENBERG M.: Parallel tag clouds to explore and analyze faceted text corpora. In IEEE Symposium on Visual Analytics Science and Technology (VAST) (2009), pp. 91–98. doi:10.1109/VAST.2009.5333443. 2 [EKHW08] E CCLES R., K APLER T., H ARPER R., W RIGHT W.: Stories in geotime. Information Visualization 7, 1 (2008), 3–17. doi:10.1057/palgrave.ivs.9500173. 2 [ET03] E LMQVIST N., T SIGAS P.: Causality visualization using animated growing polygons. In IEEE Symposium on Information Visualization (INFOVIS) (2003), pp. 189–196. doi:10.1109/INFVIS.2003.1249025. 2 [FKLT10] F ENG D., K WOCK L., L EE Y., TAYLOR R. M.: Matching visual saliency to confidence in plots of uncertain data. IEEE Transactions on Visualization and Computer Graphics 16, 6 (2010), 980–989. doi:10.1109/TVCG.2010.176. 2 [FLF∗ 11] F ERREIRA N., L INS L., F INK D., K ELLING S., W OOD C., F REIRE J., S ILVA C.: Birdvis: Visualizing and understanding bird populations. IEEE Transactions on Visualization and Computer Graphics 17, 12 (2011), 2374–2383. doi:10.1109/TVCG.2011.176. 2 [HB03] H ARROWER M., B REWER C.: Colorbrewer.org: an online tool for selecting colour schemes for maps. The Cartographic Journal 40, 1 (2003), 27–37. doi:10.1179/000870403235002042. 3 [HBH∗ 11] H ESTER R. L., B ROWN A. J., H USBAND L., I LI ESCU R., P RUETT D., S UMMERS R., C OLEMAN T. G.: HumMod: A modeling environment for the simulation of integrative human physiology. Frontiers in Physiology 2 (2011). doi:10.3389/fphys.2011.00012. 1 [HF06] H ENRY N., F EKETE J.-D.: MatrixExplorer: a dualrepresentation system to explore social networks. IEEE Transactions on Visualization and Computer Graphics 12, 5 (2006), 677–684. doi:10.1109/TVCG.2006.160. 2 [Hol06] H OLTEN D.: Hierarchical edge bundles: Visualization of adjacency relations in hierarchical data. IEEE Transactions on Visualization and Computer Graphics 12, 5 (2006), 741–748. doi:10.1109/TVCG.2006.147. 2 [KIL07] K ADABA N. R., I RANI P. P., L EBOE J.: Visualizing causal semantics using animations. IEEE Transactions on Visualization and Computer Graphics 13, 6 (2007), 1254–1261. doi:10.1109/TVCG.2007.70528. 2 [LBP∗ 11] L I G., B RAGDON A. C., PAN Z., Z HANG M., S WARTZ S. M., L AIDLAW D. H., Z HANG C., L IU H., C HEN J.: VisBubbles: A workflow-driven framework for scientific data analysis of time-varying biological datasets. ACM SIGGRAPH Asia (poster) (2011). doi:10.1145/2073304.2073333. 2 c The Eurographics Association 2013.
[LZT09] L OHMANN S., Z IEGLER J., T ETZLAFF L.: Comparison of tag cloud layouts: Task-related performance and visual exploration. Human-Computer Interaction (INTERACT) (2009), 392–404. doi:10.1007/978-3-642-03655-2_43. 2 [Mac86] M ACKINLAY J.: Automating the design of graphical presentations of relational information. ACM Transactions on Graphics (TOG) 5, 2 (1986), 110–141. doi:10.1145/22949.22950. 2 [MHS07] M ACKINLAY J. D., H ANRAHAN P., S TOLTE C.: Show me: Automatic presentation for visual analysis. IEEE Transactions on Visualization and Computer Graphics 13, 6 (2007), 1137–1144. doi:10.1109/TVCG.2007.70594. 2 [MLF∗ 12] M A K.-L., L IAO I., F RAZIER J., H AUSER H., KOSTIS H.-N.: Scientific storytelling using visualization. IEEE Computer Graphics and Applications 32, 1 (2012), 12–19. doi:10.1109/MCG.2012.24. 2 [SCGM00] S TASKO J., C ATRAMBONE R., G UZDIAL M., M C D ONALD K.: An evaluation of space-filling information visualizations for depicting hierarchical structures. International Journal of Human-Computer Studies 53, 5 (2000), 663–694. doi:10.1006/ijhc.2000.0420. 2 [SZD∗ 10] S ANYAL J., Z HANG S., DYER J., M ERCER A., A M BURN P., M OORHEAD R. J.: Noodles: A tool for visualization of numerical weather model ensemble uncertainty. IEEE Transactions on Visualization and Computer Graphics 16, 6 (2010), 1421–1430. doi:10.1109/TVCG.2010.181. 2 [WH07] W OHLFART M., H AUSER H.: Story telling for presentation in volume visualization. In Eurographics/IEEEVGTC Symposium on Visualization (2007), pp. 91–98. doi:10.2312/VisSym/EuroVis07/091-098. 2 [XLW∗ 11] X U L., LYLE J., W U Y., PAN Z., Z HANG M., L AIDLAW D. H., H ESTER R. L., C HEN J.: HumMod explorer: a multi-scale time-varying human modeling navigator. In ACM SIGGRAPH Asia (Posters) (2011). doi:10.1145/2073304.2073334. 2