Proceedings of the International MultiConference of Engineers and Computer Scientists 2015 Vol II, IMECS 2015, March 18 - 20, 2015, Hong Kong
An Extended HDL SoC TAB-model for Diagnosability and Repair Vladimir Hahanov, Ka Lok Man, Baghdadi Ammar Awni Abbas, Eugenia Litvinova, Svetlana Chumachenko, Eng Gee Lim, Mark Leach
Abstract— This article describes technology for diagnosis SoC HDL-models, based on transaction graph. Methods for diagnosis is focused on decreasing the time of fault detection and memory for storage of diagnosis matrix by means of forming ternary relations between test, monitor, and functional component. The following problems are solved: creation of digital system model in the form of transaction graph and multi-tree of fault detection tables, as well as ternary matrices for activating functional components of the selected set of monitors by using test patterns; development of a method for analyzing the activation matrix to detect the faulty blocks with given depth and synthesis logic functions for subsequent embedded hardware fault diagnosis.
Index Terms— HDL SoC model; diagnosis; faulty blocks detection; transaction graph
I. TAB-MODEL FOR DIAGNOSIS FAULTY SOC COMPONENTS
T
he main objective is the realization of TAB-matrix model (Tests – Assertions – Blocks functional model) and diagnosis methods to reduce the time of testing and memory for storage by means of forming ternary relations (test – monitor – functional component) within one table. The challenges involve: 1) Development of digital system HDL-model in the form of a transaction graph for diagnosing functional blocks by using assertion set [1-6,15]; 2) Development method for analyzing TAB-matrix to detect minimal set of fault blocks [4-7,13]; 3) Synthesis of logic functions for embedded fault diagnosis procedure [8-11,14]. The xor-relation between the parameters is a model for testing digital system HDL-code represented as follows:
T Å B Å B* = 0; B* = T Å B = {T A} Å B, (1) which transforms the relationship of the components in the TAB-matrix:
Manuscript received January 08, 2015; revised February 10, 2015. V. Hahanov, E. Litvinova, S. Chumachenko are with the National University of Radioelectronics, Kharkov, Ukraine (e-mail:
[email protected]) K. L. Man, E. G. Lim and M. Leach are with Xi’an Jiaotong-Liverpool University, Suzhou, China (e-mail: {ka.man, enggee.lim , mark.leach}@xjtlu.edu.cn) B. A. Awni Abbas is with Baghdad University, Iran
ISBN: 978-988-19253-9-8 ISSN: 2078-0958 (Print); ISSN: 2078-0966 (Online)
M = {{T A} {B}}, Mij = (T A)i Å B j.
(2) The coordinate of the matrix will be 1, if the pair test– monitor (T A)i detects or activates some faults of the functional block B j B . Verification by the use of temporal assertion is focused on the specified diagnosis depth and presented as follows:
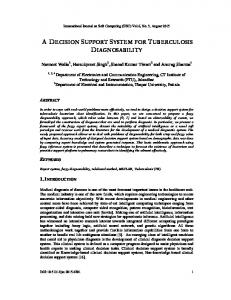
= f (G, A, B, S,T ), (3) G = (A*B) S;S = f (T, B); Here G = (A * B) S is functionality, represented by CodeFlow Transaction (CFT) Graph (Fig. 1); S = {S1 , S 2 ,..., Si ,..., S m } are software states or nodes when simulating test segments. Otherwise the graph can be considered as an ABC-graph – Assertion Based Coverage Graph. Each state Si = {Si1 , Si2 ,..., Sij ,..., Sip } is determined by the values of design essential variables (Boolean, register variables, memory). The oriented graph arcs are represented by a set of software blocks: n
B = {B1,B2 ,...,Bi ,...,Bn }; È Bi = B; Bi Ç B j = Æ. i=1
i j
(4) The assertion A i A = {A 1 , A 2 ,..., A i ,..., A n } can be put in each block B i – a sequence of code statements which determines the state of the graph node S i = f (T, B i ) depending on the test pattern T = {T1,T2 ,...,Ti,...,Tk }. The assertion monitor, uniting the assertions of incoming arcs A(Si ) = A i1 Ú Ai2 Ú ... Ú Aij Ú ... Ú Aiq can be inserted on each node. The ABC-graph model of HDL-code describes both the software structure, and also test segments of the functional coverage, generated using software blocks, incoming to the given node. In the aggregate, all nodes have to be full state coverage space of software variables, which determines the test quality, equal to 100%:
.
Furthermore, the assertion set A, S that exists in the graph, allows monitoring arcs (code-coverage) B = (B1,B2 ,...,Bi ,...,Bn ) and nodes (functional coverage) S = {S1,S2 ,...,Si ,...,Sm }. The ABC-graph makes possible the following: 1) to minimize the costs for generating tests, diagnosing and correcting the functional failures by using assertions; 2) to estimate the software quality via diagnosability design; 3) to
IMECS 2015
Proceedings of the International MultiConference of Engineers and Computer Scientists 2015 Vol II, IMECS 2015, March 18 - 20, 2015, Hong Kong 1) M i = (Ti A j ); m
n
2) Ú M ij M j = 1; i =1
j=1
n
3) M ij Å M rj M ij ;
j=1 k
4) M ij Å M ir M ij ; i =1
5) log 2 n k log 2 B T
B = (B1B3B9 Ú (B2 B7 Ú B1B5 )B11 )B13 Ú Ú ((B1B 4 Ú B 2 B6 )B10 Ú B 2 B8 B12 )B14 = = B1B3B9 B13 Ú B 2 B7 B11B13 Ú B1B5B11B13 Ú Ú B1B4 B10 B14 Ú B 2 B6 B10 B14 Ú B 2 B8 B12 B14 . Fig. 1. Example of ABC-graph of HDL-code
optimize test synthesis via coverage all arcs and nodes by a minimum set of activated test paths. Generally, the testing model is represented by the Cartesian product M = T A B that accordingly has the dimension Q = k h n. To reduce the amount of diagnosis data, separate monitor or assertion point for visualization functional blocks activation is assigned to each test segment. It is possible to decrease the matrix dimension to Q = n k and retain all features of the triad relationship M = T A B . Pair «test – monitor» are represented by three possible forms:
Ti A j , {Ti, Tr } A j , {Ti } {A j, As } .
(5)
The method for diagnosis of functional block failure uses pre-built TAB-matrix (table) M = [M ij ] , where the row is the relation between the test segment and a subset of activated blocks observed by the monitor A j .
Ti A j (M i1, M i2 ,..., Mij ,..., M in ), Mij = {0,1}
(6)
Column of the table describes the relation between the functional blocks, detected on test segments, relatively monitors M j = B j (Tj, A j ) . Detecting faulty functional blocks is based on xor-operation between the real assertion response vector and TAB-matrix columns
A* Å [M1 (B1 )Ú M 2 (B2 )Ú... Ú M j (B j )Ú... Ú M n (Bn )] (7) The faulty block is defined by a vector B j , which gives result with minimal number of 1-unit coordinates: h
B = min [B j = (Bij Å A*i )]. j=1, n
i =1
(8)
As an addition to the diagnosis model, necessary to describe the following important features of the TAB-matrix:
ISBN: 978-988-19253-9-8 ISSN: 2078-0958 (Print); ISSN: 2078-0966 (Online)
6) B j = f(T, A) B Å T Å A = 0.
The features mean: 1) Every row of the matrix is a subset of the Cartesian product between test and monitor. 2) Disjunction of all matrix rows gives a vector equal to 1-unit over the all coordinates. 3) All matrix rows are unique, which eliminates the test redundancy. 4) All matrix columns are distinct, which excludes the existence of equivalent faulty blocks. 5) The number of matrix rows must be greater than the binary logarithm of the number of columns that determines the potential diagnosability of every block. 6) The diagnosis function of every block depends on the complete test and monitors, which must be minimized without diagnosability reduction. In accordance with 6 test segments activated, the following graph nodes paths relatively assertion point is S9: T = S0S1S3S7S9 Ú S0S1S4S8S9 Ú S0S1S5S7S9 Ú Ú S0S2S4S8S9 Ú S0S2S5S7S9 Ú S0S2S6S8S9 ,
(9)
It will be easy using graph structure to define all functional blocks (oriented arcs) activated by test: B = B1B3B9 B13 Ú B 2 B7 B11B13 Ú B1B5 B11B13 Ú Ú B1B 4 B10 B14 Ú B 2 B6 B10 B14 Ú B2 B8B12 B14 .
(10)
The next step allows creating 6 rows of TAB-matrix M ij (G1 ) in the form of relations between test segments and blocks activated respectively: TABLE I TAB-MATRIX
M ij (G1 ) T1 S9 T2 S9 T3 S9 T4 S9 T5 S9 T6 S9 T1 S3 T6 S6
B1 1 1 1 . . . 1 .
B2 . . . 1 1 1 . 1
B3 1 . . . . . 1 .
B4 . 1 . . . . . .
B5 . . 1 . . . . .
B6 . . . 1 . . . .
B7 . . . . 1 . . .
B8 . . . . . 1 . 1
B9 B10 B11 B12 1 . . . . 1 . . . . 1 . . 1 . . . . 1 . . . . 1 . . . . . . . .
B13 1 . 1 . 1 . . .
B14 . 1 . 1 . 1 . .
The TAB-matrix of paths activation shows the existence of equivalent failure blocks 3 and 9, 8 and 12, on 6 test segments with one assertion point in the graph node 9. The columns 3 and 9, 8 and 12 are equivalent. To resolve indistinguishability of two pairs faulty blocks it is necessary to create two additional monitors in the nodes S3 and S6 for test segments T1 and T6 respectively. As a result, three assertions in the nodes A = (S9 ,S3, S6 ) allow distinguishing all faulty blocks of software HDL-code. Thus, the graph
IMECS 2015
Proceedings of the International MultiConference of Engineers and Computer Scientists 2015 Vol II, IMECS 2015, March 18 - 20, 2015, Hong Kong enables not only to synthesize the optimal test, but also to determine the minimal number of assertion monitors in the nodes to detect faulty blocks with a given diagnosis depth. II. DESIGN FOR DIAGNOSABILITY Diagnosability is the relationship D = N d / N between the recognized faulty blocks amount N d , (when there are not equivalent components, or the diagnosis depth is equal to 1), and the total number N of HDL-blocks. For the expense E evaluation of the TAB-matrix model for detecting functional failures, it can use the pair testassertions efficiency for a given diagnosis depth. Criterion E functionally depends on the relation between the ideal ]log 2 N[ N and real T A N memory sizes or resources
always be increased close to the 1-value. For this purpose there are two alternative ways. The first one is increasing test segments by activating new paths for recognition equivalent faulty blocks without increasing assertions, if the software graph structure allows the potential links. The second way is adding assertion monitors on transit nodes of the graph. A third so called hybrid variant is possible, based on the joint application of two above-mentioned ways. III. MULTILEVEL DIAGNOSIS METHOD OF DIGITAL SYSTEM Multilevel model of the multi-tree B (Fig. 2.) is shown, where each node is represented by digital or computer system component, which has a three-dimensional activation TAB-matrix of functional unit subcomponents.
(where T – the test length, A – a number of assertions) for the corresponding TAB-matrices, which compose the relative expense reduced to 0-1 intervals: E=
]log 2 N[ N ]log 2 N[ = . T A N TA
(11)
The ABC-graph analysis of assertion monitor placement, makes it possible to obtain maximal diagnosis depth of fault blocks. Diagnosability of the ABC-graph is a function depending on the number N n of transit not ended nodes. Where exist only two adjacent arcs, one of which is incoming, other one is outgoing. N is the total number of arcs in the graph:
D=
]log 2 N[ N - N n TA N
B = [Bijrs ], cardB =
rs Bij , (14)
r =1 s =1 i =1 j=1
(13)
The last expression produces some practical rules for synthesis of diagnosable HDL-code: 1) Test must create a minimal number of single activation paths, and cover all the nodes and arcs in the ABC-graph. 2) Base number of monitors equals the end node number of the graph with no outgoing arcs. 3) Additional monitors can be placed on each non end node. 4) Parallel independent code blocks must have n monitors and a single concurrent test, or one integrated monitor and n serial tests. 5) Serially connected blocks have one activation test for serial path and n-1 monitor, or n tests and n monitors. 6) The graph nodes, which have more than 1 number of input and output arcs, create good conditions for the diagnosability of the current section by single path activation tests without installation additional monitors. 7) The test pattern or testbench has to be 100% functional coverage for the nodes of the ABCgraph. 8) Diagnosis quality criterion as a function depending on the graph structure, test and assertion monitors can
ISBN: 978-988-19253-9-8 ISSN: 2078-0958 (Print); ISSN: 2078-0966 (Online)
The outcoming from the node arcs are transitioning to a lower detailed level in diagnosing process, when replacing faulty block is too expensive: n m r p rs k rs
N-N n (12) N
The estimation N n is the number of unrecognizable or equivalent functional blocks. Potential installation of additional monitors for improving diagnosability of failure blocks is pure transit nodes composed N n . The diagnosis quality criterion of the ABC-graph takes the form:
Q = ED =
Fig. 2. Diagnosis multitree model
where n is a number of diagnosis multi-tree levels; m r is a number of functional units or components at the level r; k rs ( prs ) is a number of components (test length) in the table
B rs ; Bijrs = {0,1} is a component of an activation table, which is defined by 1-unit the detected faulty functionality relatively to the observed under the test segment T i-Ai monitor-assertion. Method for faulty blocks diagnosis Hardware-Software HSsystem, based on multi-tree model, allows creating the universal engine in form of algorithm (Fig. 3, block 6) for traversal of tree branches on the depth, specified a priory: 0 {B r 1, s , R}; j rs Å = B rs A j rs 1 {B j1, , T}. (15) rs rs Here A rs i = m i Å g i , i = 1, k rs . If all coordinates of vector
rs xor-sum Brs j Å A = 0 then one of the following action is performed: the transition to the activation matrix of the
lower level Brj 1,s or repair of the functional block
B = Brsj .
IMECS 2015
Proceedings of the International MultiConference of Engineers and Computer Scientists 2015 Vol II, IMECS 2015, March 18 - 20, 2015, Hong Kong Finally, a new diagnosis quality criterion as a function depending on the graph structure, test, and assertion monitors is proposed. It allows making good choices in diagnosability by increasing test segments set for recognition equivalent faulty blocks or adding assertion monitors on transit nodes of the activation HDL-code graph. REFERENCES [1] [2]
[3]
[4]
Fig. 3. Engine for traversal of diagnosis multitree
One of two analyses is executed, based on: 1) the time (t>m, block 10) – then repair of faulty block is performed; 2) the money (t