Session: Experience 1 – Social and Affective Multimedia
MM’17, October 23–27, 2017, Mountain View, CA, USA
An Image-based Deep Spectrum Feature Representation for the Recognition of Emotional Speech Nicholas Cummins
Chair of Complex & Intelligent Systems, University of Passau, Germany
[email protected]
Anton Batliner
Chair of Complex & Intelligent Systems, University of Passau, Germany
[email protected]
Shahin Amiriparian
Chair of Complex & Intelligent Systems, University of Passau Machine Intelligence & Signal Processing group, TUM, Germany
[email protected]
Stefan Steidl
Pattern Recognition Lab, FAU Erlangen-Nuremberg, Germany
[email protected]
ABSTRACT
Gerhard Hagerer
Chair of Complex & Intelligent Systems, University of Passau audEERING GmbH, Gilching, Germany
[email protected]
Bj¨orn W. Schuller
Chair of Complex & Intelligent Systems, University of Passau Group on Language, Audio & Music, Imperial College London, UK
[email protected]
ACM Reference format: Nicholas Cummins, Shahin Amiriparian, Gerhard Hagerer, Anton Batliner, Stefan Steidl, and Bj¨orn W. Schuller. 2017. An Image-based Deep Spectrum Feature Representation for the Recognition of Emotional Speech. In Proceedings of MM’17, October 23–27, 2017, Mountain View, CA, USA., , 7 pages. DOI: https://doi.org/10.1145/3123266.3123371
The outputs of the higher layers of deep pre-trained convolutional neural networks (CNNs) have consistently been shown to provide a rich representation of an image for use in recognition tasks. This study explores the suitability of such an approach for speech-based emotion recognition tasks. First, we detail a new acoustic feature representation, denoted as deep spectrum features, derived from feeding spectrograms through a very deep image classification CNN and forming a feature vector from the activations of the last fully connected layer. We then compare the performance of our novel features with standardised brute-force and bag-of-audio-words (BoAW) acoustic feature representations for 2- and 5-class speech-based emotion recognition in clean, noisy and denoised conditions. The presented results show that image-based approaches are a promising avenue of research for speech-based recognition tasks. Key results indicate that deep-spectrum features are comparable in performance with the other tested acoustic feature representations in matched for noise type train-test conditions; however, the BoAW paradigm is better suited to cross-noise-type train-test conditions.
1
INTRODUCTION
Convolutional neural networks (CNNs) have become increasingly popular in machine learning research. Due to their high accuracy, they are arguably the most dominant approach for large scale image recognition tasks [17]. There currently exists a plethora of pre-trained and open-source deep CNN architectures, such as AlexNet [16] and VGG19 [30] which have been trained on over a million images, for image classification. AlexNet, in particular, has been revolutionary within computer vision. Consisting of 60 million parameters, 500, 000 neurons and 5 conventional layers, it achieved a never seen before level of performance in the 2012 ImageNet competition [16, 17]. Most major technology companies now use CNNs for image understanding and search tasks [14, 17]. These pre-trained CNNs are also gaining considerable research interest as a feature extractor for a task of interest, e. g. object or scene recognition [6, 29]. It is argued that CNNs, through their layered combination of convolutional and pooling layers, capture a robust mid-level representation of a given image, as opposed to lowlevel features such as edges and corners [6, 17]. It has been shown that deep representation features extracted from the activations of top layers of AlexNet have sufficient representational power and generalisability for image recognition tasks [6]. Indeed, state-ofthe-art results for a range of vision-based classification have been achieved with such deep representation features [5, 29]. The success of CNNs has not been limited to the image domain. In the audio domain, feeding spectrogram representations through CNNs has been shown to produce suitable salient features for acoustic event detection [3], music onset detection [23], automatic speech recognition [1, 22], and speech-based emotion recognition [12, 18].
CCS CONCEPTS •Computing methodologies ! Neural networks; Instance-based learning; •Applied computing ! Psychology;
KEYWORDS convolutional neural networks, image recognition, spectral features, computational paralinguistics, emotions, realism
Permission to make digital or hard copies of all or part of this work for personal or classroom use is granted without fee provided that copies are not made or distributed for profit or commercial advantage and that copies bear this notice and the full citation on the first page. Copyrights for components of this work owned by others than ACM must be honored. Abstracting with credit is permitted. To copy otherwise, or republish, to post on servers or to redistribute to lists, requires prior specific permission and/or a fee. Request permissions from
[email protected]. MM’17, October 23–27, 2017, Mountain View, CA, USA. © 2017 ACM. ISBN 978-1-4503-4906-2/17/10. . . $15.00 DOI: https://doi.org/10.1145/3123266.3123371
478
Session: Experience 1 – Social and Affective Multimedia
MM’17, October 23–27, 2017, Mountain View, CA, USA
2
Spectrogram Speech Signal
These papers however, trained their own CNN architectures, requiring a substantial amounts of data, time and computational power. As a result, research efforts have begun into leveraging pre-trained image CNNs to learn suitable speech representations [2, 4, 9, 10]. In this regard, this paper explores the suitability of deep spectrum features for speech-based emotion recognition. Deep spectrum features are derived from forwarding spectrograms through AlexNet and using the activations from the second fully connected layer (fc7) [16] as a feature vector. This approach has shown to be suitable in other computational paralinguistic tasks such as snore sound recognition [2, 9] and autism severity classification [4] but has yet to be explored for emotion classification. We compare the efficacy of the deep spectrum features with two sort of standard acoustic feature representations: the small but tailor made for emotion recognition extended Geneva Minimalistic Acoustic Parameter Set (eGeMAPS) [7]; and the large brute-force 2013 Interspeech Computational Paralinguistics Challenge features set (C OM PAR E) which can be considered an omnibus feature set for paralinguistic tasks [8]. We also compare with a bag-of-audioword (BoAW) representation [25], which has produced state-ofthe-art results for continuous emotion prediction [24]. Finally, as results presented in [12] indicate that (speech) CNN features are potentially more robust to the effects of environmental noise than more established speech features, we test all feature representations, using three versions – clean, noisy and denoised – of the FAU-AIBO Emotion Corpus [31], in both a 2- and a 5-class set-up. The rest of this paper is structured as follows: the deep spectrum feature extraction procedure is outlined in Section 2; the experimental settings, including a detailed database description, are given in Section 3; the results and corresponding discussion are presented in Section 4; finally, a brief conclusion and future work directions are given in Section 5
1 x Conv. size: 11; ch: 96; stride: 4 maxpooling
AlexNet
1 x Conv. size: 5; ch: 256
3 x Conv. Layers 1 - size: 5; ch: 384 2 - size: 5; ch: 384 3 - size: 5; ch: 256 maxpooling
DEEP SPECTRUM FEATURES
fully connected fc6 4 096 neurons
As already mentioned, deep spectrum features are derived from forwarding spectrograms through AlexNet and using the activations from the second fully connected layer (fc7) [16]; an overview of their extraction is provided in Figure 1. It is worth noting that spectral and cepstral features are widely used, not only in speech-based emotion literature, but in speech processing in general [15, 20, 26, 28].
2.1
maxpooling
fully connected fc7 4 096 neurons
4096 Dimensional Deep Spectrum Features Figure 1: Overview of the deep spectrum feature extraction procedure. Spectrograms are generated from whole audio files and then fed through the pre-trained image classification CNN AlexNet. The activations of AlexNet’s last fully connected layer, fc7, are used to form the deep spectrum feature vectors. Abbreviations: conv denotes convolutional layers and ch denotes channels.
Spectrogram Creation
The first stage of the extraction procedure is to create spectrograms in a suitable format for processing AlexNet. A spectrogram is a 2-dimensional visual representation of the time varying spectral characteristics of an audio signal [20]. To create the plots, we use the Python package matplotlib [13] with the following settings: the Fast Fourier Transform (FFT) is computed using a window size of 256 samples with an overlap of 128 samples; we use a Hanning window function and compute the power spectral density on the dB power scale. The spectrograms are then plotted using a viridis colour mapping which is a perceptually uniform sequential colour map varying from blue (low range) to green (mid range) to yellow (upper range). Results presented in [2] demonstrate the suitability of this colour mapping for extracting deep spectrum features over other candidates such as jet or greyscale. Finally the plots are scaled
and cropped to square images without axes and margins to comply with the input needs of AlexNet. Our spectrograms have a scale of 227 ⇥ 227 pixels.
2.2
Deep Feature Extraction
Having created the spectrogram plots, the next step is to create the feature representation. For this we use the publicly available toolkit Caffe [14] to obtain the models and weights for AlexNet [16].
479
Session: Experience 1 – Social and Affective Multimedia
MM’17, October 23–27, 2017, Mountain View, CA, USA
Table 1: The 42 low-level descriptors (LLD) provided in the eGeMAPS acoustic feature set.
Table 2: The 65 low-level descriptors (LLD) provided in the C OM PAR E acoustic feature set.
1 energy related LLD
Group
4 energy related LLD
Group
Sum of auditory spectrum (loudness)
Prosodic
25 spectral LLD
Group
a ratio (50–1 000 Hz / 1-5 k Hz) Energy slope (0–500 Hz, 0.5–1.5 k Hz) Hammarberg index MFCC 1–4 Spectral Flux
Spectral Spectral Spectral Cepstral Spectral
Sum of auditory spectrum (loudness) Sum of RASTA-filtered auditory spectrum RMS Energy, Zero-Crossing Rate
prosodic prosodic prosodic
55 spectral LLD
Group
6 voicing related LLD
Group
F0 (Linear & semi-tone) Formants 1, 2, (freq., bandwidth, ampl.) Harmonic difference H1–H2, H1–A3 log. HNR, Jitter (local), Shimmer (local)
Prosodic Voice Quality Voice Quality Voice Quality
RASTA-filt. aud. spect. bds. 1–26 (0-8 k Hz) MFCC 1–14 cepstral Spectral energy 250–650 Hz, 1 k–4 k Hz Spectral Roll-Off Pt. 0.25, 0.5, 0.75, 0.9 Spectral Flux, Centroid, Entropy, Slope Psychoacoustic Sharpness, Harmonicity Spectral Variance, Skewness, Kurtosis
spectral cepstral spectral spectral spectral spectral spectral
6 voicing related LLD
Group
F0 (SHS & Viterbi smoothing) Prob. of voicing log. HNR, Jitter (local & DDP), Shimmer (local)
prosodic voice quality voice quality
AlexNet was the first large, deep CNN to be successfully applied to the ImageNet task in 2012; in both classification and localisation tasks, it secured first place with almost half the error rates of the best conventional image analysis approach [17]. AlexNet consists of five convolutional layers of varying kernel sizes, followed by three fully connected layers, the last of which is used to perform the 1 000-way classification required for the ImageNet tasks by applying a softmax function. For the deep spectrum feature extraction, the spectrogram plots are forwarded through the pre-trained networks and the activations from the neurons on the second fully connected layer fc7 are extracted as feature vectors (cf. Figure 1). The resulting feature set has 4 096 attributes, one for every neuron in the AlexNet’s fully connected layer. Results presented in [2] demonstrate that AlexNet is better suited for deep spectrum feature generation than VGG19 [30].
3
of 42 low-level-descriptors (LLDs) as described in Table 1. For full details, the reader is referred to [7]. C OM PAR E is a large (high dimensional) brute-forced acoustic feature set containing 6 373 static features (i. e. functionals) of low-level descriptor (LLD) contours. An overview of the prosodic, spectral, cepstral, and voice quality LLD’s is given in Table 2. The functionals applied to the LLD contours include the mean, standard deviation, percentiles and quartiles, linear regression functionals, and local minima/maxima related functionals. For full details, the reader is referred to [8]. BoAW is a sparse audio representation formed by the quantisation (bagging) of acoustic LLDs; each frame-level LLD vector is assigned to an audio word from a codebook learnt from some training data. Counting the number of assignments for each audio word, a fixed length histogram (bag) representation of an audio clip is generated. The histogram represents the frequency of each identified audio word in a given audio instance [25]. Due to the quantisation step, BoAW representations can be considered more robust than LLDs. The sparsity of the final feature representation can be controlled by two parameters: the codebook size (Cs) which determines the dimensionality of the final feature vectors, and the number of assignments (Na) which determines the number of words assigned to an audio instance. For further details on BoAW formation the reader is referred to both [24, 25].
EXPIREMENTAL SETTINGS
This section outlines the key experimental settings – feature representations (Section 3.1), the FAU-AIBO Emotion Corpus (Section 3.2), the denoising solution (Section 3.3) and the classification set-up (Section 3.4) – used to generate the presented results.
3.1
Feature Representations
All results are presented on four different utterance level acoustic feature representations. In addition to the deep spectrum features previously outlined (cf. Section 2), we also test the extended Geneva Minimalistic Acoustic Parameter Set (eGeMAPS) [7], the 2013 Interspeech Computational Paralinguistics Challenge features set (C OM PAR E) [8], and the bag-of-audio-words (BoAW) paradigm [25]. All three conventional acoustic representations tested have been shown to be suitable for emotion recognition tasks [5, 8, 11, 19, 21, 24]. eGeMAPS is a small (low dimensional) knowledge-based acoustic feature sets purposely designed to have a high level of robustness for capturing emotion from speech [7]. It consists of 2 functional descriptors, arithmetic mean and the coefficient of variation, of a set
3.2
Emotional Speech Database
Despite being a well known challenge for speech-based emotion recognition [28], there is still a comparative lack of studies which address this task in realistic data conditions. In this regard, we test all feature representations using three versions of the popular FAUAIBO Emotion Corpus (FAU-AIBO). This database is a corpus of German children communicating with Sony’s AIBO pet robot [31]. The speech is spontaneous as the children were instructed to talk
480
Session: Experience 1 – Social and Affective Multimedia
MM’17, October 23–27, 2017, Mountain View, CA, USA
Table 3: The two different emotion categories – Idle (IDL) and Negative (NEG) – and the number of training and test utterances in each for the FAU-AIBO Emotion Corpus Class IDL NEG Total
Train 5 966 3 224 9 190
Test 5 468 2 418 7 886
Table 4: The five different emotion categories and the number of training and test utterances in each for the FAU-AIBO Emotion Corpus
Total 11 434 5 642 17 076
Emotion Angry Emphatic Neutral Postive Rest Total
to AIBO as they would a friend. The robot was controlled in a wizard-of-oz scenario and the human operator would sometimes make AIBO deliberately misbehave in order to provoke an emotional reaction from the child participant. The data was recorded with both a close talk (clean) and a room (noisy) microphone from a video camera approximately at 3m distance from the participant. The noisy recordings contain a range of reverberation and background noises; we therefore also test all features on a de-noised (densd) version of these recordings cleaned with a state-of-the-art recurrent neural network speech enhancement system (cf. Section 3.3). The corpus can be divided into speaker independent training and test partitions of either 2- or 5- emotional classes (cf. Tables 3 and 4). Due to the presence of reverberation and background noises rendering some of the noisy speech samples inaudible, there is a greater amount of clean utterances. To ensure a matched number of utterance in each conditions, we only used clean recordings where there was a matched noise recording. The number of utterances per emotion in the train and test partitions is given for the 2-class problem in Table 3, and for the 5-class problem in Table 4. Note that the 2009 Interspeech Computational Paralinguistics Challenge [27] used the complete set of clean utterances (a total of 18 216 utterances); therefore the results presented in this paper are not directly comparable with those found using the 2009-challenge data.
3.3
Test 600 1 481 5 082 206 517 7 886
Total 1 439 3 494 10 108 839 1 196 17 076
using our open-source openXBOW toolkit [25]. An extensive iterative search was performed to identify the codebook size (Cs 2 {10, 20, 50, 100, 200, 500, 1 k, 2 k, 5 k}) and number of assignments (Na 2 {10, 20, 50, 100, 200, 500}), with random assignments being used to generate all codebooks. The deep spectrum features were extracted as per Section 2. All feature representations were fed into a linear support vector machine (SVM) implemented using the scikit-learn toolbox1 . The SVMs were trained using stochastic gradient descent, with the gradient of the loss being estimated per sample and the model being sequentially updated. The regularisation term (a) was optimised on a scale from {1, 2, 5} · 10 6 to {1, 2, 5} · 101 using a speakerindependent 2-fold cross validation procedure on the training set2 . As in [27], all results reported are for the FAU-AIBO test set with the corresponding models trained on the full training set (cf. Table 3 and Table 4). Results are given in terms of Unweighted Average Recall (UAR); this is the standard measure of the Interspeech Computational Paralinguistics Challenges and is suitable for use when the distribution among classes is not balanced. We also investigate the effect of upsampling the minority class(es) to overcome potential effects of the class imbalances. All minority class(es) are randomly upsampled to be 0.75 the size the majority class; this factor was determined empirically in preliminary investigations.
Speech Enhancement
To test the effect of denoising on the different feature representations, the noisy data is filtered based on a long short-term memory (LSTM) deep recurrent neural network (DRNN) architecture proposed in [34, 35]. This network consists of 100 input neurons according to the input feature dimensionality, which means 100 Mel spectra extracted from the noisy speech data. This is then followed by three LSTMRNN layers of 256 neurons interspaced by feed-forward layers of 64 neurons and hyperbolic tangent activations. The output is a 100dimensional mask, which allocates which frequency band should be suppressed and which should be enhanced. The network was trained on several noisy and reverberated versions of the AudioVisual Interest Corpus; for full details the reader is referred to [34].
3.4
Train 839 2 013 5 026 633 679 9 190
4
RESULTS
When using the clean and unbalanced training data the eGeMAPS features achieved (clean) test set UARs of 0.630 and 0.268 for the 2and 5-class set-ups, respectively (cf. Table 5). Interestingly in the other matched-noise-type systems we observe a slight increase in the (unbalanced) 2-class UARs; these conditions achieved the strongest 2-class UARs of 0.655 for this feature set. Random oversampling appears to be more beneficial in the 5-class set-up than in the 2-class set-up when using eGeMAPS features. Indeed, the strongest 5-class result, 0.370, was achieved in matched train-test clean condition with random oversampling. Furthermore, as was to be expected, there is a drop in performance in all cross-noise-type train-test conditions. When using C OM PAR E features we observed an increase in both the 2- and 5-class UARs for the matched clean conditions compared to eGeMAPS (cf. Table 6). The strongest C OM PAR E 2- and 5class UARs found were 0.685 and 0.389, respectively, noting that both were achieved with random oversampling. In general, the
Classification Set-up
The eGeMAPS and C OM PAR E feature representations were extracted using the openSMILE toolkit [8]. We test the efficacy of the BoAW set-up proposed in [24], which gained state-of-the-art emotion detection results on the RECOLA database. The LLDs are the Mel Frequency Cepstral Coefficients (MFCCs) 1–12 and the logarithmic signal energy extracted using 25 ms long frames, with a frame rate of 10 ms, and a preemphasis filter (k = 0.97) using openSMILE [8]. The BoAW representations were formed
1 2
481
http://scikit-learn.org Fold 1: FAU-AIBO Training Set IDs between 1 and 16 Fold 2: FAU-AIBO Training Set IDs between 18 and 32
Session: Experience 1 – Social and Affective Multimedia
MM’17, October 23–27, 2017, Mountain View, CA, USA
Table 7: A comparison of UAR’s found using BoAW feature representations for different noise-types; clean, noisy and denoised (densd) when performing 2- and 5-class emotion recognition on the test set of the FAU-AIBO corpus. All results where found when using the unbalanced training data. The optimal codebook size (Cs), and number of assignments (Na) found for each system are also given.
Train 2-Class Ov. Clean Noisy Densd .654 .567 .554 .596 .633 .609 .556 .641 .508 Train 5-Class Ov. Clean Noisy Densd .370 .237 .248 .295 .220 .300 .273 .214 .252
Test
Clean Noisy Densd
Train 2-Class Un. Clean Noisy Densd .630 .619 .545 .512 .665 .636 .509 .597 .665 Train 5-Class Un. Clean Noisy Densd .268 .221 .229 .205 .262 .261 .224 .264 .213
Test
Test.
Clean Noisy Densd
Test.
Table 5: A comparison of UAR’s found using the eGeMAPS feature representation for different noise-types; clean, noisy and denoised (densd) when performing 2- and 5-class emotion recognition on the test set of the FAU-AIBO corpus. Results are given when using either unbalanced (Un.) or randomly oversampled (Ov.) training data.
Clean Noisy Densd
Clean Noisy Densd
Train 2-Class Un. Clean Noisy Densd .639 .619 .626 .626 .647 .621 .583 .621 .635 Train 5-Class Un. Clean Noisy Densd .328 .321 .265 .262 .246 .284 .259 .250 .304
Clean Noisy Densd
Densd UAR Cs Na .569 200 10 .556 2 k 500 .617 5 k 100 Densd UAR Cs .266 5 k .259 1 k .295 5 k
Na 500 10 100
Table 8: A comparison of UAR’s found using BoAW feature representations for different noise-types; clean, noisy and denoised (densd) when performing 2- and 5-class emotion recognition on the test set of the FAU-AIBO corpus. All results where found when using randomly oversampled (Ov.) to artificially balance the training data. The optimal codebook size (Cs), and number of assignments (Na) found for each system are also given.
Train 2-Class Ov. Clean Noisy Densd .685 .644 .646 .513 .661 .611 .528 .611 .609 Train 5-Class Ov. Clean Noisy Densd .389 .342 .327 .284 .307 .325 .242 .256 .310
Test
Test.
Test.
Table 6: A comparison of UAR’s found using the C OM PAR E feature representation for different noise-types; clean, noisy and denoised (densd) when performing 2- and 5-class emotion recognition on the test set of the FAU-AIBO corpus. Results are given when using either unbalanced (Un.) or randomly oversampled (Ov.) training data.
Clean Noisy Densd
Train 2-Class Un. Clean Noisy UAR Cs Na UAR Cs Na .634 2 k 20 .600 5 k 20 .632 100 20 .635 5 k 200 .607 100 10 .626 500 100 Train 5-Class Un. Clean Noisy UAR Cs Na UAR Cs Na .311 5 k 10 .278 2 k 500 .274 20 10 .288 500 100 .264 1 k 500 .331 500 20
Test
C OM PAR E features perform weaker in the other matched-noisetype than eGeMAPS, but outperformed it in the cross-noise-types tests. However, the benefits of employing random oversampling, especially for 5 classes, are more obvious. For the 5-class problem, our denoising approach (cf. Section 3.3) appears advantageous, particularly in the unbalanced tests where the matched noise UAR is 0.246 which increases to 0.304 after denoising. The strongest BoAW UARs: 0.635 2-class – unbalanced matched noisy conditions (cf. Table 7); and 0.362 5-class – oversampled matched clean conditions (cf. Table 8), are below the strongest results observed for the other two acoustic feature sets. However, the BoAW paradigm appears to be less affected in cross-noise-type testing than the other feature representations. This could be due to the quantisation step used when constructing the BoAW representations (cf. Section 3.1); in the cross-noise-type BoAW tests the extracted MFCCs are quantised with respect to the training noise-type’s codebook before testing, as opposed to training and testing directly on features extracted from different-noise-type utterances.
Clean Noisy Densd
Clean Noisy Densd
Train 2-Class Ov. Noisy Na UAR Cs Na 1 .586 5 k 5 2 .599 5 k 20 5 .569 2 k 5 Train 5-Class Ov. Clean Noisy UAR Cs Na UAR Cs Na .362 1 k 20 .321 5,k 500 .288 500 200 .312 5 k 200 .302 20 10 .315 50 20 Clean UAR Cs .605 1 k .603 5 k .563 5 k
Densd UAR Cs Na .593 500 5 .571 500 5 .584 5 k 10 Densd UAR Cs Na .343 2 k 500 .295 100 10 .323 5 k 200
When comparing the BoAW codebook size and number of assignments between the different tests no discernible pattern emerges (cf. Table 7 and Table 8), a similar observation was made in [24]. However, when comparing the effects of oversampling before SVM training a clear distinction can be made between the 2- and 5-class problems (cf. Table 7 and Table 8). In the 2-class problem there appears to be no distinct advantage when using oversampling, whilst for the 5-class problem there appears to be a more distinct advantage. In general, this effect is seen in all features, however it is more pronounced for BoAW. The deep spectrum features appear to be suitable for speechbased emotion recognition (cf. Table 9). The strongest 2-class UAR, 0.683 with oversampled clean conditions, matches performance with the other feature representations. In the 5-class problem deep
482
Session: Experience 1 – Social and Affective Multimedia
MM’17, October 23–27, 2017, Mountain View, CA, USA
Clean Noisy Densd
Train 2-Class Un. Clean Noisy Densd .669 .547 .563 .603 .660 .639 .608 .642 .659 Train 5-Class Un. Clean Noisy Densd .368 .277 .268 .284 .314 .305 .247 .279 .299
Unwighted Average Recall
Test.
Clean Noisy Densd
Test.
Table 9: A comparison of UAR’s found using the Deep Spectrum feature representation for different noise-types; clean, noisy and denoised (densd) when performing 2- and 5-class emotion recognition on the test set of the FAU-AIBO corpus. Results are given when using either unbalanced (Un.) or randomly oversampled (Ov.) training data. Train 2-Class Ov. Clean Noisy Densd .683 .554 .575 .599 .659 .643 .588 .638 .654 Train 5-Class Ov. Clean Noisy Densd .396 .267 .255 .273 .355 .323 .247 .290 .333
0.66
***
0.64
***
***
0.62
*** ***
0.60 Clean
Noisy
Denoised
Figure 2: Comparison of the strongest 2-Class match-noisetype UAR’s found on the FAU-AIBO test set for the eGeMAPS, C OM PAR E, bag-of-audio-words (BoAW), and deep spectrum feature representations. The asterisks indicate that deep spectrum features significantly outperformed the corresponding acoustic feature space according to a 2-sided z-test (p < 0.001).
Unweighted Average Recall
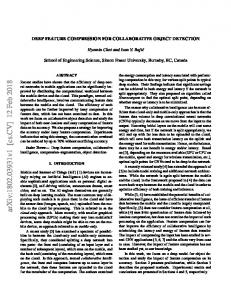
spectrum features performed the strongest, obtaining a UAR of 0.396 with oversampled matched clean conditions. The same trend is seen for the other matched conditions (cf. Figures 2 and 3), where the deep spectrum features obtained the strongest 5-class matched noisy and matched denoised UARs of 0.355 and 0.333, respectively. Given these features are extracted from speech spectrogram using an image-processing CNN, the performance of the deep-spectrum features, especially when compared with the more conventional speech features, is highly encouraging.
4.1
eGeMAPS ComParE BoAW Deep Spectrum
0.68
DISCUSSION
The presented deep spectrum features have been shown to either match or outperform three different speech features representation when performing matched-noise-type emotion recognition (cf. Figures 2 and 3). These results match with those presented in [2, 4, 9], which also show deep-spectrum features can either match or outperform the C OM PAR E feature representation when performing either snore sound recognition [2, 9] or autism severity classification [4]. The comparatively stronger performance of the deep spectrum features provides support for the speculation made in [12] that CNN features are more robust to the effects of environmental noise than other features, although more rigorous investigations are needed to verify this conjecture. Our denoising system did not work as well as expected; potentially updating the network parameters using FAU-AIBO data would have produced stronger performance. While our results are not directly comparable with those presented in the 2009 Interspeech Computational Paralinguistics Challenge (cf. Section 3.2), we will now briefly discuss our matched-noisetype results with respect to the challenge in order to give them some context. The challenge’s 2-class baseline UAR was 0.677, whilst results from the challenge entrants varied between 0.664 and 0.703 [26]. As can be seen in Figure 2 the deep spectrum features, as well as C OM PAR E, achieve comparable results with respect to the challenge. Similarly, the challenge’s 5-class baseline UAR was 0.382, whilst results from the challenge entrants varied between this baseline and 0.417 [26]. Again both deep spectrum and C OM PAR E features achieve comparable results (cf. Figure 3). These comparisons combined with the results presented in [2, 4, 9] indicate
0.40 ***
eGeMAPS ComParE BoAW Deep Spectrum
***
0.35 *** *** ***
0.30 ***
***
0.25 Clean
***
Noisy
Denoised
Figure 3: Comparison of the strongest 5-Class match-noisetype UAR’s found on the FAU-AIBO test set for the eGeMAPS, C OM PAR E, bag-of-audio-words (BoAW), and deep spectrum feature representations. The asterisks indicate that deep spectrum features significantly outperformed the corresponding acoustic feature space according to a 2-sided z-test (p < 0.001). the promise of image-based deep spectrum; further investigations are warranted to establish their suitability over a range of speech-based recognition tasks.
5
CONCLUSION
The use of pre-trained convolutional neural networks (CNNs) to extract robust feature representations of images is well established within the machine learning community. However, comparatively little research attention has been given to their suitability to form speech or acoustic features. Accordingly, this paper explored the use of deep spectrum features for speech-based emotion recognition; these features are formed by feeding spectrograms through AlexNet, an open-source image recognition pre-trained deep CNN [16], and using the activations of the last fully-connected hidden layer as the feature vector. The presented results indicate the suitability of this approach; deep spectrum features were shown to match
483
Session: Experience 1 – Social and Affective Multimedia
MM’17, October 23–27, 2017, Mountain View, CA, USA
or outperform conventional speech feature representations when performing 2-class and 5-class emotion classification respectively on the challenging FAU-AIBO Emotion Corpus. Whilst the use of CNNs in audio processing is not new, e. g. [1, 3, 12, 18, 22, 23, 33], deep image CNNs make a compelling case to be considered a legitimate audio feature extraction technique. Image CNNs such as AlexNet offer the advantage of being stable, open-source and known to produce salient features for a range of recognition tasks; to train an equivalent ‘all-purpose’ speech network, especially in an end-to-end setting, would take considerable data, time, and computing resources beyond the reach of many (non-commercial) research groups. Further, feature representation learning from spectrogram arguably offers more interpretability than from raw audio; phonetic information and supra-segmental acoustic features relating to articulation, loudness, pitch, and rhythm are inherently more readable in spectrograms than raw audio [20]. A range of future work is planned to further realise the potential of deep spectrum features. As well as establishing their suitability in other speech and acoustic recognition tasks, we plan to explore the benefits of forming our images from other spectral and cepstral based features such as the Mel-spectrum or the linear predictive spectral envelope. We will also explore the use of image-processing techniques to denoise our spectral representation before deep spectrum feature extraction. Regarding the image CNNs we will also explore the use of other pre-trained CNN’s such as GoogLeNet [32], and retraining the final softmax layer to suit the speech task at hand.
6
[8] F. Eyben, F. Weninger, F. Groß, and B. Schuller. 2013. Recent Developments in openSMILE, the Munich Open-Source Multimedia Feature Extractor. In Proc. of MM’13. ACM, Barcelona, Spain, 835–838. [9] M. Freitag, S. Amiriparian, M. Gerczuk, N. Cummins, and B. Schuller. 2017. An ‘End-to-Evolution’ Hybrid Approach for Snore Sound Classification. In Proc. of INTERSPEECH’17. ISCA, Stockholm, Sweden. 5 pages. [10] G. Gwardys and D. Grzywczak. 2014. Deep Image Features in Music Information Retrieval. Intl. J. Elec. & Tele. 60, 4 (2014), 321–326. [11] Z. Huang, T. Dang, N. Cummins, B. Stasak, P. Le, V. Sethu, and J. Epps. 2015. An Investigation of Annotation Delay Compensation and Output-Associative Fusion for Multimodal Continuous Emotion Prediction. In Proc. of AVEC’15, co-located with MM’15. ACM, Brisbane, Australia, 41–48. [12] Z. Huang, M. Dong, Q. Mao, and Y. Zhan. 2014. Speech emotion recognition using CNN. In Proc. of MM’14. ACM, Orlando, FL, USA, 801–804. [13] J. D. Hunter. 2007. Matplotlib: A 2D graphics environment. Comput. Sci. Eng. 9, 3 (2007), 90–95. [14] Y. Jia, E. Shelhamer, J. Donahue, S. Karayev, J. Long, S. Girshick, R.and Guadarrama, and T. Darrell. 2014. Caffe: Convolutional architecture for fast feature embedding. In Proc. of MM’14. ACM, Orlando, FL, USA, 675–678. [15] T. Kinnunen and H. Li. 2010. An overview of text-independent speaker recognition: From features to supervectors. Speech Commun. 52, 1 (2010), 12–40. [16] A. Krizhevsky, I. Sutskever, and G.E. Hinton. 2012. ImageNet Classification with Deep Convolutional Neural Networks. In Adv. Neural Inf. Process Syst., F. Pereira, C. J. C. Burges, L. Bottou, and K. Q. Weinberger (Eds.). Vol. 25. Curran Associates, Inc., 1097–1105. [17] J. LeCun, Y. Bengio, and G. Hinton. 2015. Deep learning. Nature 521 (2015), 436–444. [18] Q. Mao, M. Dong, Z. Huang, and Y. Zhan. 2014. Learning Salient Features for Speech Emotion Recognition Using Convolutional Neural Networks. IEEE Trans. Multimedia 16, 8 (2014), 2203–2213. [19] F. Pokorny, F. Graf, F. Pernkopf, and B. Schuller. 2015. Detection of Negative Emotions in Speech Signals Using Bags-of-Audio-Words. In Proc. of WASA’15, satellite to ACII’15. IEEE, Xi’an, P. R. China, 879–884. [20] T. F. Quatieri. 2001. Discrete-Time Speech-Signal Processing: Principles and Practice (Kindle ed.). Prentice Hall, Upper Saddle River, NJ, USA. [21] F. Ringeval, B. Schuller, M. Valstar, S. Jaiswal, E. Marchi, D. Lalanne, R. Cowie, and M. Pantic. 2015. AV+EC 2015 - The First Affect Recognition Challenge Bridging Across Audio, Video, and Physiological Data. In Proc. of AVEC’15, co-located with MM’15. ACM, Brisbane, Australia, 3–8. [22] T. N. Sainath, B. Kingsbury, G. Saon, H. Soltau, A. Mohamed, G. Dahl, and B. Ramabhadran. 2015. Deep Convolutional Neural Networks for Large-scale Speech Tasks. Neural Netw. 64 (2015), 39–48. [23] J. Schluter and S. Bock. 2014. Improved musical onset detection with convolutional neural networks. In Proc. of ICASSP’14. IEEE, Florence, Italy, 6979–6983. [24] M. Schmitt, F. Ringeval, and B. Schuller. 2016. At the Border of Acoustics and Linguistics: Bag-of-Audio-Words for the Recognition of Emotions in Speech. In Proc. of INTERSPEECH’16. ISCA, San Francisco, CA, USA, 495–499. [25] M. Schmitt and B. Schuller. 2017. openXBOW – Introducing the Passau OpenSource Crossmodal Bag-of-Words Toolkit. JLMR 18 (2017). 5 pages. [26] B. Schuller, A. Batliner, S. Steidl, and D. Seppi. 2011. Recognising Realistic Emotions and Affect in Speech: State of the Art and Lessons Learnt from the First Challenge. Speech Commun. 53, 9/10 (2011), 1062–1087. [27] B. Schuller, S. Steidl, and A. Batliner. 2009. The Interspeech 2009 Emotion Challenge. In Proc. of INTERSPEECH’09. ISCA, Brighton, UK, 312–315. [28] B. Schuller, S. Steidl, A. Batliner, F. Burkhardt, L. Devillers, C. M¨uller, and S. Narayanan. 2013. Paralinguistics in Speech and Language – State-of-the-Art and the Challenge. Comput Speech Lang. 27, 1 (2013), 4–39. [29] A. Sharif Razavian, H. Azizpour, J. Sullivan, and S. Carlsson. 2014. CNN features off-the-shelf: an astounding baseline for recognition. In Proc. of CVPR’14. IEEE, Columbus, OH, USA, 806–813. [30] K. Simonyan and A. Zisserman. 2015. Very Deep Convolutional Networks for Large-Scale Image Recognition. In Proc of ICLR’15. arXiv, San Diego, CA, USA. https://arxiv.org/abs/1409.1556, 14 pages. [31] S. Steidl. 2009. Automatic Classification of Emotion-Related User States in Spontaneous Children’s Speech. Logos Verlag, Berlin. [32] C. Szegedy, Wei Liu, Yangqing Jia, P. Sermanet, S. Reed, D. Anguelov, D. Erhan, V. Vanhoucke, and A. Rabinovich. 2015. Going deeper with convolutions. In Proc. of CVPR’15. IEEE, Boston, MA, USA, 1–9. [33] G. Trigeorgis, F. Ringeval, R. Br¨uckner, E. Marchi, M. Nicolaou, B. Schuller, and S. Zafeiriou. 2016. Adieu Features? End-to-End Speech Emotion Recognition using a Deep Convolutional Recurrent Network. In Proc. of ICASSP’16. IEEE, Shanghai, P. R. China, 5200–5204. [34] F. Weninger, F. Eyben, and B. Schuller. 2014. Single-Channel Speech Separation With Memory-Enhanced Recurrent Neural Networks. In Proc. of ICASSP’14. IEEE, Florence, Italy, 3737–3741. [35] F. Weninger, J. R. Hersheyy, J. Le Rouxy, and Bj¨orn Schuller. 2014. Discriminatively Trained Recurrent Neural Networks for Single-Channel Speech Separation. In Proc. of GlobalSIP’14. IEEE, Atlanta, GA, USA, 577–581.
COMPETING INTERESTS
The authors have declared that no competing interests exist.
7
ACKNOWLEDGEMENTS
This work was supported by the European Unions’s Seventh Framework and Horizon 2020 Programmes under grant agreements No. 338164 (ERC StG iHEARu) and No. 688835 (RIA DE-ENIGMA).
REFERENCES [1] O. Abdel-Hamid, A. Mohamed, H. Jiang, L. Deng, G. Penn, and D. Yu. 2014. Convolutional Neural Networks for Speech Recognition. IEEE/ACM Trans. Audio, Speech, Language Process. 22, 10 (2014), 1533–1545. [2] S. Amiriparian, M. Gerczuk, S. Ottl, N. Cummins, M. Freitag, S. Pugachevskiy, A. Baird, and B. Schuller. 2017. Snore Sound Classification Using Image-based Deep Spectrum Features. In Proc. of INTERSPEECH’17. ISCA, Stockholm, Sweden. 5 pages. [3] I. Bae, S. H.and Choi and N. S. Kim. 2016. Acoustic Scene Classification Using Parallel Combination of LSTM and CNN. In Proc. of DCASE’16, satellite to EUSIPCO’16. IEEE, 11–15. [4] A. Baird, S. Amiriparian, N. Cummins, A. M. Alcorn, A. Batliner, S. Pugachevskiy, M. Freitag, M. Gerczuk, and B. Schuller. 2017. Automatic Classification of Autistic Child Vocalisations: A Novel Database and Results. In Proc. of INTERSPEECH’17. ISCA, Stockholm, Sweden. 5 pages. [5] J. Deng, N. Cummins, J. Han, Z. Xu, X.and Ren, V. Pandit, Z. Zhang, and B. Schuller. 2016. The University of Passau Open Emotion Recognition System for the Multimodal Emotion Challenge. In Proc. of CCPR’16. Springer, Chengdu, P. R. China, 652–666. [6] Y. Donahue, J.and Jia, O. Vinyals, J. Hoffman, N. Zhang, E. Tzeng, and T. Darrell. 2014. DeCAF: A Deep Convolutional Activation Feature for Generic Visual Recognition.. In Proc. of ICML’14, Vol. 32. JMLR, Beijing, P. R. China, 647–655. [7] F. Eyben, K. Scherer, B. Schuller, J. Sundberg, E. Andre, C. Busso, L.Y. Devillers, J. Epps, P. Laukka, S. Narayanan, and K. P. Truong. 2016. The Geneva Minimalistic Acoustic Parameter Set (GeMAPS) for Voice Research and Affective Computing. IEEE Trans. on Aff. Comp. 7, 2 (2016), 190–202.
484