Catena 167 (2018) 147–159
Contents lists available at ScienceDirect
Catena journal homepage: www.elsevier.com/locate/catena
An improved algorithm for identifying shallow and deep-seated landslides in dense tropical forest from airborne laser scanning data Mustafa Ridha Mezaala, Biswajeet Pradhanb,c,
T
⁎
a
Department of Civil Engineering, Faculty of Engineering, Universiti Putra Malaysia, 43400 Serdang, Selangor, Malaysia School of Systems, Management and Leadership, Faculty of Engineering and IT, University Technology Sydney, CB11.06.217, Building 11, 81 Broadway, Ultimo, NSW 2007, Australia c Department of Energy and Mineral Resources Engineering, Choongmu-gwan, Sejong University, 209 Neungdong-ro, Gwangjin-gu, Seoul 05006, Republic of Korea b
A R T I C LE I N FO
A B S T R A C T
Keywords: Landslide types Object-based approach LiDAR Remote sensing GIS
Landslides are natural disasters that cause environmental and infrastructure damage worldwide. They are difficult to be recognized, particularly in densely vegetated regions of the tropical forest areas. Consequently, an accurate inventory map is required to analyze landslides susceptibility, hazard, and risk. Several studies were done to differentiate between different types of landslide (i.e. shallow and deep-seated); however, none of them utilized any feature selection techniques. Thus, in this study, three feature selection techniques were used (i.e. correlation-based feature selection (CFS), random forest (RF), and ant colony optimization (ACO)). A fuzzybased segmentation parameter (FbSP optimizer) was used to optimize the segmentation parameters. Random forest (RF) was used to evaluate the performance of each feature selection algorithms. The overall accuracies of the RF classifier revealed that CFS algorithm exhibited higher ranks in differentiation landslide types. Moreover, the results of the transferability showed that this method is easy, accurate, and highly suitable for differentiating between types of landslides (shallow and deep-seated). In summary, the study recommends that the outlined approaches are significant to improve in distinguishing between shallow and deep-seated landslide in the tropical areas, such as; Malaysia.
1. Introduction
Pradhan, 2018).
Cameron Highlands in Malaysia has been frequently affected due to geo-hazards such as landslides and floods. The effects include great economic damage, loss of lives and negative environmental impact (Hong et al., 2018). Landslide as one of the geo-hazards is considered as a geological phenomenon under the influence of gravity, which can occur in both onshore, offshore, and coastal environments (Pradhan and Lee, 2010). The Cameron Highlands is a steep hillside landscape with heavy vegetation cover that obscures and subdues morphologic features which are indicative of landslides (Pradhan and Mezaal, 2017). Such landscapes pose a great challenge to landslides identification using synthetic aperture radar (SAR) images, optical and aerial photographs (Bui et al., 2012; Imani et al., 2012; Pourghasemi et al., 2014), high spatial resolution multispectral images (Pradhan, 2013), very high resolution (VHR) satellite images and moderate resolution digital terrain models (DTMs) (Ardizzone et al., 2007; Chen et al., 2014; Pradhan et al., 2016; Li et al., 2015; Mezaal et al., 2017a; Bordoni et al., 2018; Sameen and Pradhan, 2017; Mezaal and Pradhan, 2018; Fanos and
2. Previous work Compared with the traditional techniques, elevation data are acquired rapidly and accurately using active laser transmitters and receivers light-detection and ranging (LiDAR) data (Pradhan et al., 2016; Tarolli et al., 2009). Generally, LiDAR can penetrate dense vegetation making it a better alterative compared with other remote sensing data. In addition, other information regarding high point density terrain is provided in Mezaal et al. (2017b). Ground surface and useful information about topographic features are provided using High-resolution LiDAR-derived DEM even in landslides covered under dense vegetation (McKean and Roering, 2004). Furthermore, LiDAR imagery is capable revealing present and historic landslides and its effectiveness/ vulnerability in mapping naked slopes that are formed primarily by landslides (Schulz, 2007). Based on the depth of the surface rupture and movement features, landslides can be classified as deep-seated or shallow (Brunetti et al.,
⁎ Corresponding author at: School of Systems, Management and Leadership, Faculty of Engineering and IT, University Technology Sydney, CB11.06.217, Building 11, 81 Broadway, Ultimo, NSW 2007, Australia. E-mail addresses:
[email protected],
[email protected] (B. Pradhan).
https://doi.org/10.1016/j.catena.2018.04.038 Received 20 February 2018; Received in revised form 19 April 2018; Accepted 27 April 2018 0341-8162/ © 2018 Published by Elsevier B.V.
Catena 167 (2018) 147–159
M.R. Mezaal, B. Pradhan
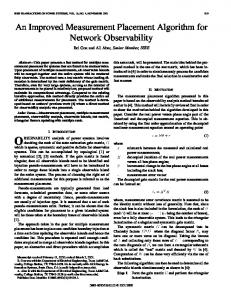
Fig. 1. Shows study are that consist of (A) Analysis area (B) Test site.
identification in any environment can be improved by selecting the most significant features (Chen et al., 2014). As shown in a study conducted by (Van Westen et al., 2008), selecting the most significant feature helps in differentiating between non-landslides and landslides. The efficiency of selecting the most significant feature for detecting landslides was proven in a study conducted by (Stumpf and Kerle, 2011). But the use LiDAR data to handle the feature selection for landslide detection is studied by few researchers (Dou et al., 2015; Li et al., 2015). Another option for feature selection is a random forest (RF) (Chen et al., 2014). More of recent, (Sameen et al., 2017) utilized the use of ant colony optimization (ACO) for feature selection. While Pradhan and Mezaal (2017) demonstrated the significance of feature selection in differentiating between the types of landslides by using correlation-based feature selection (CFS) algorithm. Although, these feature selection methods were applied in remote sensing data classification successfully. However, it was observed that there is a lack of studies on integration of correlation-based feature selection (CFS), random forest (RF), and ant colony optimization (ACO) with the objectbased approach (OBA) carried out to aid in differentiating between the different types of landslides (i.e. shallow and deep-seated). This study aims at investigating the most optimal algorithms for feature selection in order to differentiate between two types of the landslide (i.e. shallow and deep-seated) using airborne laser scanning data. To achieve this aim, it was imperative to accomplish the following objectives; 1) to optimize the multiresolution segmentation parameters, 2) to applying the three algorithms to feature selection from high-resolution airborne laser scanning data, and 3) to determine the appropriate algorithms for selecting feature by using random forest (RF) classifier. The studied algorithms have not been tested in previous studies, particularly for types of landslides detection. The advantages of novel optimization techniques may have contributed to the improvement of the differentiation between the types of landslide through a high-resolution LiDAR data and supervised random forest.
2009; Guzzetti et al., 2012). These two classifications differ in terms of damage influence, size and volume (Zêzere et al., 2005). Also, evaluation of landslide mass volume is difficult (Brunetti et al., 2009). Deepseated landslides are usually occurred due to interaction between natural denudation process and long-term rainfall, whereas, shallow landslides are associated with short high-intensity rainfall (Zêzere et al., 2005). In literature many studies can be found which are aimed in identifying different types of landslides using LiDAR data (Chen et al., 2015; Deng and Shi, 2014; Lin et al., 2013; Rau et al., 2012; Kasai et al., 2009; Van Den Eeckhaut et al., 2005; Lashermes et al., 2007; Tarolli et al., 2009; Passalacqua et al., 2010). The different types of landslides provide significant and valuable information for the geological process. Therefore, for the purpose of investigating hillsides geomorphological development is to mitigate landslide hazards, thus, it is necessary to differentiate between the different types of landslides for better efficiency (Dou et al., 2015; Lin et al., 2013). Object-based and pixel-based methods are the two general image analysis approaches for terrain evaluation. But object-based image analysis is becoming the most basic means of processing very high-resolution imagery. This is due to wide utilization of sub-meter imagery and availability. Furthermore, this approach is a well-known technique resulting from the recent advances in machine intelligence and computer vision, with the main purpose of automatically extracting both man-made and natural objects from remote sensing images (Akçay and Aksoy, 2008). Also, the object-based approach is a step toward replicating human interpretation process because the information content of an object is used to classify landscapes (Navulur, 2006). Finally, with the use of object-based approach, the landslides can be accurately detected by integrating contextual information to image analysis (Martha et al., 2011). This will help in reducing time and cost for developing a decent landslide inventory map especially in large areas. Over-fitting is generally caused by processing a large number of irrelevant features (Chen et al., 2014). By contrast, in order to avoid over-fitting, the most relevant feature should be selected for best classification results (Kursa and Rudnicki, 2010). Therefore, landslide 148
Catena 167 (2018) 147–159
M.R. Mezaal, B. Pradhan
3. Study area
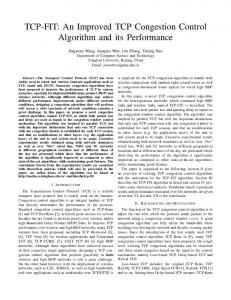
spatial reference. Subsequently, the identification of the characteristics and location of the landslides was facilitated with the aid derived layers which were generated using LiDAR-based DEM (Miner et al., 2010). One of the significant factors that affect land stability is the slope and this is due to its direct impact on landslide phenomenology (Martha et al., 2011). The slope is also considered as a principal factor that affects landslide occurrences (Pradhan and Lee, 2010). Landslide mapping can be facilitated by hillshade map which indicates relative slope and provides a good image showing terrain movement (Olaya, 2009). It is important to note that texture features and geometric feature are significant in improving the classification accuracy of landslide mapping (Chen et al., 2014). In the recent times, (Mezaal et al., 2017a) shows that the intensity feature derived from LiDAR point cloud is highly effective toward differentiating between the landslide and other classes of land cover. The accuracy of DEM and its capability to represent the surface are affected by interpolation algorithm in addition to sampling density and terrain morphology (Barbarella et al., 2013). (Fig. 3) shows the features used in the current study which were derived from LiDAR data. They include hillshade, intensity, height (nDSM), slope, and aspect. Others are orthophotos, and texture based features.
The area under investigation is located in Cameron Highlands and it's characterized as tropical, densely vegetated and rainforest area. The location was chosen because of the high frequency of landslide occurrences in the area. Geographically, Cameron Highlands is situated on latitude 4° 26′ 3″ to 4° 26′ 18″ and longitudes 101° 23′ 48 to 101° 24′ 4″ and covers 26.7 km2 on the northern part of Malaysian Peninsular. The region record an annual average rainfall of about 2660 mm and average temperature of approximately 24 °C and 14 °C during the day and night respectively. About 80% of the total land mass is a thick forest and the landform ranges from flat terrain to hilly area (80°). Two sites were selected to study the proposed method as seen in (Fig. 1), with analysis area labelled (A) and test area labelled (B). The analysis area was utilized to develop the methodology for differentiating between the two types of the landslides. Whilst, the test area was used for testing the methodology. Considerations were taken for selecting the test site to avoid missing in a number of classes. In addition, the training sample size was evaluated through stratified random sample method in order to enhance the accuracy of aforementioned areas (i.e. Analysis area and Test site).
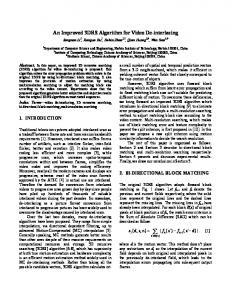
4.2. Multiresolution segmentation algorithm 4. Methodology This study begins with pre-processing of LiDAR data and landslide inventories. This stage is very crucial before the commencement of the other subsequent steps. Specifically, pre-processing step will help to reduce outliers and noise from the data. Subsequently, the high-resolution DEM (0.5 m) was derived from LiDAR point clouds and was utilized to generate other LiDAR-derived products and landslide conditioning factors (i.e. aspect, slope, height (nDSM), intensity and hillshade). In the next stage, the geometric distortions of the LiDAR-derived products and orthophtos were corrected and combined together in one coordinate system and prepared in GIS for feature extraction. The parameters such as shape, scale, and compactness were obtained in different levels of segmentation using Fuzzy-based Segmentation Parameter optimizer (FbSP optimizer) proposed by (Zhang et al., 2010). The evaluation was done using stratified random scheme and the training sample was as per the outlined procedure carried out by (Ma et al., 2016). Relevant features were selected using three algorithms namely random forest (RF), correlation-based feature selection (CFS) and ant colony optimization (ACO) to rank the feature from the most important to the less important. Random forest (RF) classifier was used to evaluate the performance of aforementioned algorithms in differentiating between two landslide types namely deep-seated and shallow. Transferability was tested in another part of the study area (i.e. Test site). At the end, the results were validated and compared based on confusion matrix. Other landslides characteristics such as length, width, direction and run off were identified by overlaying the results with slope and aspect which were derived from LiDAR DEM data. The flowchart of the proposed method is depicted in (Fig. 2).
Image segmentation is a process of partitioning image into multiple parts and is prerequisites and necessary. The reason is being that the delineation qualities of the target objects such as size and shape have a direct influence on the subsequent image classification (Duro et al., 2012; Chen et al., 2017). Multiresolution segmentation is most frequently used among other methods used in landslide studies, hence, was chosen in this study. In this approach, image pixels having homogeneous spatial and spectral (textural characteristics) are grouped together (Dou et al., 2015). The smaller objects are replaced with the larger ones based on certain criteria obtained from parameters such as color, scale, and shape (smoothness and compactness) (Benz et al., 2004). These three (3) parameters (scale, shape, and compactness) are obtained in this algorithm. One of the methods to determine the values of these parameters is to use a conventional trial-and-error method, but this method takes too long and is considered tedious (Pradhan et al., 2016). Therefore, various semi-automatic and automatic methods for the optimization of the parameters segmentation have been attempted (Martha et al., 2011; Belgiu and Drǎguţ, 2014; Drǎguţ et al., 2010). However, their optimization approach is limited to optimization of scale, but, the relationship between the parameters is not investigated (Pradhan et al., 2016). Some of the advanced methods for the automatic combination of segmentation parameters are Taguchi optimization method proposed by (Pradhan et al., 2016) and fuzzy logic supervised approach proposed by (Zhang et al., 2010). However, differentiating image objects of variable scales still remain a challenge and not all features selection are fully exploited using a particular segmentation scale. So, an automatic approach should be attempted and implemented for better results.
4.1. Data used
4.3. Object feature calculation
The LiDAR point cloud data was taken on January 15, 2015, over the proposed area (26.7 km2) of the Ringlet around Cameron Highlands an altitude of 1510 m. The point density and the pulse rate frequency for the LiDAR data is 8 points per square meter and 25,000 Hz, respectively. The absolute accuracy of the LiDAR data was restricted to the root-mean-square errors of 0.3 and 0.15 m as standardized by Department of Survey and Mapping Malaysia (JUPEM) for the horizontal and vertical axes, respectively. A similar approach for the acquisition of LiDAR point cloud data was adopted to collect the orthophotos. A DEM with 0.5 m spatial resolution was interpolated from the LiDAR point clouds after the non-ground points were removed using inverse distance weighting, with GDM2000/Peninsula RSO as the
In object-based approach, classification is carried out on segments rather than on single pixels. The classification is done by including a more information such as texture, shape, and context related to the image objects (Martha et al., 2011). The useful object features are selected using subjective or objective methods of the object-based classification. Feature selection algorithm to an extent is an objective method (Genuer et al., 2010). While the subjective methods are based on experience and knowledge of the user (Laliberte et al., 2007). As aforementioned, in this study three (3) algorithms (CFS, ACO and RF) are used for the purpose of obtaining the most optimal algorithm for differentiating between landslide types (deep-seated and shallow). Also, four object-features; Mean and StdDev visible band, LiDAR data, 149
Catena 167 (2018) 147–159
M.R. Mezaal, B. Pradhan
Fig. 2. Methodology applied in the current study.
of ants is set to be equals to the number of attributes within the data. Therefore, with this equality, each ant can initiate path construction at a different attribute. Different ants may choose a different path for initial position and traverse nodes probabilistically until a traversal stopping criterion is satisfied. The resulting subsets are gathered and evaluated. If the algorithm has executed a certain number of cycles or optimal subset has been found then the process will stop. And the best attribute subset that is encountered is written as output. In a situation where none of these conditions holds, then the process is reiterated by updating the pheromone and creating a new set of ants.
texture, and geometry were used. The eCognition software was used to extract the 86 features (Mean and StdDev) from airborne laser scanning data. This was detailed in Table 1 as recommended by previous researchers (Pradhan and Mezaal, 2017; Li et al., 2015; Rau et al., 2014; Chen et al., 2014). 4.3.1. Ant colony optimization (ACO) The ant colony optimization (ACO) is a metaheuristic optimization technique whose applications are growing significantly in many fields. ACO is a powerful technique for parameter optimization, and the influence of the expert subjectivity is eliminated. The key parameters of this algorithm i.e. crossover, mutation, and survival of chromosomes are the key factor of its superior performance. In addition, there is no need for step size calculation in ACO and also the derivative information is not required (Ladha and Deepa, 2011). Pheromone evaporation could inhibit speedy convergence of the algorithm toward suboptimal region (Dorigo and Stützle, 2010). Furthermore, ACO algorithm can improve rule discovery by achieving a flexible and robust search for an ideal combination of terms that involve values of the predictor attributes (Parpinelli et al., 2002). This algorithm has been successfully applied in many applications in remote sensing, such as image segmentation (Cao and Xia, 2007), feature extraction (Li and Wang, 2012), parameter selection (Alwan and Ku-Mahamud, 2012), and feature selection (Sameen et al., 2017). The overall flowchart of ACO-based feature selection is depicted in (Fig. 4). The workflow process commences with the generation of a number of ants. These ants were then placed randomly on a graph, i.e., each ant starts with one random attribute. This means that the number
4.3.2. Correlation based feature selection (CFS) The Correlation-based Feature Selection (CFS) assesses subset in feature by using filter algorithm. The CFS assessed the capability of a set in features using heuristic evaluation function based on the correlation of features. Hall and Holmes (2003) claimed that a superior subset of features should interrelate with classes highly uncorrelated to each other. Thus, the criterion of a subset can be evaluated using the following formula (1)
rcz =
Krzi K + K (K − 1) rii
(1)
where rzc represent correlation between the summation of class variable and feature, k denotes number of subset features, rzi denotes average of the correlations between the subset features the class variable, and rii is the average inter-correlation between subset features. In addition, the best search was used to discover the feature space, and the five consecutive fully expanded non-improving subsets were set to a stopping 150
Catena 167 (2018) 147–159
M.R. Mezaal, B. Pradhan
Fig. 3. LiDAR derived data (A) orthophotos (B) DTM (C) DSM (D) Intensity (E) Height (F) Slope (G) Aspect.
calculated. In this study, the feature evaluation procedure was performed automatically using the R package “RRF”.
criterion to avoid searching the entire feature subset space. In this study, the WEKA package was used to implement this feature selection algorithm.
4.4. RF classifier 4.3.3. Random forest (RF) The use of random forest for feature evaluation is referred to as embedded method (Pal and Foody, 2010). This method provides criterion for variable importance in each feature achieved by calculating mean reduction in the classification accuracy for the out of bag (OOB) data from bootstrap sampling (Verikas et al., 2011). Let assume bootstrap samples b = 1, …, B, then for variable xj, the mean decrease in classification accuracy Dj as important measure is given by formula (2)
Dj =
1 B
The RF algorithm was proposed by Breiman (2001) and is based on several decision trees designed for classification or regression and this algorithm is a nonparametric ensemble learning. Using various types of remote sensing data, this supervised method has been successfully applied in the detecting landslides (Stumpf and Kerle, 2011; Chen et al., 2014; Chen et al., 2017). The algorithm constructs multiple decision trees on the bases of randomly chosen subsets of the training dataset (Chen et al., 2018). In a classification problem, the RF takes the advantages of high variance of each tree assigned to the respective classes in accordance with the majority votes (Stumpf and Kerle, 2011). The major advantage of this method lies in its performance in complex datasets and negligible efforts required for fine-tuning (Stumpf and Kerle, 2011). Unlike classification and regression tree where the method considered all variable in each node, RF is considered a random subset of the original set of features. The number of the variables per node can be estimated by the users using square root of the total number of variables. These two mechanisms of sampling and random
B
∑ (RbOOb − RbjOOb)
(2)
b=1
denotes the classification accuracy for OOB data ℓb where Rb using the classification model Tj; and RbOOb is the classification accuracy for OOB data RbOOb permuted the values of variable xj in ℓbOOb (j = 1, …, N). Finally, a z-score of variable xj which represents the variable Dj importance criterion could be computed using the formula zj = S B , OOb
OOb
j
after the standard deviation sj of the classification accuracy decrease is 151
Catena 167 (2018) 147–159
M.R. Mezaal, B. Pradhan
Fig. 3. (continued) Table 1 Object features used in the current study. Feature objects dominos
Features used
LiDAR derived data Visible bands Texture features
Mean and StdDev (intensity, DEM, DSM, slope, aspect, height) Mean and StdDev (red, green and blue, max. diff, and brightness) all directions,0°,45°,90°,135° (Grey-level co-occurrence matrix (GLCM) correlation, GLCM Dissimilarity, GLCM angular second moment, GLCM StdDev, GLCM Mean, GLCM Contrast, GLCM Entropy, GLCM Homogeneity, GLDV angular second moment, Grey level difference vector (GLDV) Mean, GLDV Entropy and GLDV Contrast) Area, shape, length/width, and density
Geometry features
A total of 500 trees were selected for this study and according to Stumpf and Kerle (2011), this number is considered to be a regular value for the RF classifier. To make the grow one single randomly split variable was used. The 70% of the inventory map was selected as training sets which comprise all the features and the features subsets to train the RF model. While the remaining 30% of inventory map was used for the evaluation of the classification accuracies.
variables in each node, yield dissimilar uncorrelated trees. To take care of the variability in the training data, large number of trees are required to improve the accuracy of the process of classification. When a feature is assign to a class, it considers all the trees in the forest as its vote. Then, the class will be allocated based on majority vote. In this study, the RF package (Liaw and Wiener, 2002) for the opensource statistical language R (R Development Core Team, 2013) was used. Two parameters were considered here these are: number of trees in the forest and number of variables in the random subset at each node. 152
Catena 167 (2018) 147–159
M.R. Mezaal, B. Pradhan
Start
Generate Ants
Initialize Pheromone Transition Rule
Ants
Generate New Ants
m … Evaluate Ants
Continue
Chose Next Attribute
1
Stop
Gather Selected Subsets
Terminatio n condition satisfied?
Evaluate Selected Subsets
Continue Update Pheromone
Re-tune Best Subset Fig. 4. ACO-based feature selection workflow.
5. Results and discussion
boundaries of landslide types. The separations between different types landslides (deep-seated and shallow) and non-landslides (vegetation, cut-slope, man-made and bare soil) was carried out with the aid of these optimized segmentation parameters by exploiting the spatial and textural feature. In this proposed method, it is necessary to carry out the subsequent steps in other to obtain more accurate result. Both landslide and non-landslide classes were used in the training samples to obtain optimal values of the segmentation parameters.
5.1. Results of multiresolution segmentation parameters using FbSP optimizer The multiresolution segmentation parameters (shape, scale and compactness) were optimized using FbSP optimizer. This optimizer is capable of separating different types of landslides and other types of land cover classes such as cut slope and vegetation. In this study, the values of the initial segmentation parameters trained in the FbSP optimizer in analysis area were 50, 0.1, and 0.1 for scale, shape, and compactness, respectively. The analysis begins with these three initial values and passes through three iterations cycle. The best values obtained by the FbSP optimizer were 75.52, 0.4, and 0.5 for scale, shape, and compactness, respectively and are shown in Table 2. In addition, Fig. 5 illustrates the initial and optimal segmentation process. Based on these optimized parameters, the accuracy classification can be improved faster to the highest level by demarcating the segmentation
5.2. Relevant features selected based on three algorithms (CFS, ACO and RF) Three (3) algorithms were used to select the most relevant features in the feature selection process in other to improve differentiate between landslide types (shallow and deep-seated). The three (3) feature selection algorithms applied in this research are; Correlation-based Feature selection (CFS), Random forest (RF) and Ant colony optimization (ACO). In the process, eighty-six (86) features were selected in the model to differentiate between landslide types. The features include; mean and StdDev of LiDAR derived data (DSM, DTM, slope, intensity, height and aspect) and orthophoto (red, blue, green, diff, Max. and brightness). Furthermore, texture features with all directions (GLCM Dissimilarity, Grey-level co-occurrence matrix (GLCM) correlation, GLCM angular second moment, GLCM Mean, GLCM StdDev, GLCM Entropy, GLCM Contrast, GLCM Homogeneity, Grey level difference vector (GLDV) Mean, GLDV angular second moment, GLDV Entropy and GLDV Contrast) and Geometry features (length/width, area, shape and density).
Table 2 Multi- resolution segmentation parameters. Initial parameters
Iteration (optimal parameters)
No.
Scale
Shape
Compactness
Scale
Shape
Compactness
1 2
50 80
0.1 0.1
0.1 0.1
75.52 100
0.4 0.45
0.5 0.74
153
Catena 167 (2018) 147–159
M.R. Mezaal, B. Pradhan
Fig. 5. Segmentation process using the fuzzy based segmentation parameter (FbSP optimizer) for landslide types. (A) represents the initial segmentation parameters using user selected initial segmentation parameters (first iteration) and the sub objects (red) selected to form a target object (i.e. landslide types). Whereas, (B) represents segmentation optimized achieved using the parameters estimated by FbSP optimizer. (For interpretation of the references to color in this figure legend, the reader is referred to the web version of this article.)
Additionally, the two defined algorithms (ACO and RF) were taken into consideration based on preliminary examinations (Sameen et al., 2017; Gao et al., 2015; O'Connell et al., 2015; Kumar and Reddy, 2006; Abbaspour et al., 2001). The parameters such as crossover probability, the mutation probability size, the number of generations, and the population of 0.84, 0.09, 500 and 500 respectively were used in the ACO algorithm. In the RF algorithm, the number of the trees and the number of split variables were set to 1000 and 10 respectively at 100 iterations. While the CFS work automatically and require no threshold to be predefined (Hall, 1999). It also enable integration with search strategy such as best- first search, bi-directional search etc. for more efficiency (Ladha and Deepa, 2011). Therefore, best-first search strategy was adopted in the CFS in the important feature selection, while, Statistica Trail and Weka 3.8 software and R statistical programming were used in this work. The selection of optimal combination was carried out based on many experiments in this work. The selection started from 2 to 100% of the 86 features and the optimal features were achieved after 100 iterations in every experiments. The technique proposed by Sameen et al. (2017) was implemented and showed that applying 9 features indicated the best accuracy. However, other features showed no significant effect in differentiating between landslide types. Thus, comparison between these algorithms indicated that features selection result to different ranks and different accuracies in differentiating between landslides as shown in Table 3. Consequently, the RF classifier result indicated a high differentiation accuracy of 89.28%, using the features selected from CFS method. Also, better accuracies were achieved in ACO and RF feature selection methods. But, the ACO algorithm yield better result compared with RF algorithm. The results of feature selection algorithms showed that the best combination was achieved by CFS which improved the differentiation between two types of landslides; shallow and deep-seated in the analysis area. Meanwhile, ACO and RF showed high accuracy but slightly less than the CFS. Subsequently, the CFS algorithm showed that mean slope, mean intensity, and GLCM homogeneity were the best features. While GLCM angular second moment, StdDev Red, and StdDev intensity showed the best features in RF algorithm and in ACO method, GLCM Homogeneity, ranked mean DTM and Brightness as best features. These results obtained in CFS, RF, and ACO methods indicated improved accuracy in the landslide differentiation. Conversely, the Grey level difference vector such as GLDV Entropy, GLDV Mean, and GLDV Contrast were not considered as shown in the results. These changes can be attributed to the landslide materials types in the area under consideration. Generally, selection of the most significant feature can reduce
Table 3 Important features selection through three algorithms for detecting types of landslide (i.e. shallow and deep seated landslides) at a scale of 75.52 (analysis area). Algorithm
Relevant features
Accuracy assessment
CFS
Mean intensity GLCM Homogeneity Mean slope Length/width Area GLCM StdDe Mean DTM GLCM Contrast StdDev blue GLCM angular second moment Length/width StdDev intensity GLCM Homogeneity Mean red StdDe DTM Mean Slope StdDev Height GLCM Correlation Mean DTM GLCM Homogeneity Length/width Mean intensity Mean Slope GLCM Homogeneity StdDe DSM StdDev height StdDev blue
89.28
RF
ACO
85.59
86.74
computation time, avoid the subjective requirement of expert-knowledge, eliminated the irrelevant feature, improved the classifier process and simplify the rules developed.
5.3. Supervised random forest for distinguishing shallow and deep seated landslide The random forest (RF) in the qualitative assessment results were observed to be poor and the overall accuracies in shallow and deepseated were recorded to be 70.44% and 73.54% respectively. These results were achieved when 70% of the training data set and all features were used to train the RF classifier. It was observed that misclassification exist between the types of landslide (shallow and deepseated) and several landscape objects (bare soil, man-made, and cut154
Catena 167 (2018) 147–159
M.R. Mezaal, B. Pradhan
Fig. 6. Results of supervised RF for the analysis area. The red and yellow polygons represent deep seated and shallow landslide, respectively. (For interpretation of the references to color in this figure legend, the reader is referred to the web version of this article.)
classes most especially around hilly and densely vegetated areas like Cameron Highlands. The better results achieved in the classification indicated that optimization techniques could be used in feature selection and segmentation parameters from orthophotos, very high-resolution LiDAR data, texture and geometric features can enhanced the accuracy of landslide types detection as shown in Fig. 6.
slope). On the other hand, high-quality results were achieved in the RF classifier that uses the optimal feature in the qualitative assessment and successfully differentiate between the landslides types as shown in Fig. 6. In the quantitative assessment result, the shallow landslide showed accuracy of about 87.54% using CFS method. While accuracy of 89.9% for 70% training data was recorded for the deep-seated. This enhancement can improve the quality of inventory maps and specific details like run-out can be accurately revealed. The user's accuracies result reveals the highest misclassification in the shallow compared with the deep-seated classes due to characteristics such as depth, deposit and orientation. The characteristics of deep-seated and shallow landslides in terms of size, slope, depth and run out in Cameron Highland are illustrated in Fig. 7. This will aid in differentiating between the two landslide types. The use of feature selection like very high-resolution LiDAR data, orthophoto, texture and geometric features could go a long way to aid differentiating the landslide types. There exist some misclassifications in differentiating between landslides (shallow and deep-seated) and non-landslide (cut-slope, man-made and bare-soil) due to similarities in their shape characteristics (Mezaal et al., 2017a). In addition, shadow is another issue commonly present in hilly areas (Rau et al., 2014). According to Stumpf and Kerle (2011), among different regions, important features may differ and could affect its transferability. Therefore, in other to resolve this issue, a 10-fold cross-validation approach was used and is expected to guide the accuracy of the prediction in the search (Bartels and Wei, 2010). The intensity feature resulting from LiDAR point cloud contributed to the distinguishing between shallow and deep-seated landslides. The accuracy in differentiating deep-seated landslides was observed to be higher than the shallow landslides. According to Pradhan and Mezaal (2017), the LiDAR derived data could contribute significantly in separating deep-seated landslides from other land-cover
5.4. Transferability of the relevant features Transferability is another important aspect of feature selection that was evaluated at another part of the study area refer to as (Test site). The segmentation parameters were optimized in the test site by considering all features and generalization capability of the important features were considered for transferable features. Accordingly, the full subsets of features selection were tested on another site (Test site) which result to low quality of qualitative assessment of about 70% of the inventory data. It was observed that misclassification exist between landslide types with other types of landscape (man-made, cut-slope, and bare soil). However, when optimal features selection only was applied, the overall accuracies of the RF classifier of shallow and deepseated were 86.77% and 88.59%, respectively. Although, this study reveals that the optimal scale aid in exploiting the features selection fully and simplifies its transferability classifier. Although, RF results show a declining accuracy, but, still realistic for this type of application. The decreased in the results accuracy due to several limitations such as complex terrain, characteristics of landslide types (shallow and deepseated) and an extension of the former types. Furthermore, some objects like man-made cut slope and bare soil have same characteristics with all the features aforementioned. The results of transferability model showed the importance of each feature in the high-resolution LiDAR data, textures, orthophoto, geometric features. Fig. 8 shows the 155
Catena 167 (2018) 147–159
M.R. Mezaal, B. Pradhan
Surface soil
Shallow Landslide
Bedrock
Shallow
B
A
Deep Seated Landslide C
D Deep Seated Landslide
Fig. 7. Shows [A] shallow landslide in the field (yellow polygon) [B] sketches represent shallow landslide, [C] deep seated landslide in field (red polygon) and [D] sketches of deep seated landslide in Cameron Highlands, Malaysia. (For interpretation of the references to color in this figure legend, the reader is referred to the web version of this article.)
impact of the features such as LiDAR data (intensity, slope and height), geometric features (length/width and area), spectral features (red, green and blue) and texture feature (GLCM Homogeneity) in distinguishing between the types of landslides. The over-reliance on the analyst experience and computation time is minimized in this proposed method compared with the existing complex technique. The use of classification techniques guarantees significantly improves the differentiation accuracies. Each of the various classification algorithms in existence has its own advantages and disadvantages. Therefore, the proposed supervised random forest used in this research indicated better accuracy. Moreover, optimized approach for segmentation parameters and relevant features with the aid of very high-resolution LiDAR, visible bands, texture and geometric feature contributed to the simplification in the development of the proposed method and improve the transferability model. The proposed method was developed based on analysis area and validated in another part of the study area (Test area), and high accuracy was achieved.
defining parameters of RF classifier used to differentiate between shallow and deep-seated landslides. It challenging to differentiate between landslide types (shallow and deep-seated) in densely vegetated region like Cameron Highlands due to the presence of similarity in dense vegetation, hilly areas and shadow. This research proposes a method for differentiating between landslide types by using high-resolution airborne laser scanning data (LiDAR) and features such as texture, visible band and geometric features. Also, it was revealed that optimization of the segmentation parameters like scale, shape and compactness using FbSP optimizer was satisfactory in differentiating between types of landslide and nonlandslide. Optimized segmentation parameters allows development of more accurate objects segment and uses texture, spatial and geometric features to differentiate between the classes aforementioned. Since the landslides can be classified according to their features, accurate segmentation is necessary for differentiating between the classes. The level of experience of analyst plays a vital role in the selection of relevant optimal features for landslide. Hence, it is important to create a feature selection method that distinguishes between landslides and non-landslide types. Relevant features are simplifying with the aid of ACO, RF and CFS algorithms when assessing and separating landslides between the aforementioned classes and are transferable to another site (site A). The optimized features applied to distinguish between the classes aforementioned are LiDAR-DEM data (slope, height, and intensity), texture features (GLCM StdDev and GLCM homogeneity), visible band and geometric features. The results indicate the
6. Accuracy assessment Evaluation of the training samples was carried out with 70% of the training sets with the aid of stratified random sampling approach. The training set (70%) was applied to train the RF classifier using full or relevant optimal features. The overall accuracies of the RF classifier in the analysis area in the presence of all the features were 70.44 and 73.54% for shallow and deep-seated, respectively. Also, the overall 156
Catena 167 (2018) 147–159
M.R. Mezaal, B. Pradhan
Fig. 8. Result of transferability model showing the locations of shallow and deep seated landslide in the Test site. Table 4 Results comparison based on overall accuracy for important and full features using RF classifier. Area
Analysis Test site Analysis Test site Analysis Test site Analysis Test site
Table 5 Results comparison based on user's Accuracy and producer's Accuracy for important and full features using RF classifier.
Feature
Types of landslide
Overall accuracy %
Kappa accuracy %
Area
area
Full features
Shallow
area
Relevant feature of CFS Full features
70.44 66.63 87.54 86.77 73.54 68.38 89.9 88.59
0.69 0.66 0.82 0.79 0.7 0.64 0.83 0.83
Analysis Test site Analysis Test site Analysis Test site Analysis Test site
area area
Deep seated
Relevant feature of CFS
Features
Types of landslide
User's accuracy %
Producer's accuracy %
area
Full features
Shallow
area
Relevant Features of CFS Full features
Deep seated
75.49 74.8 80.76 79.91 78.61 75.45 83.23 81.78
77.33 75.87 87.85 82.44 79.47 77.76 83.55 82.43
area area
Relevant Features of CFS
Highest values are shown in bold colour.
mentioned areas. The results clearly showed that significant features were used in the proposed model and has yielded high accuracy compared with the model that employs all the features. This finding is in agreement the observations of other authors (Mezaal and Pradhan, 2018; Li et al., 2015). Furthermore, it was observed that selection of the most important features lead to decreased dimensionality of the object feature and the classification accuracy was improved. Evaluation of the training data immensely reduced the training time and improves the transferability performance. However, the RF classifier was insensitive to the procedure of the feature selection.
accuracies (RF classifier) obtained for the Test site were 66.63% and 68.38% for shallow and deep-seated, respectively as shown in Table 4. When highest-ranking features only are used in the analysis area, the accuracies of the RF classifier increased to 87.54% and 89.90% for shallow and deep-seated landslides, respectively. The corresponding test site record accuracies of 86.77% for shallow landslide and 88.59% for a deep-seated landslide. The total number of the landslides occurrence in the analysis and test site were 43 and 61 respectively. Out of the total, 32 and 35 were shallow landslides occurred in the analysis area and Test site respectively. While the number of the deep-seated landslide were 11 and 26, for analysis area and test site respectively. The results showed high performance in respect of the two types of landslides: the numbers 30 and 31 were detected for analysis area and Test site, respectively, for shallow landslide. The number 10 out of 11 deep seated landslides were detected in the analysis area, whereas, 23 out of 26 were obtained in the Test area. Tables 5 shows the results of the user's and producer's accuracies of RF classifier along with important and full features for the aforementioned sites. The results showed that the user's and producer's accuracies of deep-seated exhibited higher accuracies for all the above-
7. Field investigation Field investigation was carried out to identify types of landslides using handheld GPS device (GeoExplorer 6000) as shown in Fig. 9 and the result was used to validate the proposed method. Information such as landslide extent, pattern, run out, deposition, source area and volume were obtained from filed measurements and are used to assess the reliability of the inventory map produced. The field investigation showed that the type of landslides are delineated using the proposed method and was accurate. Thus, it can be inferred that the current 157
Catena 167 (2018) 147–159
M.R. Mezaal, B. Pradhan
Fig. 9. Field photos showing the location of landslide during filed investigation.
method can identify landslide locations, separate landslide types, and produce a reasonable and acceptable landslide inventory map for Cameron Highlands in Malaysia.
Ardizzone, F., Cardinali, M., Galli, M., Guzzetti, F., Reichenbach, P., 2007. Identification and mapping of recent rainfall-induced landslides using elevation data collected by airborne Lidar. Nat. Hazards Earth Syst. Sci. 7 (6), 637–650. Barbarella, M., Fiani, M., Lugli, A., 2013. Application of LiDAR-derived DEM for detection of mass movements on a landslide. In: Int Arch Photogramm Remote Sens Spat Inf Sci XL (5/W3), pp. 89–98. Bartels, M., Wei, H., 2010. Threshold-free object and ground point separation in LIDAR data. Pattern Recogn. Lett. 31 (10), 1089–1099. Belgiu, M., Drǎguţ, L., 2014. Comparing supervised and unsupervised multiresolution segmentation approaches for extracting buildings from very high resolution imagery. ISPRS J. Photogramm. Remote Sens. 96, 67–75. Benz, U.C., Hofmann, P., Willhauck, G., Lingenfelder, I., Heynen, M., 2004. Multi-resolution, object-oriented fuzzy analysis of remote sensing data for GIS-ready information. ISPRS J. Photogramm. Remote Sens. 58 (3–4), 239–258. Bordoni, M., Bonì, R., Colombo, A., Lanteri, L., Meisina, C., 2018. A methodology for ground motion area detection (GMA-D) using A-DInSAR time series in landslide investigations. Catena 163, 89–110. Breiman, L., 2001. Random forests. Mach. Learn. 45 (1), 5–32. Brunetti, M., Guzzetti, F., Rossi, M., 2009. Probability distributions of landslide volumes. Nonlinear Process. Geophys. 16 (2), 179–188. Bui, D.T., Pradhan, B., Lofman, O., Revhaug, I., Dick, O.B., 2012. Landslide susceptibility mapping at Hoa Binh province (Vietnam) using an adaptive neuro-fuzzy inference system and GIS. Comput. Geosci. 45, 199–211. Cao, L.Y., Xia, L.Z., 2007, November. An ant colony optimization approach for SAR image segmentation. In: In Wavelet Analysis and Pattern Recognition, 2007. ICWAPR'07. International Conference on. Vol. 1. IEEE, pp. 296–300. Chen, W., Li, X., Wang, Y., Chen, G., Liu, S., 2014. Forested landslide detection using LiDAR data and the random forest algorithm: a case study of the Three Gorges, China. Remote Sens. Environ. 152, 291–301. Chen, R.F., Lin, C.W., Chen, Y.H., He, T.C., Fei, L.Y., 2015. Detecting and characterizing active thrust fault and deep-seated landslides in dense forest areas of southern Taiwan using airborne LiDAR DEM. Remote Sens. 7 (11), 15443–15466. Chen, T., Trinder, J.C., Niu, R., 2017. Object-oriented landslide mapping using ZY-3 satellite imagery, random forest and mathematical morphology, for the Three-Gorges Reservoir, China. Remote Sens. 9 (4), 333. Chen, W., Xie, X., Peng, J., Shahabi, H., Hong, H., Bui, D.T., Zhu, A.X., 2018. GIS-based landslide susceptibility evaluation using a novel hybrid integration approach of bivariate statistical based random forest method. Catena 164, 135–149. Deng, S., Shi, W., 2014. Semi-automatic approach for identifying locations of shallow debris slides/flows based on Lidar-derived morphological features. Int. J. Remote Sens. 35 (10), 3741–3763. Dorigo, M., Stützle, T., 2010. Ant colony optimization: overview and recent advances. In: Handbook of Metaheuristics. Springer, US, pp. 227–263. Dou, J., Chang, K.T., Chen, S., Yunus, A.P., Liu, J.K., Xia, H., Zhu, Z., 2015. Automatic case-based reasoning approach for landslide detection: integration of object-oriented image analysis and a genetic algorithm. Remote Sens. 7 (4), 4318–4342. Drǎguţ, L., Tiede, D., Levick, S.R., 2010. ESP: a tool to estimate scale parameter for
8. Conclusion The proposed method employs three feature selection techniques within the object-based method to improve the identification process between shallow and deep-seated landslide types in Cameron Highland Malaysia. The research was carried out using very high-resolution airborne laser scanning data and the optimized parameters of multiresolution segmentation enhance the overall accuracy of the system. These factors improve the accuracy of delineated boundaries of landslide types. The feature selection methods adopted enhances the accuracy of the classification significantly, reduced the computational time and enhances transferability. The high accuracy recorded is due to the CFS used in the important features selection. It was discovered that orthophoto, high-resolution LiDAR data, geometric and texture features improve the differentiation between shallow and deep-seated landslides. Also, the transferability reveals that features selection with CFS and supervised approach based on RF classifier give reliable results with improve cost-effectiveness and efficiency in the developed landslide inventory maps. The improvement in the accuracies of differentiation the landslide types showed that it can be used as a valid inventory map to be used in planning and disaster management policies in urban areas. References Abbaspour, K.C., Schulin, R., Van Genuchten, M.T., 2001. Estimating unsaturated soil hydraulic parameters using ant colony optimization. Adv. Water Resour. 24 (8), 827–841. Akçay, H.G., Aksoy, S., 2008. Automatic detection of geospatial objects using multiple hierarchical segmentations. IEEE Trans. Geosci. Remote Sens. 46 (7), 2097–2111. Alwan, H.B., Ku-Mahamud, K.R., 2012, December. Optimizing support vector machine parameters using continuous ant colony optimization. In: Computing and Convergence Technology (ICCCT), 2012 7th International Conference on. IEEE, pp. 164–169.
158
Catena 167 (2018) 147–159
M.R. Mezaal, B. Pradhan
2017.1401013. Miner, A., Flentje, P., Mazengarb, C., Windle, D., 2010. Landslide Recognition using LiDAR derived Digital Elevation Classifiers-Lessons Learnt From Selected Australian Examples. pp. 1–9. Navulur, K., 2006. Multispectral Image Analysis Using the Object-oriented Paradigm. CRC Press. O'Connell, J., Bradter, U., Benton, T.G., 2015. Wide-area mapping of small-scale features in agricultural landscapes using airborne remote sensing. ISPRS J. Photogramm. Remote Sens. 109, 165–177. Olaya, V., 2009. Basic land-surface parameters. Dev. Soil Sci. 33, 141–169. Pal, M., Foody, G.M., 2010. Feature selection for classification of hyperspectral data by SVM. IEEE Trans. Geosci. Remote Sens. 48 (5), 2297–2307. Parpinelli, R.S., Lopes, H.S., Freitas, A.A., 2002. Data mining with an ant colony optimization algorithm. IEEE Trans. Evol. Comput. 6 (4), 321–332. Passalacqua, P., Tarolli, P., Foufoula-Georgiou, E., 2010. Testing space-scale methodologies for automatic geomorphic feature extraction from lidar in a complex mountainous landscape. Water Resour. Res. 46 (11). Pourghasemi, H.R., Moradi, H.R., Aghda, S.F., Gokceoglu, C., Pradhan, B., 2014. GISbased landslide susceptibility mapping with probabilistic likelihood ratio and spatial multi-criteria evaluation classifiers (North of Tehran, Iran). Arab. J. Geosci. 7 (5), 1857–1878. Pradhan, B., 2013. A comparative study on the predictive ability of the decision tree, support vector machine and neuro-fuzzy classifiers in landslide susceptibility mapping using GIS. Comput. Geosci. 51, 350–365. Pradhan, B., Lee, S., 2010. Regional landslide susceptibility analysis using back-propagation neural network classifier at Cameron Highland, Malaysia. Landslides 7 (1), 13–30. Pradhan, B., Mezaal, M.R., 2017. Optimized rule sets for automatic landslide characteristic detection in a highly vegetated forests. In: Laser Scanning Applications in Landslide Assessment. Springer International Publishing, pp. 51–68. Pradhan, B., Jebur, M.N., Shafri, H.Z.M., Tehrany, M.S., 2016. Data fusion technique using wavelet transform and Taguchi methods for automatic landslide detection from airborne laser scanning data and QuickBird satellite imagery. IEEE Trans. Geosci. Remote Sens. 54 (3), 1610–1622. Rau, J.Y., Chang, K.T., Shao, Y.C., Lau, C.C., 2012. Semi-automatic shallow landslide detection by the integration of airborne imagery and laser scanning data. Nat. Hazards 61 (2), 469–480. Rau, J.Y., Jhan, J.P., Rau, R.J., 2014. Semiautomatic object-oriented landslide recognition scheme from multisensor optical imagery and DEM. IEEE Trans. Geosci. Remote Sens. 52 (2), 1336–1349. Sameen, M.I., Pradhan, B., 2017. A novel road segmentation technique from orthophotos using deep convolutional autoencoders. Korean J. Remote Sens. 33 (4), 423–436. http://dx.doi.org/10.7780/kjrs.2017.33.4.8. Sameen, M.I., Pradhan, B., Shafri, H.Z., Mezaal, M.R., bin Hamid, H., 2017. Integration of ant colony optimization and object-based analysis for LiDAR data classification. IEEE J. Sel. Top. Appl. Earth Obs. Remote Sens. 10 (5), 2055–2066. Schulz, W.H., 2007. Landslide susceptibility revealed by LIDAR imagery and historical records, Seattle, Washington. Eng. Geol. 89 (1), 67–87. Stumpf, A., Kerle, N., 2011. Object-oriented mapping of landslides using random forests. Remote Sens. Environ. 115 (10), 2564–2577. Tarolli, P., Arrowsmith, J.R., Vivoni, E.R., 2009. Understanding earth surface processes from remotely sensed digital terrain classifiers. Geomorphology 113 (1), 1–3. Team, R.C., 2013. R: A language and environment for statistical computing. Van Den Eeckhaut, M., Poesen, J., Verstraeten, G., Vanacker, V., Moeyersons, J., Nyssen, J., Van Beek, L.P.H., 2005. The effectiveness of hillshade maps and expert knowledge in mapping old deep-seated landslides. Geomorphology 67 (3), 351–363. Van Westen, C.J., Castellanos, E., Kuriakose, S.L., 2008. Spatial data for landslide susceptibility, hazard, and vulnerability assessment: an overview. Eng. Geol. 102 (3), 112–131. Verikas, A., Gelzinis, A., Bacauskiene, M., 2011. Mining data with random forests: a survey and results of new tests. Pattern Recogn. 44 (2), 330–349. Zêzere, J.L., Trigo, R.M., Trigo, I.F., 2005. Shallow and deep landslides induced by rainfall in the Lisbon region (Portugal): assessment of relationships with the North Atlantic oscillation. Nat. Hazards Earth Syst. Sci. 5 (3), 331–344. Zhang, Y., Maxwell, T., Tong, H., Dey, V., 2010. Development of a supervised software tool for automated determination of optimal segmentation parameters for ecognition. Eng. Remote Sens. 5–7 (na).
multiresolution image segmentation of remotely sensed data. Int. J. Geogr. Inf. Sci. 24 (6), 859–871. Duro, D.C., Franklin, S.E., Dubé, M.G., 2012. Multi-scale object-based image analysis and feature selection of multi-sensor earth observation imagery using random forests. Int. J. Remote Sens. 33 (14), 4502–4526. Fanos, A.M., Pradhan, B., 2018. Laser scanning systems and techniques in rockfall source identification and risk assessment: a critical review. Earth Syst. Environ. 1–20. http:// dx.doi.org/10.1007/s41748-018-0046-x. Gao, T., Zhu, J., Zheng, X., Shang, G., Huang, L., Wu, S., 2015. Mapping spatial distribution of larch plantations from multi-seasonal Landsat-8 OLI imagery and multiscale textures using random forests. Remote Sens. 7 (2), 1702–1720. Genuer, R., Poggi, J.M., Tuleau-Malot, C., 2010. Variable selection using random forests. Pattern Recognit Lett. 31 (14), 2225–2236. Guzzetti, F., Mondini, A.C., Cardinali, M., Fiorucci, F., Santangelo, M., Chang, K.-T., 2012. Landslide inventory maps: new tools for an old problem. Earth Sci. Rev. 112 (1), 42–66. Hall, M.A., 1999. Correlation-based Feature Selection for Machine Learning (Doctoral dissertation). The University of Waikato. Hall, M.A., Holmes, G., 2003. Benchmarking attribute selection techniques for discrete class data mining. IEEE Trans. Knowl. Data Eng. 15 (6), 1437–1447. Hong, H., Liu, J., Bui, D.T., Pradhan, B., Acharya, T.D., Pham, B.T., Ahmad, B.B., 2018. Landslide susceptibility mapping using J48 decision tree with AdaBoost, bagging and rotation forest ensembles in the Guangchang area (China). Catena 163, 399–413. Imani, M.B., Pourhabibi, T., Keyvanpour, M.R., Azmi, R., 2012. A new feature selection method based on ant colony and genetic algorithm on Persian font recognition. IJMLC 2 (3), 278. Kasai, M., Ikeda, M., Asahina, T., Fujisawa, K., 2009. LiDAR-derived DEM evaluation of deep-seated landslides in a steep and rocky region of Japan. Geomorphology 113 (1), 57–69. Kumar, D.N., Reddy, M.J., 2006. Ant colony optimization for multi-purpose reservoir operation. Water Resour. Manag. 20 (6), 879–898. Kursa, M.B., Rudnicki, W.R., 2010. Feature Selection with the Boruta Package: Journal. Ladha, L., Deepa, T., 2011. Feature selection methods and algorithms. Int. J. Comput. Sci. Eng. 1 (3), 1787–1797. Laliberte, A.S., Fredrickson, E.L., Rango, A., 2007. Combining decisiontrees with hierarchical object-oriented image analysis for mapping aridrangelands. Photogramm Eng Remote Sens. 73 (2), 197–207. Lashermes, B., Foufoula‐Georgiou, E., Dietrich, W.E., 2007. Channel network extraction from high resolution topography using wavelets. Geophys. Res. Lett. 34 (23). Li, L.L., Wang, J.K., 2012, October. SAR image ship detection based on ant colony optimization. In: Image and Signal Processing (CISP), 2012 5th International Congress on. IEEE, pp. 1100–1103. Li, X., Cheng, X., Chen, W., Chen, G., Liu, S., 2015. Identification of forested landslides using LiDar data, object-based image analysis, and machine learning algorithms. Remote Sens. 7 (8), 9705–9726. Liaw, A., Wiener, M., 2002. Classification and regression by Random Forest. R news 2 (3), 18–22. Lin, C.-W., Tseng, C.-M., Tseng, Y.H., Fei, L.Y., Hsieh, Y.C., Tarolli, P., 2013. Recognition of large scale deep-seated landslides in forest areas of Taiwan using high resolution topography. J. Asian Earth Sci. 62, 389–400. Ma, H.-R., Cheng, X., Chen, L., Zhang, H., Xiong, H., 2016. Automatic identification of shallow landslides based on Worldview2 remote sensing images. J. Appl. Remote. Sens. 10 (1) (016008–016008). Martha, T.R., Kerle, N., Van Westen, C.J., Jetten, V., Kumar, K.V., 2011. Segment optimization and data-driven thresholding for knowledge-based landslide detection by object-based image analysis. IEEE Trans. Geosci. Remote Sens. 49 (12), 4928–4943. McKean, J., Roering, J., 2004. Objective landslide detection and surface morphology mapping using high-resolution airborne laser altimetry. Geomorphology 57 (3), 331–351. Mezaal, M.R., Pradhan, B., 2018. Data mining-aided automatic landslide detection using airborne laser scanning data in densely forested tropical areas. Korean J. Remote Sens. 34 (1), 45–74. Mezaal, M.R., Pradhan, B., Sameen, M.I., Mohd Shafri, H.Z., Yusoff, Z.M., 2017a. Optimized neural architecture for automatic landslide detection from high-resolution airborne laser scanning data. Appl. Sci. 7 (7), 730. Mezaal, M.R., Pradhan, B., Shafri, H.Z.M., Yusoff, Z.M., 2017b. Automatic landslide detection using Dempster–Shafer theory from LiDAR-derived data and orthophotos. Geomat. Nat. Haz. Risk 8 (2), 1935–1954. http://dx.doi.org/10.1080/19475705.
159