ISSN 1330-3651 (Print), ISSN 1848-6339 (Online)
https://doi.org/10.17559/TV-20160908115834 Original scientific paper
An Improved Method for Calculating Bending Moment and Shearing Force of Beam in Numerical Modelling Haiping YUAN, Zhanqi WANG, Yixian WANG, Panpan GUO, Yan LIU Abstract: In view of the problem that it is difficult to obtain the displacement, internal force and damage status from one beam model established in most numerical analysis models, an improved method for calculating bending moment and shearing force is presented in this paper, which can change this situation. This method portrays how to obtain the internal force from model established using 3-D solid element which can be able to show the failure process easily. The research results are as follows: (1) Deflection equation of beam established using 3-D solid element can be fitted by extracting displacement value of each node on the axis, thus bending moment and shearing force value can be directly figured out by putting the equation of deflection curve into approximately differential equation of deflection curve. (2) The reliability of the results calculated in this method would be easily affected by force, shape of cross section and the highest degree of polynomial, etc. When the beam is in a state of small deformation and the highest degree of polynomial is kept between 20 and 30, the results will be more reliable, besides, beam model whose shape of the cross section is rectangular is more suitable for the method than the circular one. (3) This method can always be applied to beam model, no matter its constraint conditions and loading conditions are complex or not. Keywords: deflection; internal force; beam; numerical analysis software; 3-D solid element
1
INTRODUCTION
F
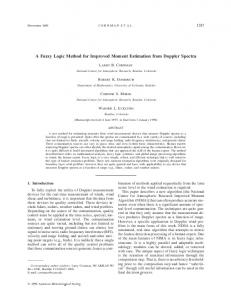
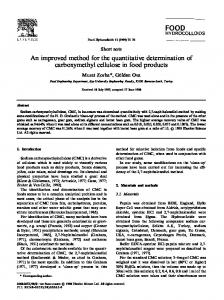
Numerical analysis pieces of software (NASs) have been widely used to design various engineering structures and solve different engineering problems [1-6]. Although it brings us great convenience, shortcomings are also disturbing us at the same time. There are two ways to simulate straight beam with constant cross section (SBWCCS) in NASs, one is to use the built-in structural element (Fig. 1b), available in many NASs and the other is to use the 3-D solid element (Fig.1a). It is well known that the beam model, established using structural element, is composed of several straight line segments with same symmetric cross section as shown in Fig. 1b. The bending moment and shearing force of structural element beam model can be directly extracted from the nodes which are located at both ends of every straight line segment, but there is no method to show its damage status (Fig. 2). However, the result of using 3-D solid element is quite the contrary, it easily shows failure process not internal force.
(a) 3-D solid beam model
compression failure
tensile failure Figure 2 Failure state of beam under load
Scholars concerned have made a very limited exploration on how to get the damage status and internal force from one beam model which was established using 3-D solid element. Some researchers mainly focused on studying the properties [7] and design methods [8] of cross section of reinforced concrete structures, such as beams. And some other researchers mainly devoted themselves to studying the response [9-14] of the beams, consisting of different materials, under special load and their fatigue behavior [15], etc. In addition, some scholars have put forward some methods, based on the displacement monitoring, that can be good for obtaining the internal force of different engineering structures [16], and someone even proposed a new finite element model of beam [17]. Although beams have been deeply studied, scholars always concentrate more on special beams, such as concrete-filled steel plate composite coupling beams [18], tapered thin-walled box beams [19], steel–concrete composite beams [20] and corbels [21], rather than SBWCCS. Therefore, an in-depth study of SBWCCS seems very necessary and helpful in a sense. In this paper, a calculation theory, a method, was discussed and its feasibility verified for calculating bending moment and shearing force of SBWCCS. 2
(b) structural element beam model Figure 1 Two ways of establishing beam model 368
CALCULATION THEORY
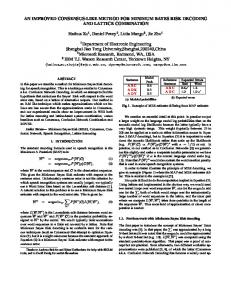
Beam will become curved or deformed under the action of load (Fig. 3). Its internal stress shows tension on the one side and compression on the other side. In many finite-difference and finite element pieces of software Technical Gazette 25, 2(2018), 368-375
Haiping YUAN et al.: An Improved Method for Calculating Bending Moment and Shearing Force of Beam in Numerical Modelling
commonly used, the beams can be modeled using their built-in structural element and figured out the bending moment and shearing force of any cross section, but they are unable to show their failure phenomenon and its evolution process. On the contrary, it is easy to change this situation by using 3-D solid element for building beam models. Even though it is unable to directly get the internal force of a beam modeled using 3-D solid element in most of the NASs, a calculation theory, from the mechanics of materials, is very helpful to solve this problem. The theory is discussed in detail as follows. θ(corner)
y
B
A
θ
C
3.1 Model Consideration Under the action of load, the deformation degree and damage status of beam are closely related not only to the form of load but also to the shape of cross section. Based on seriously considering both aspects, 6 kinds of sizes of beams are given in Tab. 1 for choosing to establish models using 3-D solid element and analyze their response under loads. Model number 1 2 3
w(deflection)
h yz x
In the mechanics of materials, the deformed axis of
the beam under load was called deflection curve. Under the condition of small deformation, the relationship between deflection and internal force can be expressed as Eq. (1) which was called approximate differential equation of the deflection curve shown as follows:
EIw′′ = − M (x) EIw′′′ = −Q(x)
(1)
where EI represents the bending stiffness of beam, w'' and w''' are the second and third derivative of the equation of deflection curve (w=f(x)), M(x) and Q(x) are the equations of bending moment and shearing force. With many advantages in terms of calculation, polynomial has always been considered as one of the best approximation tools, therefore the equation of deflection curve can be fitted into polynomial form like Eq.(2).
b
∑ ai xi
(n ≥ 5)
(2)
i =1
where w is the deflection, a0 represents constant term and ai are the coefficients of the polynomial (i = 1, 2, 3…). As we know, it is easy to acquire displacement values of each node on the axis of a beam model built using 3-D solid element. Then the equation of deflection curve can be fitted into polynomial form through those data by using mathematical software, such as MATLAB, or other mathematical ways. According to Eq. (1), if the equation of deflection curve is given, bending moment M(x) and shearing force Q(x) will be deservedly figured out. 3
FEASIBILITY ANALYSIS OF THE CALCULATION THEORY
In order to verify the feasibility and reliability of the theory, simply supported beams and beams with fixed ends, under the action of load, were modeled and analyzed.
Tehnički vjesnik 25, 2(2018), 368-375
l
z y
x
l
d
In the meanwhile, the corresponding models should be established using structural element and analyzed as comparison. The NAS used is FLAC3D in this paper and parameters of properties assigned to the models, without considering the influence of gravity, are from C30 concrete. In the actual project, beams generally bear vertical continuous distribution loads including the uniform and non-uniform ones, therefore only continuous distribution loads were considered in the process of analysis. The mechanical parameters are listed in Tab. 2. Density (kg/m³) 2280
w = a0 +
Size of beam l(m) d(m) 7 0.6 7 0.5 7 0.4
x
Figure 3 deflection and rotation of beam under load
n
Table 1 Size of different models Size of beam Model number l(m) b(m) h(m) 7 0.6 0.6 4 7 0.5 0.6 5 7 0.4 0.6 6
Table 2 Mechanical parameters Elastic Internal Poisson's Cohesion modulus friction ratio (kPa) (GPa) angle (°) 0.24 35 1000 32
Tensile strength (MPa) 2.01
In this paper, the values of deflection, bending moment and shearing force of the models established using 3-D solid element, calculated by means of the method described in Section 2 were called fitted value. By contrast, values from models established using structural element were called theoretical value. 3.2 Simply Supported Beam under Loads As mentioned previously, the form of load and the shape of cross section would affect the deformation degree and damage status of beam, so application of the method (calculation theory) would be inevitably affected by these factors. Besides, it would be also affected by the accuracy of fitting polynomial (the equation of deflection curve). In order to study the influence of varied loading on theoretical applicability mentioned above, model 1 which was established using both 3-D solid element and structural element is taken as an example to be analyzed. In the example, both ends of the model 1 are constrained by hinge support in NAS and its size is shown in Tab. 1. In addition, three kinds of loads with different forms as 369
Haiping YUAN et al.: An Improved Method for Calculating Bending Moment and Shearing Force of Beam in Numerical Modelling
shown in Fig. 4 were applied on the model. It is important to note that three projects (Pro1, Pro2 and Pro3) were built in the example and each project analyzed the response of model 1 only under one kind of the loads with different forms. The deflection, bending moment, and shearing force of model 1 under loads with different forms are shown in Fig. 5 in which there are two kinds of curves; one describes theoretical value, of every cross-section, named T-Pro and the other describes fitting value named F-Pro. As shown in Fig. 5a, every curve of theoretical value has a corresponding curve of fitting value which was fitted by mathematical software using displacement values extracted from the nodes on the axis of the model. The highest degree of polynomial fitted is 20 times. As shown in Fig. 5b and 5c, every fitting curve was the second or third derivation of the deflection curve. It is shown that no matter what kind of distributed load the model was subjected to, the theoretical value of the deflection, bending moment and shear force of the model is nearly the same as fitting value, and the fitting effect is good. Under the action of load mentioned in Fig. 4, model 1 has been in a state of small deformation. If the model x (m)
-0.002 -0.003 -0.004 -0.005
h z
(a) Pro1
x q=-20x/b N/m2
h z
(b) Pro2
x q=-70×[1+sin(2πx/l)] /b N/m2
h z
(c) Pro3
x
l Figure 4 Loads that model 1 is subjected to
0
x (m)
0 1 2 3 4 5 6 7 0.3
-0.1
shearing force (kN)
deflection (mm)
-0.001
q=-490/(b×l) N/m2
x (m)
0 1 2 3 4 5 6 7
bending moment (kN▪m)
0
has a serious damage or most part is in the plastic state, the calculation theory will be no longer applicable.
-0.2 -0.3
0 1 2 3 4 5 6 7
0.2 0.1 0
-0.1
-0.4
-0.2
14
12
12
10 8
Pro1 Pro2 Pro3
6 4 2 0
0 1 2 3 4 5 6 7
x (m)
10
Pro1 Pro2 Pro3
8 6 4 2 0
0 1 2 3 4 5 6 7
x (m)
shearing force error (%)
14
bending moment error (%)
deflection error (%)
-0.006 -0.3 -0.5 T-Pro1 F-Pro1 T-Pro1 F-Pro1 T-Pro1 F-Pro1 T-Pro2 F-Pro2 T-Pro2 F-Pro2 T-Pro2 F-Pro2 T-Pro3 F-Pro3 T-Pro3 F-Pro3 T-Pro3 F-Pro3 (a) (b) (c) Figure 5 Deflection, bending moment and shearing force of model 1 under loads with different forms 30 27 24 21 18 15 12 9 6 3 0
Pro1 Pro2 Pro3
0 1 2 3 4 5 6 7
x (m)
(a) (b) (c) Figure 6 Deflection, bending moment and shearing force error of model 1 under loads with different forms
As shown in Fig. 6, the relative error between fitted and theoretical value was analyzed. The formula of relative error is as follows:
er =
370
x-x* x
(3)
where er is absolute value of relative error, x is theoretical value (true value), x* is fitted value (measured value). According to Eq. (3), the relative error approaches infinity while x is 0 where we call it flawed point. In order to accurately illustrate relative error, flawed points were omitted in all error diagrams of this paper. As shown in Fig. 6, the relative errors of deflection, bending moment and shearing force are very small, and most of them Technical Gazette 25, 2(2018), 368-375
Haiping YUAN et al.: An Improved Method for Calculating Bending Moment and Shearing Force of Beam in Numerical Modelling
remain below 10%, only ends and places near flawed point are bigger ones, but the fitting effect is satisfactory. It is shown that it is reliable to calculate the bending moment and the shear force of the model by using the calculation theory when the model was under the action of continuous distributed loads. It is undeniable that polynomial fitting of the deflection curve is directly related to reliability of the bending moment and shearing force, and whether polynomial fitting is good or bad depends on the highest degree of the polynomial. The following is that the beam under linear distributed load was taken as an example to study to determine the highest degree of polynomial. Fig. 7 presents the fitting curves of deflection, bending moment and shearing force of the simply supported beam (model 1) under linear distributed load as shown in Fig. 4a. Here the highest degrees of fitting deflection polynomials are 5, 20, 30 and 50, respectively. The x (m)
-0.002 -0.003 -0.004 -0.005
0
x (m)
0 1 2 3 4 5 6 7
-0.05 -0.1 -0.15 -0.2
theory n=5 n=20 n=30 n=50
-0.25 -0.3 -0.35
0.3
shearing force (kN)
theory n=5 n=20 n=30 n=50
-0.001
deflection (mm)
x (m)
0 1 2 3 4 5 6 7
bending moment (kN▪m)
0
corresponding error curves are shown in Fig. 8. It can be seen that only fitting polynomial with the appropriate highest degree can make the error in a relatively small range. If the highest degree is too large or too small, it cannot accurately reflect the true situation. For deflection, if fitting degree is less than 5, the error is large. And with the increase of fitting degree, errors gradually reduce. Except partial distortion, the others tend to be close to the real values. When the fitting degree is more than 30, although the fitting value of deflection is good, the error of bending moment and shearing force (derivative of the equation of deflection curve) is larger, especially at the end of the beam. It was verified that if fitting degree keeps between 20 and 30, the fitting errors of the deflection, bending moment and shear force are in the range of 0 - 15% except partial distortion at two ends of the curve and the fitted values can meet the requirements for computational analysis instead of real values.
0.2 0.1 0 -0.1
theory n=5 n=20 n=30 n=50
-0.2
-0.4 -0.45
-0.006
0 1 2 3 4 5 6 7
-0.3
(a) (b) (c) Figure 7 Deflection, bending moment and shearing force of model 1 under uniformly distributed load
n=5 n=20 n=30 n=50
4 2 0
0 1 2 3 4 5 6 7
x (m)
n=5 n=20 n=30 n=50
16 14 12 10 8 6 4 2 0
25
shearing force error (%)
6
18
bending moment error (%)
deflection error (%)
8
30
20
10
20 15 10 5 0
0 1 2 3 4 5 6 7
x (m)
n=5 n=20 n=30 n=50
0 1 2 3 4 5 6 7
x (m)
(a) (b) (c) Figure 8 Deflection, bending moment and shearing force error of model 1 under uniformly distributed load
The deflection, bending moment and shearing force of the beam under linear distributed load are not only related to the form of force and the highest degree of polynomial fitted, but also to the shape of cross section. By taking a beam under uniform load as an example, the influence of the cross section on the calculation theory is studied. Fig. 9 presents fitting curves and theoretical curves of the deflection, bending moment and shearing force of the simply supported beams (model 1 to model 6) under uniformly distributed load, and the highest degree of deflection polynomial is 20. The corresponding error curves are shown in Fig. 10. It must be pointed out that model 1, model 2 and model 3 are beams with rectangular section and model 4, model 5 and model 6 are beams with Tehnički vjesnik 25, 2(2018), 368-375
circular section (actually 24-regular-polygon). Sizes of the models are shown in Table 1. It can obviously be seen that the deflection curve of beam with rectangular section essentially coincides with the theoretical curve, the relative error is generally less than 5%. The fitted values of bending moment and shearing force are also very close to theoretical values, respectively bending error is less than 5% and shear error less than 10%, and the fitting effect is satisfactory. But for the beam of circular section, the fitting values of the deflection, bending moment and shear force greatly differ from theoretical values and the error is larger than that of the beam with rectangular section. The fitting effect is worse than the beam with rectangular section, but it can qualitatively reflect the 371
Haiping YUAN et al.: An Improved Method for Calculating Bending Moment and Shearing Force of Beam in Numerical Modelling
change of the deflection, bending moment and shearing force. It can be known that the beam with rectangular section is better than the one with circular section. Actually in real life, the beams with rectangular section are also in majority. In terms of beam with rectangular section, if the span of beam remains the same, the width-depth ratio (b/h) of
-0.02 -0.03 -0.04
0 -0.1 -0.2 -0.3
x (m)
0.3
0 1 2 3 4 5 6 7
0.2 0.1 0
-0.1
-0.4
-0.2
-0.5
-0.3 theory model1 theory model1 model2 model3 model2 model3 model4 model5 model4 model5 -0.06 model6 model6 (a) (b) (c) Figure 9 Deflection, bending moment and shearing force of models (model 1 to model 6) under uniformly distributed load
-0.05
50 40 35 30 25
model1 model2 model3 model4 model5 model6
20 15 10 5 0
50
30
bending moment error (%)
deflection error (%)
45
45
model1 model2 model3 model4 model5 model6
25 20 15
shearing force error (%)
deflection (mm)
-0.01
x (m)
0 1 2 3 4 5 6 7
shearing force (kN)
0
theory1 model1 theory2 model2 theory3 model3 theory4 model4 theory5 model5 theory6 model6
bending moment (kN▪m)
x (m)
0 1 2 3 4 5 6 7
cross section would affect the application of the calculation theory. Fig. 9 shows the errors of deflection, bending moment and shearing force in model 1 are smaller than those in model 2. It indicates that the widthdepth ratio of cross section only has little effect on application of the calculation theory. So it does not affect its application in the numerical simulation.
10 5 0
0 1 2 3 4 5 6 7
x (m)
40 35 30 25 20 15 10 5 0
0 1 2 3 4 5 6 7
x (m)
model1 model2 model3 model4 model5 model6
0 1 2 3 4 5 6 7
x (m)
(a) (b) (c) Figure 10 Deflection, bending moment and shearing force error of models (model 1 to model 6) under uniformly distributed load
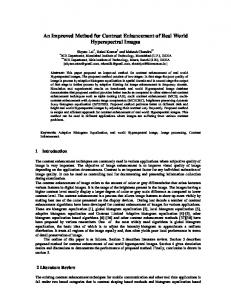
3.3 Beam with Fixed Ends under Complicated Loads For a simply supported beam under linear distributed load, although the calculation theory used to calculate internal force and deflection is of great reliability, boundary restriction conditions and loading conditions in this case are relatively simple. However, in practical engineering the beams are always in such state that boundary restriction conditions are variable (including fixed constraints, simple constraints and sliding constraints, etc.) and loading conditions are complicated (force types may be uniform load or complex linear load and the direction may be single way or double ways, etc). Therefore, further study on the calculation theory is needed. As a matter of fact, no matter how variable boundary restriction conditions are or how complicated loading conditions are, the calculation theory still has great reliability. The following is that the beam with fixed ends under multi-directional loads was taken as an example to further validate this conclusion. In NAS, beam model 1, model 2 and model 3 are respectively established using 3-D solid element and 372
structural element. In these models boundary restriction conditions are fixed constraints, besides, multi-periodic sine distribution loads were exerted along both the y-axis direction and z-axis direction as shown in Fig. 11.
Figure 11 Loads that beam with fixed ends is subjected to
Technical Gazette 25, 2(2018), 368-375
Yuan HAIPING et al.: An Improved Method for Calculating Bending Moment and Shearing Force of Beam in Numerical Modelling
x (m)
x (m)
0 1 2 3 4 5 6 7
0 1 2 3 4 5 6 7
0.3
0.3 0.2
-0.001 -0.0015
Qz (kN)
0.2
-0.0005
My (kN▪m)
0.1 0
-0.002 theory1 theory2 theory3
model1 model2 model3
-0.3
-0.2
theory1 theory2 theory3
0.3
theory1 theory2 theory3
-0.002 -0.003
model1 model2 model3
x (m)
0 1 2 3 4 5 6 7
0.3
0 1 2 3 4 5 6 7
0.2
0.2
Mz (kN▪m)
y-deflection (mm)
model1 model2 model3
x (m)
0 1 2 3 4 5 6 7
-0.001
-0.004
0
-0.2
x (m) 0
0.1
-0.1
-0.1
0.1
Qy (kN)
z-deflection (mm)
0
x (m) 0 1 2 3 4 5 6 7
0 -0.1
0.1 0 -0.1 -0.2
-0.3 theory1 model1 theory1 model1 theory2 theory2 model2 model2 theory3 model3 theory3 model3 Figure 12 Deflection, bending moment and shearing force of models under multi-periodic sine distribution loads theory1 theory2 theory3
-0.2
model1 model2 model3
30
10
15 10
0 0 1 2 3 4 5 6 7
25
25
15 10
Mz error (%)
30
20
20 15
0
0
0 1 2 3 4 5 6 7
x (m)
50 45
model1 model2 model3
10
0
x (m)
25
0 1 2 3 4 5 6 7
15
5
model1 model2 model3
5
20
5
0 1 2 3 4 5 6 7
30
x (m)
30 model1 model2 model3
35
10
5
5
x (m)
y-deflection error (%)
40
Qz error (%)
15
20
45
40 35
Qy error (%)
z-deflection error (%)
20
model1 model2 model3
25
My error (%)
model1 model2 model3
25
0
50
30
30
model1 model2 model3
25 20 15 10 5
0 1 2 3 4 5 6 7
x (m)
0
0 1 2 3 4 5 6 7
x (m)
Figure 13 Deflection, bending moment and shearing force error of models under multi-periodic sine distribution loads
For beam established using structural element, deflection, bending moment and shearing force of the Tehnički vjesnik 25, 2(2018), 368-375
model can be extracted directly from the software. For beam established using 3-D solid element, the deflection 373
Yuan HAIPING et al.: An Improved Method for Calculating Bending Moment and Shearing Force of Beam in Numerical Modelling
value of each node on the axis can be extracted from the software, then bending moment and shearing force can be easily calculated according to this calculation theory. The theoretical values and the fitted values obtained by the two methods are shown in Fig. 12, and the corresponding errors are shown in Fig. 13. It can be observed that deflection, fitted values of bending moment and shearing force are reliable by using this calculation theory. Although the error is a little larger under complicated conditions, those values are less than 20%. In general, fitting effect is good and it has important significance for the qualitative analysis of actual problems. 4
CONCLUSION
This paper presents an improved method (calculation theory) to calculate the deflection, internal force and failure process of the beam. Some conclusions are drawn as follows: 1) Deflection equation of beam established using 3-D solid element can be fitted by extracting displacement value of each node on the axis, thus bending moment and shearing force value can be directly figured out by putting the equation of deflection curve into approximate differential equation of deflection curve. The errors of fitted values are small. Nearly all fitting errors of deflection and bending moment are below 10% and shearing force errors are bigger by contrast. 2) The reliability of the results calculated using this method would be easily affected by force, shape of cross section and the highest number of polynomial, etc. When the beam is in a state of small deformation and the highest degree of polynomial is kept between 20 and 30, the results will be more reliable. Besides, beam model whose shape of the cross section is rectangular is more suitable for the method than the circular one. 3) This method can always be applied to beam model, no matter its constraint conditions and loading conditions are complex or not. Acknowledgments This research work was funded by the Open Research Fund Program of Hunan Province Key Laboratory of Safe Mining Techniques of Coal Mines, Hunan University of Science and Technology (No. 201505), the National Natural Science Foundation of China (No. 51004007, No. 51304057), the Opening Project of State Key Laboratory of Explosion Science and Technology, Beijing Institute of Technology (KFJJ17-12M), the Fundamental Research Funds for the Hefei key project construction administration (No. 2013CGAZ0771) and the Fundamental Research Funds of the Housing and Construction Department of Anhui Province (2013YF27). 5
REFERENCES
[1] Yin, X. Q., Li, J. B., Wu C. L., et al. (2013). ANSYS implementation of damping solvent stepwise extraction method for nonlinear seismic analysis of large 3-D
374
structures. Soil Dynamics and Earthquake Engineering, 44(1), pp. 139-152. https://doi.org/10.1016/j.soildyn.2012.09.013 [2] Lin, H., Cao, P., & Wang Y. X. (2013). Numerical simulation of the layered rock mass under triaxial compression test. International Journal of Rock Mechanics and Mining Sciences, 60, 12-18. https://doi.org/10.1016/j.ijrmms.2012.12.027 [3] Yuan, B. X., Chen, R., Teng, J., et al. (2015). Investigation on 3D ground deformation and response of active and passive piles in a loose sand. Environmental Earth Sciences, 73(11), 7641-7649. https://doi.org/10.1007/s12665-014-3935-9 [4] Hu, K., Y, Y. M., M, S. F., et al. (2012). Study on High-rise Structure with Oblique Columns by ETABS, SAP2000, MIDAS/GEN and SATWE. Procedia Engineering, 31, 474-480. https://doi.org/10.1016/j.proeng.2012.01.1054 [5] Hosseini, S. A. (2016). Development of Galerkin Finite Element Method Three-dimensional Computational Code for the Multigroup Neutron Diffusion Equation with Unstructured Tetrahedron Elements. Nuclear Engineering and Technology, 48(1), 43-54. https://doi.org/10.1016/j.net.2015.10.009 [6] Yuan, B. X., Chen, R., Teng, J., et al. (2014). Effect of passive pile on 3D ground deformation and on active pile response. The Scientific World Journal, Article ID 904186(2014), pp. 1-6. https://doi.org/10.1155/2014/904186 [7] Sousa, J. M. B. & Muniz, C. F. D. G. (2007). Analytical integration of cross section properties for numerical analysis of reinforced concrete,steel and composite frames. Engineering Structures, 29(4), 618-625. https://doi.org/10.1016/j.engstruct. 2006.06.002 [8] Pallarés, L., Miguel, P. F., & Fernández-Prada, M. A. (2009). A numerical method to design reinforced concrete sections subjected to axial forces and biaxial bending based on ultimate strain limits. Engineering Structures, 31(12), 3065-3071. https://doi.org/10.1016/j.engstruct.2009.08.006 [9] Bencardino, F., Condello, A., & Ombres, L. (2016). Numerical and analytical modeling of concrete beams with steel, FRP and hybrid FRP-steel reinforcements. Composite Structures, 140, 53-65. https://doi.org/10.1016/j.compstruct.2015.12.045 [10] Ivañez, I. & Sanchez-Saez, S. (2013). Numerical modelling of the low-velocity impact response of composite sandwich beams with honeycomb core. Composite Structures, 106(12), 716-723. https://doi.org/10.1016/j.compstruct.2013.07.025 [11] Kirkland, B., Kim, P., Uy, B., et al. (2015). Moment–shear– axial force interaction in composite beams. Journal of Constructional Steel Research, 114, 66-76. https://doi.org/10.1016/j.jcsr.2015.07.011 [12] Li, X. F. & Kang, Y. L. (2015). Effect of horizontal reaction force on the deflection of short simply supported beams under transverse loadings. International Journal of Mechanical Sciences, 99, 121-129. https://doi.org/10.1016/j.ijmecsci.2015.05.010 [13] Chen, D., Yang, J., & Kitipornchai, S. (2016). Free and forced vibrations of shear deformable functionally graded porous beams. International Journal of Mechanical Sciences, 108-109, 14-22. https://doi.org/10.1016/j.ijmecsci.2016.01.025 [14] Padmarajaiah, S. K. & Ramaswamy, A. (2002). A finite element assessment of flexural strength of prestressed concrete beams with fiber reinforcement. Cement and Concrete Composites, 24(2), 229-241. https://doi.org/10.1016/S0958-9465(01)00040-3 [15] Zhang, W. P., Liu, X. G., & Gu, X. L. (2016). Fatigue behavior of corroded prestressed concrete beams. Construction and Building Materials, 106, 198-208. https://doi.org/10.1016/j.conbuildmat.2015.12.119 Technical Gazette 25, 2(2018), 368-375
Yuan HAIPING et al.: An Improved Method for Calculating Bending Moment and Shearing Force of Beam in Numerical Modelling
[16] Fuentes, R. (2015). Internal forces of underground structures from observed displacements. Tunnelling and Underground Space Technology, 49, 50-66. https://doi.org/10.1016/j.tust.2015.03.002 [17] Murín, J., Aminbaghai, M., Kutiš, V., et al. (2014). A new 3D Timoshenko finite beam element including non-uniform torsion of open and closed cross sections. Engineering Structures, 59(2), pp. 153-160. https://doi.org/10.1016/j.engstruct.2013.10.036 [18] Hu, H. S., Nie, J. G., & Wang, Y. H. (2016). Shear capacity of concrete-filled steel plate composite coupling beams. Journal of Constructional Steel Research, 118, 76-90. https://doi.org/10.1016/j.jcsr.2015.10.023 [19] Shin, D., Choi, S., Jang, G. W., et al. (2016). Finite element beam analysis of tapered thin-walled box beams. ThinWalled Structures, 102, 205-214. https://doi.org/10.1016/j.tws.2016.01.028 [20] Liu, X. P., Bradford, M. A., Chen, Q. J., et al. (2016). Finite element modelling of steel-concrete composite beams with high-strength friction-grip bolt shear connectors. Finite Elements in Analysis and Design, 108(C), 54-65. https://doi.org/10.1016/j.finel.2015.09.004 [21] Canha, R. M. F., Kuchma, D. A., Debs, M. K. E., et al. (2014). Numerical analysis of reinforced high strength concrete corbels. Engineering Structures, 74, 130-144. https://doi.org/10.1016/j.engstruct.2014.05.014 Contact information: Haiping YUAN, 1) School of Civil Engineering, Hefei University of Technology, Hefei, China 2) Hunan Province Key Laboratory of Safe Mining Techniques of Coal Mines (Hunan University of Science and Technology), Xiangtan, China E-mail:
[email protected] Zhanqi WANG, School of Civil Engineering, Hefei University of Technology, Hefei, China E-mail:
[email protected] Yixian WANG, Corresponding author School of Civil Engineering, Hefei University of Technology, Hefei, China E-mail:
[email protected] Panpan GUO, School of Civil Engineering, Hefei University of Technology, Hefei, China E-mail:
[email protected] Yan LIU, State Key Laboratory of Explosion Science and Technology (Beijing Institute of Technology), Beijing 100081, China E-mail:
[email protected]
Tehnički vjesnik 25, 2(2018), 368-375
375