Hindawi Journal of Nanomaterials Volume 2017, Article ID 1591504, 12 pages https://doi.org/10.1155/2017/1591504
Research Article An Efficient Method for Cellulose Nanofibrils Length Shearing via Environmentally Friendly Mixed Cellulase Pretreatment Yuan Chen,1 Yuchan He,1 Dongbin Fan,1 Yanming Han,1 Gaiyun Li,1 and Siqun Wang1,2 1
Chinese Academy of Forestry, Research Institute of Wood Industry, Beijing 100091, China Center for Renewable Carbon, University of Tennessee, Knoxville, TN 37996, USA
2
Correspondence should be addressed to Gaiyun Li;
[email protected] Received 4 January 2017; Revised 23 February 2017; Accepted 7 March 2017; Published 23 March 2017 Academic Editor: Sohel Rana Copyright © 2017 Yuan Chen et al. This is an open access article distributed under the Creative Commons Attribution License, which permits unrestricted use, distribution, and reproduction in any medium, provided the original work is properly cited. Cellulose nanofibrils (CNFs) have potential applications in the development of innovative materials and enhancement of conventional materials properties. This paper focused on the mixed cellulase hydrolysis with major activity of exoglucanase and endoglucanase on the cellulose length shearing. By the cooperation of two-step production route, including (1) enzymatic pretreatment using cellulase from Trichoderma viride and (2) mechanical grinding twice, a shorter cellulose nanofiber was fabricated. The influence of enzymatic charge and hydrolysis time on cellulose fibers was analyzed by using scanning electron microscopy (SEM), Fourier Transform Infrared Spectrometer (FTIR), and X-ray diffractometer (XRD). SEM images revealed that the surface morphology change, effective diameter sharpening, and length shearing of cellulose fibers are as a result of cellulase hydrolysis. The XRD suggested that the cellulase acted on the amorphous regions more strongly than the crystalline domains during layer-by-layer hydrolysis. The enzymatic charge and hydrolysis time significantly affected the yields and hydrolysis products concentration. The enzymatic pretreatment assisted mechanical grinding could improve the uniformity of CNF and helped to obtain CNF with exact length according to the requirement for special applications.
1. Introduction Cellulose is one of the most important biopolymer materials [1]. The renewable, lightweight, and low-cost natural fibers can be used as the ideal reinforcement material [2] to improve the strength and stiffness of polymer composites [3]. In recent years, cellulose nanofibers have attracted great attention due to the super peculiarity [4, 5] (e.g., biodegradation, small size effect, and extremely large surface area), which results in the wild applications [2, 4], including optically transparent materials, surface coating, drug delivery, biomedical materials [6], and food package [7]. A few methods have been developed to manufacture cellulose nanofibers [8–14], including chemical, mechanical, and biological method. The most common chemical method is strong acid hydrolysis [8, 9]. However, the easy-corrosion and high requirements for reaction equipment, nonrecycling, and comparatively low yields limit this method for large-scale production. TEMPOoxidized cellulose fibers method can obtain a high yield.
But this method seems unsuccessful to apply to the high crystalline nonwood fibrils [10]. Biological preparation is major to be used in the bacterial cellulose, and it is a high cost, long time, and small-scale preparation process [11–13]. Mechanical method is more widely applied because of the nonchemical reagents, nonenvironmental pollution, and ripe equipment. However, plant fibers have the special multilayer structure of cell walls, and there are a large number of hydrogen bonds between the molecular interaction and intramolecularity, which requires more number of repeated cycles to increase the degree of fibrillation [14]. A higher number of passes also increase the energy consumption [15]. In conclusion, mechanical fabrication is the most potential method to produce CNF on a large scale. The high energy consumption and large variability [15–17] are the major problems during the mechanical fabrication. Pretreatment methods have been reported [8–10] to solve the issues mentioned above. Compared with acid hydrolysis [18, 19], carboxymethylation [20], and TEMPO-mediated
2 oxidation [10], enzymatic pretreatment is satisfied with the requirements of green and is ecofriendly. It is one of the most promising, efficient, and energy-saving pretreatments to convert plant cellulose fibrils [21, 22]. So far, a series of studies have been reported about the mechanism of enzymatic hydrolysis [23–25]. There is wide recognition that the enzyme hydrolysis is the result of cooperation of monocomponent [26, 27] enzyme, mainly including endoglucanases, exoglucanases, and cellobiases. Nevertheless, there are no explicit reports about the sharpening and shearing action on cellulose fibers during the mixed cellulase hydrolysis process. The action mechanism of mixed cellulase on hardwood pulp fibers dimension control, especially length shearing, is worth to research. This paper focused on the ecofriendly approach for CNF production on a large scale by enzymatic pretreatment assisted mechanical grinding from hardwood pulp. It mainly studied the action of one of mixed cellulase pretreatments on the length control of cellulose fibers. Compared with monoendoglucanase hydrolysis previously reported [28, 29], the cost of mixed cellulase is much lower, which significantly declines the total cost of CNF products. Then the hydrolysis mechanism of cellulase on the crystalline and amorphous domains was studied by the XRD and FTIR spectrum with enzymatic charge and hydrolysis time change. The enzyme hydrolysis can effectively shear the fibril length and sharpen the diameter of cellulose fibrils, which will help to manufacture CNFs with special size according to the requirements of applications using a virtually nonenvironmental pollution process. The shorter length CNF and its derivatives are being prospectively explored in extensive application in composite reinforcement and nanomaterial fields.
2. Materials and Methods 2.1. Materials. The commercial eucalyptus pulp was purchased from Guangdong Zhanjiang Chenming Paper Co., Ltd. The fiber dimensions were ≥10 𝜇m in diameter and ≥200 𝜇m in length. The cellulase (Mw = 45000∼76000, enzyme activity ≥ 15000 U/g) was from Trichoderma viride and purchased from Chinese Medicine Group. The commercial enzyme was a mix of endoglucanase and exoglucanase. The phosphate buffer solution was used during enzymatic pretreatment, including KH2 PO4 and Na2 HPO4 , where pH was 4.8. 2.2. Preparation of Enzymatic Pretreatment Cellulose. The enzymatic pretreatment of cellulose fibers was carried out by pulp treating and enzymatic treatment followed by three steps: first, never-dried cellulose hardwood pulp (10 g) was shred into pieces (Micro pulverizer, Tianjin Taisite Instrument Co., Ltd.) and soaked in 1000 mL deionized water. The high speed mixer was used to mix the pulp pieces with 500 rpm for 2 h. Then the pulp suspension was placed for 24 h to fully swell the fibers at the room temperature. The suspension was filtered to remove water after well swelling. Secondly, 250 mL phosphate buffer solution was added to a 500 mL erlenmeyer flask, then adding cellulase charge of 0.1 g, 0.2 g, 0.4 g, and 0.6 g, respectively. The enzymatic
Journal of Nanomaterials solution is shaken evenly and added to the filtered cellulose pulp. The erlenmeyer flask was put into the constant temperature shaking incubator (HZQ-F160, Taicang Laboratory equipment, China) at 50∘ C with 180 r/min for 10 h. At the same condition, the sample suspension with charge of 0.4 g cellulase was shaken in full temperature oscillation incubator for 5 h, 10 h, 15 h, and 20 h, respectively, which evaluated the influence of hydrolysis time. Thirdly, after the enzymatic reaction achievement, the cellulose fiber treated by enzymatic hydrolysis was filtered and washed using distilled water until the pH ∼ 7.0. The purpose was to get rid of buffer solution and biomass products during the hydrolysis. Then the pulp fibers was added a certain amount of distilled water and placed in the oscillation incubator for 30 min at 80∘ C to terminate the cellulase reaction. 2.3. Enzymatic Pretreatment Yields Calculation. Using the cellulase reaction method mentioned above, the suspension was filtered and washed using distilled water after the enzymatic reaction. The filtered fiber was dried in the oven at 105∘ C for 6 h and the never-dried mass was weighted as 𝑀1 . The enzymatic pretreatment yield 𝑌enzy was calculated by the following equation: 𝑌enzy =
𝑀1 × 100%, 𝑀0
(1)
where 𝑀0 was the raw eucalyptus pulp mass. The yield result was obtained by the average value of thrice parallel experiments. 2.4. Mechanical Grinding Treatment. The enzymatic pretreatment pulp suspension was prepared by adding distilled water until 1000 mL volume and adding it to the grinder (MKCA6-2, Japan Masuko Company) with the millstone gap of −200 𝜇m and speed of 1500 rpm twice. Then the CNF suspension was fabricated. A comparative suspension without enzymatic treatment was prepared under the same grinding condition. A small amount of CNF suspension was frozen in liquid nitrogen and dried in a freeze drying machine (Beijing Boyikang Laboratory Instrument Co., Ltd.) for 2 days to form the aerogel. The aerogel was used to be tested by SEM, FTIR, and XRD. 2.5. Characterization 2.5.1. Morphology Analysis. The scanning electron microscopy (SEM, Hitachi S-4800) was performed to characterize the morphology of enzymatic pretreatment fibers. It was prepared by sputter-coating with gold to provide adequate conductivity. The further images of CNF were obtained using the transmission electron microscopy (TEM, JEOL JEM-1230) with an accelerating voltage of 120 kV. The TEM samples were prepared by dropping diluted CNF dispersions (5 𝜇L) onto copper grids coated with carbon-coated support film. 1 wt% phosphotungstic acid solution was used to stain negatively and enhance the contrast of images. The samples were dried at room temperature for 24 hours. The length and diameter of CNF were calculated by Nano Measurer Particle Size Distribution Software.
Journal of Nanomaterials
3
2.5.2. Chemical Composition Analysis. The chemical composition of the raw eucalyptus pulp was determined by national standards GB/T 462-2008, GB/T 2677.10-1995, GB/T 2677.81994, and GB/T 774-1989 and expressed as wt% contents of synthetic cellulose, acid insoluble lignin, 𝛼-cellulose, and hemicellulose. Three tests on each sample were performed and the average value was calculated. 2.5.3. Fourier Transform Infrared Spectroscopy (FTIR). FTIR was recorded using the spectrum 400 (PE company, America). Before CNF aerogel samples data collection, background scanning was performed using KBr disc. The KBr disc containing 1% of very fine ground samples and one hundred scans were taken in the range of 4000–500 cm−1 at a resolution of 4 cm−1 in the absorbance mode. 2.5.4. X-Ray Diffraction (XRD) Analysis. The XRD patterns were measured by an X-ray diffractometer (D8 advance, Bruker Co., Ltd., Germany) with Ni-filtered Cu K𝛼 radiation at 45 kV and 40 mA. The diffraction data were collected from 2𝜃 = 5∘ ∼40∘ at a scanning rate of 4∘ /min. The relative crystallinity index CrI was estimated using the Segal method [30] by the following equation: CrI (%) = (1 −
𝐼am ) × 100, 𝐼200
(2)
where 𝐼am was the diffraction intensity of amorphous fraction at 2𝜃 ≈ 18.5∘ and 𝐼200 was the peak intensity of the 002 lattice diffraction at 2𝜃 ≈ 22.5∘ which represented the crystalline region. 2.5.5. The High-Performance Liquid Chromatography (HPLC) Saccharification Analysis. The centrifuged supernatant of enzymatic pretreatment pulp was filtered through a 0.45 𝜇m organic microporous membrane filter. The sugar quantification was performed using a HPLC system (JACSO, Tokyo, Japan), equipped with an Inertsil NH2 column at 35∘ C with a flow rate of 1.0 mL 78% acetonitrile/min, to determine the concentration of the monomeric sugars and disaccharide derived from the cellulose and hemicellulose fractions by comparing with the standard samples. The concentration was estimated by the following equation: 𝐶=
𝑆 ⋅ 𝐶s , 𝑆s
(3)
where 𝐶 was the concentration of hydrolysis product, 𝑆s was the peak area of standard sugar sample, 𝑆 was the peak area of hydrolysis product, and 𝐶s was the concentration of standard sugar sample, including glucose, xylose, and cellobiose.
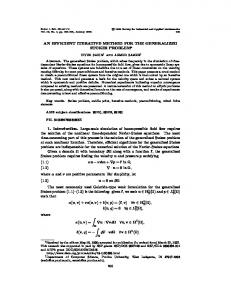
3. Results and Discussions 3.1. The Enzymatic Pretreatment Procedure. The hardwood resource (e.g., Eucalyptus) had more rigid structure compared to softwood counterpart [31]. It required more mechanical treatment than softwood homologue to manufacture equivalent fibrillations [32]. Thus, the pretreatment was a necessary technique to extract nanofibrils
assisted mechanical disintegration. Figure 1 showed the schematic representation of enzymatic pretreatment procedure. The chemical composition analysis of raw eucalyptus pulp revealed that the holocellulose, acid insoluble lignin, 𝛼-cellulose, and hemicellulose were 95.71%, 0.09%, 84.64%, and 11.07%, respectively. It revealed that the pulp could be directly used in enzymatic hydrolysis and did not need purification treatment. By the constant temperature shaking incubator, the cellulase evenly adhered to the surface of pulp cellulose fiber and started hydrolysis. The cellulose fibrils were about hundreds of microns in length and dozens in diameter (seen in Supporting Figure 1 in Supplementary Material available online at https://doi .org/10.1155/2017/1591504). And the cellulose fibrils were consisting of microfibrils with 3-4 nm in dimension and up to 20 nm for wood cell wall. Cellulose was further consisting of hundreds to over ten thousands of 𝛽-1,4 linked glucose units and formed a linear polymer, where the chain length varied between 100 and 14000 residues [31]. Due to numerous hydrogen bonds being intra/intermolecular, cellulose chains tended to be oriented in parallel and aggregate crystalline regions were highly ordered. And more disordered amorphous domains were interspersed [33, 34]. By the cooperation of mixed cellulase and layer-by-layer permeated hydrolysis, mixed enzyme finally caused fibers surface wrinkling and length decreasing. The short cellulose nanofibrils (about 1∼ 3 𝜇m in length) were prepared by enzymatic pretreatment assisted twice grinding passes, as shown in Figure 1. 3.2. Micromorphology Characterization of Enzymatic Cellulose. It was essential to investigate the micromorphology structure change of cellulose fibers at different enzymatic charge and hydrolysis time, as the SEM images shown in Figure 2. Figure 2(a) illustrated the morphology change of cellulose fibers including original pulp (O-Pulp), pretreatment with cellulase charge of 0.1g, 0.2g, 0.4g, and 0.6 g at hydrolysis time 10 h, and hydrolysis time of 5h, 10h, 15h, and 20 h, respectively, at 0.4 g cellulase charge. The surface of O-Pulp fiber was obviously smooth. With the cellulase charge and hydrolysis time increasing, the surface of cellulose fiber appeared rough wrinkled and grooved. It was obvious that the most outer layer was protuberant (see the images of C0.1 g,10 h and C0.4 g,5 h ) and the finer fiber appeared (see the images of C0.1 g,10 h and C0.4 g,10 h , especially in the pink insert frame). However, there was still a small quantity of smooth outer layer. Furthermore, the smooth outer layer disappeared and a large amount of micro/nanoporosity appeared on the surface of cellulose, which resulted from the cellulase degradation layer by layer unidirectionally and deeply sharpening the fibers; see the images of C0.2 g,10 h , C0.4 g,15 h and the pink insert frames. It was easy to fracture in the porosity, which resulted in a loss of fiber length and diameter. It was apparent that enzymatic pretreatment could receive the purpose of facilitate microfibrillation during the homogenization procedure. Simultaneously, the most significant action of the porosity was to shear the length of cellulose fibrils. Under C0.6 g,10 h condition, the surface of cellulose appeared as obvious nanofibrils with a lot of fracture sites, as seen in the image of C0.6 g,10 h and the magnified image
4
Journal of Nanomaterials Cellulose fiber in enzyme hydrolysis Cellulose molecular structure CNFs
Enzymatic preparation reaction
200 nm Enzymatic preparation assisted grinding
Cellulose
Figure 1: The schematic representation of enzymatic pretreatment procedure and the TEM image of CNF by enzymatic pretreatment and grinding. The morphology and structure schemas of the cellulose fibers in the enzymatic hydrolysis solution.
500 nm
O-Pulp
5 𝜇m
C0.1 g,10 h
5 𝜇m
5 𝜇m
C0.2 g,10 h
500 nm
C0.4 g,5 h
5 𝜇m
C0.4 g,10 h
5 𝜇m
C0.6 g,10 h
5 𝜇m
500 nm
500 nm 5 𝜇m
C0.4 g,15 h
C0.4 g,20 h
5 𝜇m
500 nm
500 𝜇m
5 𝜇m
(a)
O-Pulp
C0.4 g,5 h
500 𝜇m
500 𝜇m
C0.1 g,10 h
C0.4 g,10 h
500 𝜇m
500 𝜇m
500 𝜇m
C0.2 g,10 h
500 𝜇m
C0.4 g,15 h
C0.6 g,10 h
C0.4 g,20 h
500 𝜇m
1 𝜇m
(b)
Figure 2: The SEM images for micromorphology change of cellulose fibers at different enzymatic charge and hydrolysis time. (a) The surface morphology changing process of single cellulose fiber with different conditions, appearing as rough wrinkle-groove-micro-/nanoporositynanofibrils. (b) The whole morphology of O-Pulp and enzymatic hydrolysis cellulose SEM images. There were numerous white flocculent substances on the surface of enzymatic hydrolysis cellulose fibers, which showed the enzymatic hydrolysis processes layer by layer on the fiber surface. The white flocculent substance was composed of shorter-thicker spindles fiber aggregation, which were cut by the cellulase.
(right blue frame one). However, there were only a handful of nanofibrils appearing on the surface layer with the cellulase time increasing (∼20 h, see the image of C0.4 g,20 h and the magnified one). The next layer was still relatively coarse fiber,
which illustrated that the cellulase hydrolysis process completed layer by layer and the cellulase molecule was gradually permeating inwards. Supporting Figure 2 further showed the diameter of original pulp fiber and enzymatic hydrolysis
Journal of Nanomaterials
5 Cellulase dosage
Cellulase time
0.8 0.7 0.6 0.5 0.4 0.3
35
40
(a)
C0.4 g,20 h
30
C0.4 g,15 h
20 25 2 theta (∘ )
C0.4 g,10 h
15
C0.4 g,5 h
10
0.0
C0.6 g,10 h
5
0.1 C0.4 g,10 h
C0.1 g,10 h O-Pulp
18.5∘ 22.5∘
0.2
C0.2 g,10 h
C0.6 g,10 h C0.2 g,10 h
I002
Iam
C0.4 g,5 h
C0.1 g,10 h
C0.4 g,15 h C0.4 g,10 h
O-Pulp
Intensity (a.u.)
C0.4 g,20 h
(b)
Figure 3: The XRD patterns of O-Pulp and enzymatic hydrolysis samples with different enzymatic charge and hydrolysis time. (a) The XRD patterns of the typical diffraction of crystal lattice type I with different conditions. The diffraction peaks were around 2𝜃 = 16∘ and 22.5∘ . (b) The crystallinity of cellulose varied under different enzymatic hydrolysis pretreatments. With the cellulase charge increasing, the crystallinity exhibited a ladder increase due to the layer-by-layer hydrolysis. However, the crystallinity trended to evidently decrease with hydrolysis time, which suggested that cellulase hydrolysis rate of amorphous domains reduced gradually and was less than that of crystalline domains.
cellulose fibers with the conditions the same as Figure 2(a). The average diameter had an obvious decreasing after using enzyme hydrolysis due to layer-by-layer action. Due to the synergistic cooperation [35] of enzymatic pretreatment, adding an excess enzymatic charge would make a number of enzyme molecules interaction with the same region and influence on the degradation efficiency. And the enzyme hydrolysis time turned out the effect on the reaction kinetics [25], which was not well as long as possible. Seen from the minified SEM images, the layer sharpening action of cellulase was more remarkable. Figure 2(b) demonstrated that the surface of original pulp fibers was tidy and clean. There were no flocculent substances in O-Pulp image. With the enzyme addition, the white flocculent substance appeared, seen as the orange dotted circle. And the flocculent substance changed increasing with the cellulase charge and time increasing, especially under C0.6 g,10 h condition. The magnified images (the orange and blue dotted frame on the right) showed that the white flocculent substance was composed of short-thick spindle fiber aggregation, which were cut by the cellulase. The spindle aggregation obviously consisted of shorter-finer cellulose fibers (seen in the magnified image with blue dotted frame). The formation of spindle fibers might result from the cellulase sharpening action; simultaneously, it led to the length decreasing. The dimension of these spindle fibers was about length of 5 𝜇m and diameter of 1.8 𝜇m, which was greatly less than cellulose fibers. The existence of these white flocculent substances suggested enzymatic hydrolysis processes periodic “skinning” on the fiber surface and shearing the cellulose fiber length.
3.3. XRD in Qualitative Measurements of Enzymatic Cellulose. Regarding the change of crystallinity (CrI) and crystal structure, the enzymatic pretreatment cellulose aerogels were presented in Figure 3(a). Figure 3(a) showed that all the XRD patterns exhibited the typical diffraction of crystal lattice type I, which confirmed the diffraction peaks around 2𝜃 = 16∘ and 22.5∘ . The cellulose crystal lattice type was preserved even though it had gone through the cellulase pretreatment. However, Figure 3(b) implied that the crystallinity of cellulose varied under different enzymatic hydrolysis pretreatment. The CrI was calculated as the ratio of the crystalline phase area versus the total area [36, 37]. Origin software was used to accurately select the diffraction intensity of amorphous fraction at 2𝜃 ≈ 18.5∘ and the 002 lattice diffraction at 2𝜃 ≈ 22.5∘ that represented the crystalline region [28]. The CrI of O-Pulp was 62.1%, and that was evidently increasing after different cellulose charge pretreatment, 70.2%, 68.9%, 70.2%, and 72.9%, respectively, for 0.1 g, 0.2 g, 0.4 g, and 0.6 g at 10 h. This suggested that the mixed cellulase mainly affected the amorphous domains of cellulose, which resulted in the crystallinity of all samples increasing 8.1% compared with original pulp. However, with the cellulase charge increasing, part monocomponent cellulase penetrated into the crystalline region interior and allowed a selective hydrolysis of the crystalline sites, which resulted in the CrI reducing in small quantities (1.3%) with 0.2 g charge. With large cellulase increasing, plenty of enzymes were involved in the reaction. The cellulase hydrolysis ability of amorphous domains was much higher than the crystalline ones [38], which resulted in CrI exhibiting a linear increase, 1.3% and 2.7%, respectively,
6
Journal of Nanomaterials The relative intensity of FTIR absorbance peaks 1059 3400
Wavelength 3400 (cm−1 )
2900
1641
1433
1369
1165
1113
1059
898
O-Pulp
8.60
3.35
1.00
3.31
3.79
6.94
8.56
10.75 1.55
C0.1 g,10 h
8.83
2.99
1.00
2.71
3.30
5.72
7.52
9.27
1.19
C0.1 g,10 h
C0.2 g,10 h
8.95
2.75
1.00
2.51
3.06
5.55
7.34
9.33
1.06
C0.2 g,10 h
C0.4 g,10 h
9.81
2.82
1.00
2.51
3.05
5.37
7.18
9.78
1.08
C0.6 g,10 h
C0.6 g,10 h
8.72
2.54
1.00
2.27
2.76
5.26
6.47
8.24
0.97
C0.4 g,10 h
C0.4 g,5 h
8.38
2.80
1.00
2.52
3.07
5.47
7.30
9.27
1.09
C0.4 g,15 h
C0.4 g,10 h
9.81
2.82
1.00
2.51
3.05
5.37
7.18
9.78
1.08
C0.4 g,20 h
C0.4 g,15 h
9.01
2.93
1.00
2.65
3.23
5.65
7.35
8.76
1.15
C0.4 g,20 h
9.91
2.89
1.00
2.57
3.15
5.60
7.56
9.83
1.14
2900 O-Pulp
Absorbance
1113 1165 1433 1369 1641
898
C0.4 g,5 h
4000
3500
3000 1500 Wavelength (cm−1 )
1000
500
(a)
(b)
Figure 4: The FTIR spectrums and relative absorption peaks intensity of O-Pulp and enzymatic hydrolysis cellulose with different charge and hydrolysis time. (a) The FTIR spectrums of different samples. It is illustrated that enzymatic hydrolysis did not cause the structure transformation change. (b) The relative absorbance peak intensity relative to 1641 cm−1 .
for 0.4 g and 0.6 g charge. However, the effect of hydrolysis time presented a different trend. Compared with the O-Pulp crystallinity, it was evidently increasing from 62.1% to 71.0% after hydrolysis for 5 h at 0.4 g charge, which was identical to the change mentioned above. Nevertheless, the CrI trended to evidently decrease with hydrolysis time, 70.2%, 69.1%, and 66.4%, respectively, after hydrolysis for 10 h, 15 h, and 20 h with 0.4 g charge. This suggested that the crystalline domain hydrolysis rate was stronger than the amorphous ones with time extension, which resulted in the CrI decreasing (Figure 3(b)). It further implied that mixed cellulase hydrolysis was not confined to attack the amorphous region but the surfaces of the crystalline and amorphous domains compared to monocomponent endoglucanase [39]. Furthermore, the hydrolysis on these two domains was restrained regarding each other. 3.4. FTIR Spectrums Analysis of Enzymatic Cellulose. FTIR was employed to reveal the absorption peak intensity of OPulp, enzymatic hydrolysis cellulose with different charge, and reaction time, as Figure 4 shows. There was no distinction of the absorbance peaks between O-Pulp and enzymatic hydrolysis samples, which illustrated that enzymatic hydrolysis did not cause the structure transformation. The absorbance peaks at 3400, 2900, and 1641 cm−1 were, respectively, the intramolecular hydroxy O-H stretching vibration, C-H stretching vibration, and oxygen-containing group of absorbed water molecules. The absorbance peaks at 1433, 1369, 1165, 1113, and 1059 cm−1 were, respectively, the -CH2 bending vibration and shear vibration (1433 cm−1 ), the -CHbending deformation and vibration (1369 cm−1 ), C-O-C stretching vibration between cellulose and hemicellulose (1165 cm−1 ) or between the cellulose (1113 cm−1 ), and C=O
stretching vibration (1059 cm−1 ). The absorbance peak at 898 cm−1 was 𝛽-glycosidic bond vibration [40–42]. Even though there was no structure transformation after enzymatic hydrolysis, the relative absorbance peak intensity changed obviously. Supporting Table 1 provided all absorbance peak intensities of characteristic peaks. Based on the standard deviation, the absorbance peak at 1641 cm−1 was the least one and chosen as the relative peak. All the characteristic peaks were related to 1641 cm−1 at own samples, as shown in Figure 4(b). Compared with the O-Pulp, the relative absorbance peak intensity at 3400 cm−1 presented an obvious increase, which suggested that the intramolecular hydroxyl was heightened due to a large number of hydrogen bonds broken during enzymatic hydrolysis. And the other peaks definitely appeared rectilinear or stepped decreasing with cellulase charge and hydrolysis time, which illustrated that cellulase molecules gradually diffused into the fiber interior with the hydrolysis process and resulted in the chemical bonds changing. For example, the relative absorbance peak intensity at 2900 cm−1 had a stepped decreasing compared with original pulp, which stated that the intermolecular hydroxyl had been destroyed. However, cellulose macromolecule structure did not change during enzymatic hydrolysis. The relative absorbance peak intensity at 1433, 1369, 1165, 1113, and 1059 cm−1 presented evident rectilinear decreasing with cellulase charge and wave-like changes with cellulase time, which showed that cellulose hydrolysis presented periodic regularity. It might result from the hydrolysis on fiber crystalline and noncrystalline domains due to the cooperation of mixed cellulase. But the relative absorbance peak intensity at 898 cm−1 showed that 𝛽-glycosidic bond was broken at the initial stage of enzymatic hydrolysis, and the changes were a little with the hydrolysis continuing.
Journal of Nanomaterials
7
O-Pulp
100 95
Yield (%)
C0.1 g,10 h
90
C0.2 g,10 h C0.4 g,10 h
C0.6 g,10 h
85 80 C0.4 g,5 h
O-Pulp
75 C0.4 g,10 h
C0.4 g,15 h
C0.4 g,20 h
C0.1 g,10 h
C0.2 g,10 h
C0.6 g,10 h
C0.4 g,5 h
C0.4 g,10 h C0.4 g,15 h
C0.4 g,20 h
Cellulase dosage Cellulase time (a)
(b)
Figure 5: The yields of cellulose followed by hydrolysis with different charge and reaction time. (a) The yields of cellulose fibers appeared sharply decreasing at the initial hydrolysis process. (b) The optical images of yields under different conditions.
The FTIR spectra analysis further stated that the enzymatic pretreatment presented periodic effect on the crystalline and amorphous domains of cellulose fiber by layer-by-layer hydrolysis. 3.5. The Cellulose Yields of Fibers Followed by Cellulase Hydrolysis. Figure 5 demonstrated the yields of cellulase hydrolysis with different charge and reaction time. As shown in Figure 5(a), the yields of cellulose fiber appeared sharply decreasing at the initial hydrolysis process, 86.6% and 83.3%, respectively, for C0.1 g,10 h and C0.4 g,5 h . With the cellulase charge and reaction time increasing, the yields were decreasing accordingly. The yields were respectively 81.9%, 80.5%, and 79.6% with the charge increasing and decreasing to 80.5%, 78.4%, and 77.2% with the cellulase hydrolysis time. It was noteworthy that the yields declined more slowly. It implied that the decreasing rate was restricted that might be affected by reaction kinetics [25]. The final product glucose and intermediate cellobiose could restrain the enzymatic hydrolysis. Therefore, immoderately increasing the charge and hydrolysis time did not help to improve the hydrolysis efficiency. Figure 5(b) showed vividly the optical images under different conditions. The solution volumes were limited with 18 mL and kept for 30 min standing. The hydrolysis products, for example, glucose, were in the supernatant. Therefore, the sediment was proportional to the yields mentioned in Figure 5(a). 3.6. Hydrolysis Products Analysis. The cellulase hydrolysis produced some biomass components, for example, glucose, xylose, and disaccharide. HPLC was performed to estimate the compositions and amounts of cellulase hydrolysis products. Based on the standard samples determination, the main three types of compositions were respectively, glucose, xylose,
and cellobiose. Figure 6 showed the concentration change of hydrolysis products with enzymatic charge and hydrolysis time increasing. The changing of three types of sugar products showed a similar tendency. The highest saccharification yield was glucose, which showed the high-efficiency and full cellulase hydrolysis pretreatment. And higher concentration of glucose was achieved by more charge or hydrolysis time. The glucose concentration sharply increased from 1.408 to 3.630 mg/mL followed by the charge increasing from 0.1 to 0.6 g and from 2.418 to 3.273 mg/mL followed by the hydrolysis time increasing from 5 to 20 h. The other monosaccharide product was xylose. Unlike glucose increasing trend, it slowly increased followed by the enzymatic charge and hydrolysis time increasing. The xylose concentration ranged from 0.372 to 1.543 mg/mL with the enzymatic charge changing and from 0.869 to 1.564 mg/mL with hydrolysis time increasing. The reason might be on account of the xylose derived from hemicellulose hydrolysis. And the hemicellulose content was just 11.07%. In the hydrolysis products, there was little cellobiose (0.570 to 1.258 mg/mL in Figures 6(a) and 6(b)) as the intermediate product of cellulase hydrolysis. Due to the feedback inhibition of reaction kinetics, the abundance of glucose affected the rate of cellobiose hydrolysis by cellobiase (one of monoenzyme in the mixed cellulase). Thus, the increasing rate of cellobiose was slower than glucose and xylose. In general, more enzymatic charge and hydrolysis time resulted in more biomass products, which would result in the reduction of CNF yields. 3.7. CNF Manufactured by Cooperation of Cellulase Pretreatment and Mechanical Grinding. The CNF suspensions were, respectively, manufactured using un-enzyme and cellulase hydrolysis (C0.4 g,10 h ) pretreatment followed by grinding twice with the millstone gap −200 𝜇m and speed 1500 rpm. Figure 7
8
Journal of Nanomaterials 4.0
3.5
3.0
3.0
Concentration (mg/mL)
Concentration (mg/mL)
3.5
2.5 2.0 1.5
2.5
2.0
1.5
1.0 1.0
0.5 C0.1 g,10 h
C0.2 g,10 h
C0.4 g,10 h
C0.6 g,10 h
Glucose Xylose Cellobiose
C0.4 g,5 h
C0.4 g,10 h
C0.4 g,15 h
C0.4 g,20 h
Glucose Xylose Cellobiose (a)
(b)
Figure 6: The concentration change of hydrolysis products with enzymatic charge (a) and hydrolysis time (b) increasing. All of the glucose, xylose, and cellobiose were increasing with the enzymatic charge and hydrolysis time increasing. The glucose was the highest saccharification yield in all the hydrolysis products.
showed the SEM and TEM images and data statistics of diameter of two types of CNF samples. Figure 7(a) shows the CNF prepared by pure grinding of raw pulp suspension. Nanomeasure software was used to count the diameter of cellulose fibrils, derived from 10 SEM images with 2000 data points. The diameter ranged from 50 nm to 300 nm, as shown in Figure 7(c). The average diameter under that condition was 118.6 ± 62.6 nm, which was highly nonuniform. However, the CNF fabricated by enzymatic pretreatment assisted grinding was more uniform, as shown in Figure 7(b). The average diameter of CNF under C0.4 g,10 h pretreatment was 69.1±15.2 nm (seen in Figure 7(d)). The diameter ranged from 20 to 120 nm. Seen from the data distribution, the diameter of fibrils with enzymatic pretreatment was more centralized than original pulp. It was more interesting that there was obvious fibril breakage as shown the arrows in Figure 7(b), which was inferred from the cellulase hydrolysis. The TEM images further showed the length of CNF. The average length was about 2.4 ± 0.9 𝜇m (seen in the TEM image at Figure 7(e) with red dotted frame), which was much less than that of fibril prepared by original pulp. The TEM image (Figure 7(e) with blue dotted frame) displayed that the shorter fibrils had reached the nanometer level. Compared with two types of cellulose fibrils, it more vividly illustrated the sharpening and shearing action of cellulase pretreatment on fibril dimensions. 3.8. The Mechanism of Enzymatic Hydrolysis and Length Shearing Process. Figure 8 showed the schematic illustration and morphology images of the cellulose fibers from enzymatic hydrolysis to formation CNF. As shown in Figure 8(a), the surface of original pulp fibers was smooth, and no
fibrillation existed. With the enzymatic hydrolysis proceeding, the fiber surface was markedly rough and aggregated microfibrils due to layer-by-layer action. The diameter of fibers declined and the microfibrils vividly displayed many breaking sites (Figure 8(b)). Based on the enzyme action mechanism recognized universally [43] and discussed above, the hydrolysis resulted from the synergistic effect of endoglucanase (EG), exoglucanase (cellobiohydrolases, CBH), and cellobiase (CB). In this research, the cellulase from Trichoderma viride was one kind of mixed cellulase. Each of monoenzymes included a globular catalytic domain and one or more carbohydrate binding domains, which were connected by an identifiable link bride, as shown in Figure 8(b). Based on the previous reports [44–48], CBH included CBH I and CBH II; here, CBH I degradated the crystalline fibrils by layer sharpening [44–46] and CBH II resulted in the crystalline microfibril-end sharpening [47, 48] and reduced the length of fibrils (Figure 8(b)). It suggested the mechanism of mixed cellulase action on fiber length control. The EG mainly caused the degradation of amorphous region [49]. It performed the prefect synergistic degradation effect [50] of CBH and EG (Figure 8). Here, CB further degraded the intermediate product of CBH and EG hydrolysate (cellobiose) and further formed monosaccharide (glucose and xylose), which helped to decrease the feedback inhibition of reaction kinetics. The aim of enzymatic pretreatment was to hydrolyze the cellulose crystalline and noncrystalline domains and destruct the stable hydrogen bonds structure, which further assisted the mechanical grinding to obtain the cellulose nanofibrils with greatly decreasing the length and diameter. The reaction sites of molecular formula of cellulose were shown in Supporting Figure 3. The synergistic
Journal of Nanomaterials
9
2 𝜇m
2 𝜇m (a)
50
100
150 200 Diameter (nm)
(b)
250
300
20
(c)
40
60 80 Diameter (nm)
100
120
(d)
1 𝜇m
500 nm (e)
Figure 7: The SEM and TEM images and data statistics of diameter of different CNF manufactured by cooperation of original pulp or cellulase hydrolysis pulp with mechanical grinding. (a) The SEM image of CNF prepared by grinding of raw pulp solution. The diameters of these CNFs were highly nonuniform. (b) The SEM image of the CNF prepared by grinding with C0.4 g,10 h condition pretreatment. There were numerous breaking points. (c-d) The diameter statistics of (a) and (b) samples. The diameter of CNF prepared by original pulp ranged from 50 nm to 300 nm that the average diameter was 118.6 ± 62.6 nm. And the diameter of CNF prepared by C0.4 g,10 h condition pretreatment ranged from 20 nm to 120 nm that the average diameter was 69.1 ± 15.2 nm. (e) The TEM images of average length CNF prepared by C0.4 g,10 h condition pretreatment was about 2378 ± 940 nm.
cooperation of mixed enzyme finally caused fibers surface wrinkling and length decreasing. Followed by enzymatic hydrolysis, mechanical grinding further sheared the length of fibers and declined the diameter and ultimately formed the shorter CNF (Figure 8(c)).
4. Conclusions We reported a kind of green and ecofriendly pretreatment method to manufacture CNF, which was a mixed cellulase from Trichoderma viride before hydrolysis. By the
cooperation of enzymatic pretreatment and mechanical grinding twice, the length of fibrils was obviously controlled, in that enzymatic pretreatment led to the key action on cutting the length of fibrils. The as-pretreatment cellulose fibers indicated that cellulase acted on the pulp layer by layer and concurrently hydrolyzed the crystalline and amorphous regions. The shearing action of enzyme hydrolysis resulted in the decreasing of fiber length. This paper further discussed the effect of cellulase charge and hydrolysis time on crystallinity, yields, and hydrolysis products. The result offered an insight into the fabrication method of CNF with length
10
Journal of Nanomaterials
Enzymatic hydrolysis
Grinding
5 𝜇m
500 nm CBHII
500 nm
EG
CBHI
CBHI Long cellulose fibers Crystalline domain Amorphous domain CBHI
Length shearing
Formation of shorter CNF
CBHII EG
(a)
(b)
(c)
Figure 8: The schematic representation of original pulp fiber (a), enzyme hydrolysis fibers (b), and the fibrils followed by grinding, and the corresponding SEM and TEM images.
controlled. It would help to choose the appropriate reaction condition according to the requirements for the specific applications.
Conflicts of Interest The authors declare that they have no conflicts of interest.
Acknowledgments This work was supported by Special Fund for Forest Scientific Research in the Public Welfare (201504603) and National Nonprofit Special Fund for Fundamental Research from Research Institute of New Technology of Chinese Academy of Forestry (CAFINT2014K01).
References [1] C. Xing, J. Deng, and S. Y. Zhang, “Effect of thermo-mechanical refining on properties of MDF made from black spruce bark,” Wood Science and Technology, vol. 41, no. 4, pp. 329–338, 2007. [2] B. Wang, A. J. Benitez, F. Lossada, R. Merindol, and A. Walther, “Bioinspired mechanical gradients in cellulose nanofibril/polymer nanopapers,” Angewandte Chemie—International Edition, vol. 55, no. 20, pp. 5966–5970, 2016. [3] Y. Wu, S. Wang, D. Zhou, C. Xing, Y. Zhang, and Z. Cai, “Evaluation of elastic modulus and hardness of crop stalks cell walls by nano-indentation,” Bioresource Technology, vol. 101, no. 8, pp. 2867–2871, 2010. [4] W. Chen, Q. Li, Y. Wang et al., “Comparative study of aerogels obtained from differently prepared nanocellulose fibers,” ChemSusChem, vol. 7, no. 1, pp. 154–161, 2014. [5] C. Wan, Y. Lu, Y. Jiao, J. Cao, Q. Sun, and J. Li, “Preparation of mechanically strong and lightweight cellulose aerogels from
cellulose-NaOH/PEG solution,” Journal of Sol-Gel Science and Technology, vol. 74, no. 1, pp. 256–259, 2015. [6] H. Mertaniemi, C. Escobedo-Lucea, A. Sanz-Garcia et al., “Human stem cell decorated nanocellulose threads for biomedical applications,” Biomaterials, vol. 82, pp. 208–220, 2016. [7] H. M. C. Azeredo, M. F. Rosa, and L. H. C. Mattoso, “Nanocellulose in bio-based food packaging applications,” Industrial Crops and Products, vol. 97, pp. 664–671, 2017. [8] H. Dong, K. E. Strawhecker, J. F. Snyder, J. A. Orlicki, R. S. Reiner, and A. W. Rudie, “Cellulose nanocrystals as a reinforcing material for electrospun poly(methyl methacrylate) fibers: formation, properties and nanomechanical characterization,” Carbohydrate Polymers, vol. 87, no. 4, pp. 2488–2495, 2012. [9] X. M. Dong, T. Kimura, J.-F. Revol, and D. G. Gray, “Effects of ionic strength on the isotropic-chiral nematic phase transition of suspensions of cellulose crystallites,” Langmuir, vol. 12, no. 8, pp. 2076–2082, 1996. [10] A. Isogai, T. Saito, and H. Fukuzumi, “TEMPO-oxidized cellulose nanofibers,” Nanoscale, vol. 3, no. 1, pp. 71–85, 2011. [11] D. J. Gardner, G. S. Oporto, R. Mills, and M. A. S. A. Samir, “Adhesion and surface issues in cellulose and nanocellulose,” Journal of Adhesion Science & Technology, vol. 22, no. 5-6, pp. 545–567, 2008. [12] S. J. Eichhorn, A. Dufresne, M. Aranguren et al., “Review: current international research into cellulose nanofibres and nanocomposites,” Journal of Materials Science, vol. 45, no. 1, pp. 1–33, 2010. [13] D. Klemm, D. Schumann, F. Kramer et al., “Nanocelluloses as innovative polymers in research and application,” Advances in Polymer Science, vol. 205, no. 1, pp. 49–96, 2006. [14] I. Sir´o and D. Plackett, “Microfibrillated cellulose and new nanocomposite materials: a review,” Cellulose, vol. 17, no. 3, pp. 459–494, 2010.
Journal of Nanomaterials [15] U. Henniges, S. Veigel, E.-M. Lems et al., “Microfibrillated cellulose and cellulose nanopaper from Miscanthus biogas production residue,” Cellulose, vol. 21, no. 3, pp. 1601–1610, 2014. [16] K. Abe and H. Yano, “Comparison of the characteristics of cellulose microfibril aggregates of wood, rice straw and potato tuber,” Cellulose, vol. 16, no. 6, pp. 1017–1023, 2009. [17] Q. Cheng, S. Wang, and Q. Han, “Novel process for isolating fibrils from cellulose fibers by high-intensity ultrasonication. II. fibril characterization,” Journal of Applied Polymer Science, vol. 115, no. 5, pp. 2756–2762, 2010. [18] H. Du, C. Liu, Y. Zhang, G. Yu, C. Si, and B. Li, “Preparation and characterization of functional cellulose nanofibrils via formic acid hydrolysis pretreatment and the followed high-pressure homogenization,” Industrial Crops and Products, vol. 94, pp. 736–745, 2016. [19] C. Tian, J. Yi, Y. Wu, Q. Wu, Y. Qing, and L. Wang, “Preparation of highly charged cellulose nanofibrils using high-pressure homogenization coupled with strong acid hydrolysis pretreatments,” Carbohydrate Polymers, vol. 136, pp. 485–492, 2016. [20] A. Naderi, T. Lindstr¨om, and J. Sundstr¨om, “Repeated homogenization, a route for decreasing the energy consumption in the manufacturing process of carboxymethylated nanofibrillated cellulose?” Cellulose, vol. 22, no. 2, pp. 1147–1157, 2015. [21] M. Martelli-Tosi, M. da Silva Torricillas, M. A. Martins, O. B. G. de Assis, and D. R. Tapia-Bl´acido, “Using commercial enzymes to produce cellulose nanofibers from soybean straw,” Journal of Nanomaterials, vol. 2016, Article ID 8106814, 10 pages, 2016. [22] Y. Qing, R. Sabo, J. Y. Zhu, U. Agarwal, Z. Cai, and Y. Wu, “A comparative study of cellulose nanofibrils disintegrated via multiple processing approaches,” Carbohydrate Polymers, vol. 97, no. 1, pp. 226–234, 2013. [23] B. C. Knott, M. F. Crowley, M. E. Himmel, J. Zimmer, and G. T. Beckham, “Simulations of cellulose translocation in the bacterial cellulose synthase suggest a regulatory mechanism for the dimeric structure of cellulose,” Chemical Science, vol. 7, no. 5, pp. 3108–3116, 2016. [24] G. Ji, C. Gao, W. Xiao, and L. Han, “Mechanical fragmentation of corncob at different plant scales: impact and mechanism on microstructure features and enzymatic hydrolysis,” Bioresource Technology, vol. 205, pp. 159–165, 2016. [25] G. Guerriero, J.-F. Hausman, J. Strauss, H. Ertan, and K. S. Siddiqui, “Lignocellulosic biomass: biosynthesis, degradation, and industrial utilization,” Engineering in Life Sciences, vol. 16, no. 1, pp. 1–16, 2016. [26] P. J. Weimer, J. M. Hackney, and A. D. French, “Effects of chemical treatments and heating on the crystallinity of celluloses and their implications for evaluating the effect of crystallinity on cellulose biodegradation,” Biotechnology and Bioengineering, vol. 48, no. 2, pp. 169–178, 1995. [27] T. Eriksson, J. B¨orjesson, and F. Tjerneld, “Mechanism of surfactant effect in enzymatic hydrolysis of lignocellulose,” Enzyme and Microbial Technology, vol. 31, no. 3, pp. 353–364, 2002. [28] M. Henriksson, G. Henriksson, L. A. Berglund, and T. Lindstr¨om, “An environmentally friendly method for enzymeassisted preparation of microfibrillated cellulose (MFC) nanofibers,” European Polymer Journal, vol. 43, no. 8, pp. 3434–3441, 2007. [29] M. P¨aa¨kko, M. Ankerfors, H. Kosonen et al., “Enzymatic hydrolysis combined with mechanical shearing and highpressure homogenization for nanoscale cellulose fibrils and
11
[30]
[31]
[32]
[33]
[34]
[35]
[36]
[37]
[38]
[39]
[40]
[41]
[42]
[43]
[44]
[45]
strong gels,” Biomacromolecules, vol. 8, no. 6, pp. 1934–1941, 2007. L. Segal, J. J. Creely, A. E. Martin Jr., and C. M. Conrad, “An empirical method for estimating the degree of crystallinity of native cellulose using the X-ray diffractometer,” Textile Research Journal, vol. 29, no. 10, pp. 786–794, 1959. Q. Q. Wang, J. Y. Zhu, R. Gleisner, T. A. Kuster, U. Baxa, and S. E. McNeil, “Morphological development of cellulose fibrils of a bleached eucalyptus pulp by mechanical fibrillation,” Cellulose, vol. 19, no. 5, pp. 1631–1643, 2012. W. Stelte and A. R. Sanadi, “Preparation and characterization of cellulose nanofibers from two commercial hardwood and softwood pulps,” Industrial and Engineering Chemistry Research, vol. 48, no. 24, pp. 11211–11219, 2009. R. Parthasarathi, G. Bellesia, S. P. S. Chundawat, B. E. Dale, P. Langan, and S. Gnanakaran, “Insights into hydrogen bonding and stacking interactions in cellulose,” Journal of Physical Chemistry A, vol. 115, no. 49, pp. 14191–14202, 2011. C. Somerville, S. Bauer, G. Brininstool et al., “Toward a systems approach to understanding plant cell walls,” Science, vol. 306, no. 5705, pp. 2206–2211, 2004. K. Igarashi, T. Uchihashi, A. Koivula et al., “Traffic jams reduce hydrolytic efficiency of cellulase on cellulose surface,” Science, vol. 333, no. 6047, pp. 1279–1282, 2011. E.-L. Hult, T. Iversen, and J. Sugiyama, “Characterization of the supermolecular structure of cellulose in wood pulp fibres,” Cellulose, vol. 10, no. 2, pp. 103–110, 2003. C. J. Garvey, I. H. Parker, and G. P. Simon, “On the interpretation of X-ray diffraction powder patterns in terms of the nanostructure of cellulose I fibres,” Macromolecular Chemistry and Physics, vol. 206, no. 15, pp. 1568–1575, 2005. J. Y. Zhu, R. Sabo, and X. Luo, “Integrated production of nano-fibrillated cellulose and cellulosic biofuel (ethanol) by enzymatic fractionation of wood fibers,” Green Chemistry, vol. 13, no. 5, pp. 1339–1344, 2011. A.-C. Engstr¨om, M. Ek, and G. Henriksson, “Improved accessibility and reactivity of dissolving pulp for the viscose process: pretreatment with monocomponent endoglucanase,” Biomacromolecules, vol. 7, no. 6, pp. 2027–2031, 2006. N. Gierlinger, L. Goswami, M. Schmidt et al., “In situ FTIR microscopic study on enzymatic treatment of poplar wood cross-sections,” Biomacromolecules, vol. 9, no. 8, pp. 2194–2201, 2008. ˚ M. Akerholm and N. L. Salm´en, “Interactions between wood polymers studied by dynamic FT-IR spectroscopy,” Polymer, vol. 42, no. 3, pp. 963–969, 2001. J. Guo, K. Song, L. Salm´en, and Y. Yin, “Changes of wood cell walls in response to hygro-mechanical steam treatment,” Carbohydrate Polymers, vol. 115, pp. 207–214, 2015. K. Igarashi, M. Wada, and M. Samejima, “Activation of crystalline cellulose to cellulose IIII results in efficient hydrolysis by cellobiohydrolase,” FEBS Journal, vol. 274, no. 7, pp. 1785–1792, 2007. T. Imai, C. Boisset, M. Samejima, K. Igarashi, and J. Sugiyama, “Unidirectional processive action of cellobiohydrolase Cel7A on Valonia cellulose microcrystals,” FEBS Letters, vol. 432, no. 3, pp. 113–116, 1998. Y.-H. P. Zhang and L. R. Lynd, “Toward an aggregated understanding of enzymatic hydrolysis of cellulose: noncomplexed cellulase systems,” Biotechnology and Bioengineering, vol. 88, no. 7, pp. 797–824, 2004.
12 [46] Y.-S. Liu, J. O. Baker, Y. Zeng, M. E. Himmel, T. Haas, and S.Y. Ding, “Cellobiohydrolase hydrolyzes crystalline cellulose on hydrophobic faces,” The Journal of Biological Chemistry, vol. 286, no. 13, pp. 11195–11201, 2011. [47] J. Jalak, M. Kuraˇsin, H. Teugjas, and P. V¨aljam¨ae, “Endoexo synergism in cellulose hydrolysis revisited,” The Journal of Biological Chemistry, vol. 287, no. 34, pp. 28802–28815, 2012. [48] A. Koivula, T. Kinnari, V. Harjunp¨aa¨ et al., “Tryptophan 272: an essential determinant of crystalline cellulose degradation by Trichoderma reesei cellobiohydrolase Cel6A,” FEBS Letters, vol. 429, no. 3, pp. 341–346, 1998. [49] T. M. Wood and S. I. McCrae, “The purification and properties of the C1 component of Trichoderma koningii cellulase,” Biochemical Journal, vol. 128, no. 5, pp. 1183–1192, 1972. [50] T. Ganner, P. Bubner, M. Eibinger, C. Mayrhofer, H. Plank, and B. Nidetzky, “Dissecting and reconstructing synergism in situ visualization of cooperativity among cellulases,” The Journal of Biological Chemistry, vol. 287, pp. 43215–43222, 2012.
Journal of Nanomaterials
Journal of
Nanotechnology Hindawi Publishing Corporation http://www.hindawi.com
Volume 2014
International Journal of
International Journal of
Corrosion Hindawi Publishing Corporation http://www.hindawi.com
Polymer Science Volume 2014
Hindawi Publishing Corporation http://www.hindawi.com
Volume 2014
Smart Materials Research Hindawi Publishing Corporation http://www.hindawi.com
Journal of
Composites Volume 2014
Hindawi Publishing Corporation http://www.hindawi.com
Volume 2014
Journal of
Metallurgy
BioMed Research International Hindawi Publishing Corporation http://www.hindawi.com
Volume 2014
Nanomaterials
Hindawi Publishing Corporation http://www.hindawi.com
Volume 2014
Submit your manuscripts at https://www.hindawi.com Journal of
Materials Hindawi Publishing Corporation http://www.hindawi.com
Volume 2014
Journal of
Nanoparticles Hindawi Publishing Corporation http://www.hindawi.com
Volume 2014
Nanomaterials Journal of
Advances in
Materials Science and Engineering Hindawi Publishing Corporation http://www.hindawi.com
Volume 2014
Journal of
Hindawi Publishing Corporation http://www.hindawi.com
Volume 2014
Journal of
Nanoscience Hindawi Publishing Corporation http://www.hindawi.com
Scientifica
Hindawi Publishing Corporation http://www.hindawi.com
Volume 2014
Journal of
Coatings Volume 2014
Hindawi Publishing Corporation http://www.hindawi.com
Crystallography Volume 2014
Hindawi Publishing Corporation http://www.hindawi.com
Volume 2014
The Scientific World Journal Hindawi Publishing Corporation http://www.hindawi.com
Volume 2014
Hindawi Publishing Corporation http://www.hindawi.com
Volume 2014
Journal of
Journal of
Textiles
Ceramics Hindawi Publishing Corporation http://www.hindawi.com
International Journal of
Biomaterials
Volume 2014
Hindawi Publishing Corporation http://www.hindawi.com
Volume 2014