Dataset Quality Assessment: An extension for analogy based effort estimation Mohammad Azzeh Department of Software Engineering, Applied Science University, PO BOX 166, Jordan
[email protected]
Abstract Estimation by Analogy (EBA) is an increasingly active research method in the area of software engineering. The fundamental assumption of this method is that the similar projects in terms of attribute values will also be similar in terms of effort values. It is well recognized that the quality of software datasets has a considerable impact on the reliability and accuracy of such method. Therefore, if the software dataset does not satisfy the aforementioned assumption then it is not rather useful for EBA method. This paper presents a new method based on Kendall’s row-wise rank correlation that enables data quality evaluation and providing a data preprocessing stage for EBA. The proposed method provides sound statistical basis and justification for the process of data quality evaluation. Unlike Analogy-X, our method has the ability to deal with categorical attributes individually without the need for partitioning the dataset. Experimental results showed that the proposed method could form a useful extension for EBA as it enables: dataset quality evaluation, attribute selection and identifying abnormal observations.
Keywords: Analogy-Based Software Effort Estimation, Quality of Dataset, Attribute Subset Selection, Kendall Rowwise Correlation.
1. Introduction Software development projects are highly complex processes involving various kinds of risks [13, 18, 19]. Thus, delivering a high quality software product on time and within budget requires a reliable and accurate software effort estimation method [10]. EBA is a commonly used method and viable alternative to other conventional estimation methods [3, 16]. EBA is an analogical reasoning technique that aims at identifying within a historical case base the source projects that are similar to the target project in terms of project description (i.e. attributes) for which their solutions are reused to generate a new solution[13, 24].
The quality of historical dataset is the key component of any effort estimation method [17]. The quality in the context of EBA method means that the dataset should significantly satisfy the fundamental EBA assumption which is “the projects that are similar in terms of their attributes values will also be similar in terms of their effort values”. [24] The aforementioned assumption implies that any attribute is regarded as useful and reliable for prediction only if the ranks of similar source projects with respect to that attribute values should be consistent with ranks of similar source projects with respect to their effort values. This assumption can be tested using Kendall’s row-wise rank correlation between similarity matrix based project attribute values and similarity matrix based effort values.
1
ANGEL [24], which is the most well known EBA system, offers a flexible tool and support for various kinds of attribute selection algorithms and validation techniques within a user friendly GUI tool. Even though, it has no method to test the appropriateness of datasets for EBA. The current method for identifying reliable attribute uses brute-force search which is almost optimized based upon some performance indicators such as MMRE or PRED. These performance indicators are widely regarded as problematic and have many inadequacies as discussed in [11]. In addition, the selected attributes depend on the desired configuration of analogy-based system such as similarity measure, adaptation rules and number of analogies.
Recently, Keung et al. [16] proposed a method called Analogy-X to statistically test the hypothesis of EBA using Mantel correlation. The method utilizes Mantel correlation between distance matrix of attribute values and distance matrix of effort values, following the stepwise procedure. This method has a certain limitation as stated and confirmed by Keung et al. [16], in that it cannot directly deal with the distance matrix of nominal data individually. So it cannot assess the appropriateness of nominal attribute solely, but alternatively by dividing the best continuous attributes into subgroups according to the number of categories in that nominal attribute. This solution removes large number of elements in the matrix, because only matrix elements within the same category are considered in the correlation calculation. As result, the use of nominal attribute requires special treatment, largely due to the nature of similarity matrices formed by categorical variables [16].
In the present paper, we propose a new method that enables us to assess the quality and reliability of software dataset by statistically identifying the attributes and projects that satisfy EBA hypothesis. The proposed method was motivated by the challenges in ANGEL and Analogy-X in addition to the need to improve reliability of EBA method especially when using too many categorical attributes. The resulting method forms as an extension for EBA method which resulted in a new software effort estimation method called EBA +. EBA+ was evaluated against ANGEL [18, 19], and Analogy-X [16], using normalized Euclidian distance and closest analogy. Moreover, six datasets have been used for empirical evaluations: ISBSG [12], Desharnais [7, 8], COCOMO [6, 7], Kemerer [7, 14], Maxwell [7] and Albrecht [1, 7]. The main evaluation results are: (1) the proposed method could form a useful extension for EBA; (2) It is able to identify whether the categorical attribute is indeed appropriate for making prediction or not. (3) It is able to identify reliable attributes and projects through robust statistical procedure.
The rest of the paper is subdivided into 8 sections: section 2 presents overview of EBA method and its assumptions. Section 3 introduces Kendall row-wise correlation and its significance test. Section 4 introduces EBA+ framework. Section 5 presents evaluation criteria used to validate EBA+. Section 6 presents the results obtained from empirical evaluation. Section 7 presents discussion and conclusions.
2. Estimation by analogy and its fundamental assumption
2
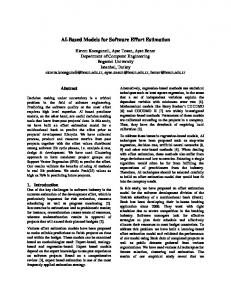
EBA is one of the important estimation methods in software engineering domain which aims to identify solution for a new problem based on previous solutions from the set of similar cases [18, 19, 24]. The general process of basic EBA method as shown in Figure 1 consists of four main stages: 1.
Dataset preparation including attribute selection and handling missing values.
2.
Defining a new project that will be estimated.
3.
Retrieving the analogues of the new project using a predefined similarity function. The common used function is the Euclidean distance function as depicted in Eq. (1).
d(pi , p j )
1 mk 1 (pik , p jk ) m
(1)
where d is the Euclidean distance , m is the number of predictor attributes, Pi and Pj are projects under investigation and:
pik - p jk 2 if feature k is continuous max k - min k (pik , p jk ) 0 if feature k is categorical and pik p jk (2) 1 if feature k is categorical and pik ≠p jk Where value maxk and mink are the maximum and minimum values of attribute k respectively. 4.
Predicting effort of the new project from the retrieved analogues.
Figure 1. Process of analogy based estimation method
The process of EBA method is mainly performed based on the following fundamental assumption: “The projects that are similar in terms of their attributes values will also be similar in terms of their effort values” [24]. The aforementioned assumption has two major issues. The first issue implies that any attribute is regarded as useful for prediction only if it has a strong relationship with the effort, otherwise it is irrelevant [2, 4, 20, 21]. The second issue implies that for any target project the ranks of similar source projects with respect to a specific attribute should be consistent with ranks of similar source projects with respect to their effort values. Both issues can be tested using Kendall’s row-wise rank correlation [25] between similarity matrix based project attribute values and similarity matrix based effort values. In summary, this paper presents a new method to: (1) Test the 3
appropriateness of datasets for EBA method. (2) Identify reliable attributes and (3) Identify abnormal projects that undermine estimation process.
3. Kendall row-wise correlation 3.1 Overview Kendall Rank Correlation was developed by Maurice Kendall in 1938 [15] to measure the degree of correspondence between two sets of ranks given to a same set of objects and assessing the significance of this correspondence. Kendall rank correlation coefficient depends upon the number of inversions of pair of objects which would be required to transform one rank order into another. Kendall rank coefficient of correlation can take values between -1 and +1 corresponding to the range from perfect strong disagreement to perfect strong agreement. If the rankings are completely independent, the Kendall rank coefficient is 0.
For the sake of evaluating EBA assumption we used the alternative method of Kendall rank correlation which is the Kendall rowwise rank correlation (CORR) that measures correlation between two similarity matrices [25] as shown in Eq. (4). This kind of correlation is based upon a weighted sum of the correlations between all pairs of corresponding rows of two similarity matrices, bearing in mind that the diagonal elements are not considered in the calculation. For ranking elements in each individual row, we used mid-ranking technique ("1 2.5 2.5 4") that assigns objects that have equal value the same ranking number, which is the average of what they would possess under ordinal rankings. Figure 2 shows a typical example of two similarity matrices SM(X) and SM(Y) where X12 represents similarity degree between project P 1 and P2 in terms of attribute X. Interestingly, some researchers refer to a similarity matrix (where 1 means two different projects are equivalent with respect to all project factors) and others to a distance matrix (where 1 means two projects are completely different with respect to all project factors). Indeed, however, elements of a similarity matrix are just 1-elements (or reciprocal) of a normalized distance matrix (i.e. Similarity Matrix = 1 – Normalized Distance Matrix)
1 X12 X 21 1 SM(X) X X i2 i1 X n1 X n 2
X1j X1k X1n X 2 j X 2k X 2n 1 1 Xik Xin X nj X nk 1
1 Y12 Y 21 1 SM(Y) Yi1 Yi 2 Yn1 Yn 2
Y1j Y1k Y1n Y2 j Y2k Y2n 1 1 Yik Yin Ynj Ynk 1
Figure 2 General form of two similarity matrices
CORR
sign(X
ij
Xik ) sign (Yij Yik )
i, j,k
sign (X X ) 2 sign (Y Y ) 2 ij ik ij ik i, j,k i, j,k
1
, 2
(4)
4
where i 1,, n; j , k 1, , n ; j k; i k, i j
1 and sign(Xij Xik ) 0 1
Xij Xik Xij Xik Xij Xik
(5)
For example, suppose that there are two similarity matrices SM(X) and SM(Y) using 5 hypothetical projects, as shown in Figure 3. Applying Kendall’s row-wise rank correlation on (SM(X) vs. SM(Y)) resulted in CORR(X) =+0.8667 which indicates strong agreement between attributes X and Y. It is important to note that we use CORR(X) for short to represent Kendall row-wise correlation value between similarity matrix based attribute X and similarity matrix based predictable attribute Y.
SM(X)
p1 p2 p3 p4 p5 p1 1 0.8 0.53 0.67 0.47 p 2 0.8 1 0.33 0.47 0.67 p3 0.53 0.33 1 0.87 0 p 4 0.67 0.47 0.87 1 0.13 p5 0.47 0.67 0 0.13 1
SM(Y)
p1 p1 1 p 2 0.93 p3 0.31 p 4 0.60 p5 0.69
p2 p3 p4 p5 0.93 0.31 0.60 0.69 1 0.24 0.53 0.76 0.24 1 0.71 0 0.53 0.71 1 0.29 0.76 0 0.29 1
Row-wise ranks of SM(X)
Row-wise ranks of SM(Y)
p1 p 2 p3 p4 p5 * 1 3 2 4 1 * 4 3 2 2 3 * 1 4 2 3 1 * 4 2 1 4 3 *
p1 p 2 p3 p4 p5 * 1 4 3 2 1 * 4 3 2 2 3 * 1 4 2 3 1 * 4 2 1 4 3 *
p1 p2 p3 p4 p5
p1 p2 p3 p4 p5
Figure 3. SM(X) vs. SM(Y) and their row-wise ranking orders
3.2 Kendall’s rowwise rank correlation for nominal data Software projects are not only described by numerical attributes, but often with categorical (ordinal and nominal) attributes as well. The way to assess similarity degree for nominal attribute values is kind of comparison: 1 when they are equivalent and 0 otherwise. However, we have seen earlier that Kendall rowwise correlation can work well with numerical attributes, but a common problem occurs when one of the similarity matrices provides a ranking and the other a dichotomy or classification into two classes (like similarity degree between nominal attribute values). In the introduction we mentioned that Analogy-X method cannot directly deal with the distance matrix for nominal data individually. So it cannot assess the appropriateness of nominal attribute individually, but alternatively it can test the impact of nominal attribute by dividing the selected continuous attributes into subgroups according to the number of categories in that nominal attribute. This 5
solution removes large number of elements in the matrix, because only matrix elements within the same category are considered in the correlation calculation. To overcome this challenge, the Kendall rowwise correlation has ability to test the quality of nominal attribute solely without the need to partition the dataset into subgroups. To illustrate how Kendall rank correlation handles this problem, consider the following similarity degrees between different source projects and target project Pt based on nominal attribute Z and predictable attribute Y. Table 1 Similarity degrees between target project p t and other source projects Source project Z Y
p1 1 0.5
p2 0 0.3
p3 1 0.7
p4 0 0.0
p5 1 0.9
p6 1 0.1
p7 0 0.4
p8 1 0.6
Kendall’s correlation assumes that the division into binary is itself ranking. For example, in Table 1 there are 5 ones and 3 zeros for which Kendall’s correlation supposes that the first 5 members of 1’s are tied, and also for the next group of 0’s. According to mid-ranking method, the average of the tied ranks will be 3 in the first group of ties and 7 in the second group of ties, so that the pair of ranking appeared as shown in Table 2. Accordingly, the CORR(Z) is +0.504 which indicates a degree of agreement between their rankings. Table 2 Ranks of similarity degrees in Table 3 Source project Z Y
p1 3 4
p2 7 6
p3 3 2
p4 7 8
p5 3 1
p6 3 7
p7 7 5
p8 3 3
In the following example (shown in Figure 4) we want to investigate the degree of association between similarity matrix based nominal attribute SM(Z) and similarity matrix based predictable attribute SM(Y). The resulted CORR(Z) is 0 which confirms that the nominal attribute Z is not strongly correlated with dependent attribute E. This implies that the nominal attribute Z is not useful if it is taken individually for identifying a similar project, but its effect could be observed if it is combined with continuous or ordinal attributes in the similarity matrix. SM(Z)
p1 p2 p3 p4 p5
p1 p 2 p3 p4 p5 1 1 0 0 0 1 1 0 0 0 0 0 1 0 1 0 0 0 1 0 0 0 1 0 1
SM(Y)
p1 p2 p3 p4 p5
p1 1 0.93 0.31 0.60 0.69
p2 p3 p4 p5 0.93 0.31 0.60 0.69 1 0.24 0.53 0.76 0.24 1 0.71 0 0.53 0.71 1 0.29 0.76 0 0.29 1
Figure 4 Kendall’s rowwise correlation between SM(Z) vs. SM(Y)
3.3 Significance test for Kendall row-wise rank correlation The significance test of Kendall rowwise correlation is a primary source of information about the reliability of the correlation and therefore the reliability of the dataset for EBA method. It is usually tested by using a permutation test, at a significance level of 5% [25]. The original correlation value is compared with the correlation values found by randomly generating a set of permutations of the rows (and simultaneously of the columns) for one of the two matrices, and calculating the value of correlation (CORR) for each permutation. 6
The significance of the observed value of the statistic is then assessed by calculating the proportion of values as large as or larger than original correlation value, i.e. right tail probability [25].
The reason for this procedure is that if the null hypothesis of no correlation between two matrices cannot be rejected, then permuting the rows and columns of the matrix should be equally likely to produce a larger or similar correlation coefficient. However, using this permutation we can test whether the value of Kendall’s rowwise rank correlation derived from the original pair of similarity matrices is significantly different from zero. If so, then we can be sure that the fundamental assumption of EBA is true, which consequentially suggests using that attribute(s). The required number of permutations to accomplish significance test is not limited irrespective of existing some recommendations. The default configuration recommends 1000 permutations for estimating the significance level of about 0.05 and 5,000 permutations for estimating significance level of about 0.01 [22].
4. The EBA+ method EBA+ framework utilizes Kendall row-wise rank correlation and its significance test to determine the appropriateness of the dataset under consideration, which implicitly includes selecting reliable attributes and removing abnormal projects. The EBA+ framework will test the following hypothesis: H0 (null hypothesis): The dataset is not reliable for EBA. H1 (alternative hypothesis): The dataset is reliable for EBA. The EBA+ framework cannot reject null hypothesis in the following two cases: (1) when no attribute satisfies hypothesis of EBA, and (2) when all projects are abnormal. Otherwise the null hypothesis is rejected and the dataset is reliable for EBA. The work flow of this process can be further illustrated in Figure 5. To integrate abnormal project identification process with attribute selection process, we suggest first performing the attribute selection and then performing abnormal project identification process. If significantly abnormal projects are detected remove them and update the reduced dataset. The application of EBA+ method requires a robust measure to estimate the precision of correlation coefficient for each attribute. Therefore we used Bootstrapping method [9] that draws samples randomly with replacement from the empirical distribution of data to estimate the shape of a statistic’s sampling distribution. Bootstrapping is a non-parametric statistical method for deriving confidence intervals and estimates of standard errors for different estimates such as the correlation coefficient, regression coefficient, mean, median or proportion [9]. One issue with the bootstrapping method is that the theory relies on datasets being random samples from a welldefined population. This assumption is probably not true for software project datasets but it probably will not make much practical difference. The training function used in our case is the Kendall rowwise correlation (CORR) for the drawn samples as shown in Eq. (6). Given a distribution of n samples from Bootstrapping training, the overall Kendall correlation value ( r ) is calculated as shown in Eq. (6). The r will be used thereafter to represent Kendall rowwise correlation instead of CORR.
7
r
1 CORR (i) n i
(6)
The corresponding upper and lower confidence interval limit (UCL and LCL) of Kendall correlation coefficient can be approximated by using BCa method (BCa stands for Bias-corrected and accelerated). BCa [9] is a reliable method to derive confidence interval especially when the distributions are skewed. The UCL and LCL is calculated using Eqs. (7) and (8).
z o z 0.025 LCL z o 1 a(z o z 0.025 )
(7)
zo z0.975 UCL zo 1 a(zo z0.975 )
(8)
Where z o is the bias-correcting constant, which is the standard normal deviate corresponding to the proportion of bootstrap estimates which are less than or equal to the estimate from the original sample. Φ represents the cumulative distribution of the standard normal function. is the desired level of significance eg. 0.05. z is the -percentile of a standard normal distribution.
The EBA+ method as shown in Figure 5 consists of three stages as follows: Stage 1: The process of EBA+ starts with testing every attribute individually. For each attribute X, the Kendall row-wise correlation between SM(X) and SM(Effort) is computed. Then all attributes that their similarity matrices are significantly correlated with similarity matrix of project effort are selected. If no one attribute is selected then the dataset is not entirely reliable and does not satisfy the hypothesis of EBA. In this case the algorithm should terminate and no need to continue. If only one attribute is selected then this attribute is considered as the reliable one, then move to stage 3. Otherwise, if the number of attribute is greater than one then move to stage 2.
8
Historical Dataset
Select Attribute
Correlation Assessment
Significant?
Yes
Reduced Dataset
No Yes
Has more attributes?
No Stop, No reliable attributes
Size=0
Size of reduced dataset?
Size=1 Abnormal projects identification
Size>1
Make combination & identify the best attributes
Reliable Dataset
Figure 5 illustration of EBA+ Stage 2: 1.
Identify the best significant attribute from stage 1 for which r is greatest (say Best).
2.
For the remaining selected attributes, calculate a similarity matrix for each attribute in combination with Best. If the best Kendall rowwise correlation obtained is less than or equal to r (Best) and CI is wider than CI(Best), stop and use Best alone for EBA.
3.
If the best Kendall rowwise correlation obtained is greater than r (Best) and CI is narrower than CI(Best), choose that attribute and call that new set of attributes Y. The justification for that having a narrow confidence interval implies high precision whilst a wide interval implies poor precision.
4.
Steps 2 and 3 are repeated by adding one attribute at a time, until maximum Kendall correlation and narrower CI are obtained. The produced dataset from this stage is called Reduced Dataset (RD1).
Stage 3: The aim of stage is to detect the abnormal projects that do not satisfy the hypothesis of EBA in RD1. Once the abnormal projects are identified they are removed from the reduced dataset. To perform this stage, the similarity matrix of RD1 is constructed first; say SM(RD1) in which each row contains similarity degrees between a target project and other source projects. Then the significance of correlation for each pair of the corresponding rows in both SM(RD1) and SM(Effort) is computed. If the correlation is insignificant then the target project of that row is removed from RD1. This procedure is performed for all projects in RD1. To better understand the EBA+ we provide the pseudo code in Figure 6. 9
// input: Dataset D // output: ReducedDataset RD nprem=1000 //Number of permutations nSample=1000 //number of bootstrapping samples nProjects //number of projects in the dataset SM(E)=FindSim(Effort) // construct similarity matrix of effort values All=[]; //stage 1: Find individual significant attributes Foreach attribute X in the dataset D FOR i=1 to nSamples Ri← Draw(X)//Draw a resample with replacement from the attribute X. SM(Ri)←FindSimMatrix(Ri) //construct similarity matrix of X CORR[i]←KendalRowWise(SM(Ri),SM(E)) END r (X)←mean(CORR) CI(X)←Distribution(CORR);//compute conf. interval of X (UCL- LCL) pval(X)←permute(SM(X), SM(E), r (X ) , nPrem) IF(pval(X) CI(X)) || r (Y) < r (Best)) Y←Y-All[j] END Best=Y End RD1=Best //stage 3: Abnormal project detection SM(RD1)←FindSimMatrix(RD1); For idx=1 to nProjects Corr←KendalRowWise(SM(RD1)[idx], SM(E)[idx]) pvalue←permute(SM(RD1)[idx], SM(E)[idx], Corr, nPrem) IF(pvalue 0.05. The results obtained confirm that attributes Size and Nlan are still the most influential attributes with an improved correlation coefficient r (Size and Nlan) =0.344. No further abnormal project cases exist in the dataset which in this case, the obtained data from this combination are the most influential attributes and will be used to generate new estimates. However, the null hypothesis is rejected and the reduced dataset is reliable for EBA method.
To investigate the effectiveness of the reduced dataset on the prediction accuracy, we made a comparison against attributes identified by ANGEL and Analogy-X. For the sake of validation we used only the closest analogy. Running ANGEL and Analogy-X yielded different attribute combinations in that the ANGEL identified the same attributes of EBA+, while Analogy-X identified only one attribute which is (Size). The significant difference between EBA+ and ANGEL is the ability of EBA+ to identify abnormal projects. In other words, the attributes identified by ANGEL are not necessarily reliable as much as they are only predictive. Unlike ANGEL which continues to generate predictions regardless of reliability of the dataset, EBA+ and Analogy-X attempt to search for the robust attributes that have sound statistical significance. In addition, if one attempts to find the best attributes based on optimizing PRED(25), it may obtain the best PRED(25) but not always the best MMRE and vice versa. This explains why relying on MMRE or PRED(25) could not be the best solution to search for best attributes as the prediction accuracy can be measured by various performance indicators. Therefore it is reasonable to believe that the combination of attributes Size and Nlan will be useful for EBA regardless of whichever performance indicator is used. However, the comparison of prediction accuracy based upon using EBA+, ANGEL, and Analogy-X methods are shown in Table 4. The predictive performance results show that the EBA+ produced better accuracy than other methods in terms of all performance indicators. Table 4 Prediction accuracy comparison for Maxwell dataset Algorithm ALL EBA+ ANGEL Analogy-X 1
Best Attribute set ALL Size and Nlan (with three projects removed P4, P12 and P20) Size and Nlan Size
MMRE 182.0 51.64
PRED(25)% 9.6 25.4
MdMRE 72.25 38.2
65.83 90.7
20.96 22.6
40.93 58.2
According to dataset available at PROMISE website 13
The Boxplot of absolute residuals in Figure 7 and Wilcoxon sum rank significance test indicate that the difference between the predictions generated based on attributes identified by EBA+ and those based on Analogy-X are statistically significant (p-value=0.02). This means that there is difference between their predictions. In contrast, the predictions generated by EBA+ and ANGEL are insignificant (p-value=0.32) which means that the predictions generated by both methods are approximately similar. The insignificant results confirm that the EBA+ method can find the best predictive attributes and projects based on external measure (i.e. Kendall correlation) not like ANGEL which is optimized based on internal measure(i.e. MMRE). This comes to conclude that EBA+ has the ability to identify significantly, with justification, the reliable data that produces comparable but necessarily reliable results.
Figure 7 Box-plot of absolute residuals of prediction using EBA+, Analogy-X, and ANGEL for Maxwell dataset
6.3 Albrecht dataset The Albrecht dataset contains 24 software projects developed using third generation languages such as COBOL, PL1, etc. The dataset is described by one dependent attribute called 'work hours' which represents the corresponding effort in 1000 hours, and six independent numeric attributes as shown in Table 5. 18 projects were written in COBOL, 4 projects were written in PL1 and the rest were written in database management languages. Two projects have effort values more than 100,000 hours which are twice larger than third largest project. These extreme projects have considerable negative impact on prediction but we preferred to keep them in spite of their potential bad consequences. Table 5 Albrecht dataset description Attribute
Description
KLOC Line of code AFP Adjusted Function Points INC Count of input functions OC Count of output functions INQ Count of query functions FC Count of file processing RawFP Raw Function Points *: correlation is significant at 0.05
r
p-value
LCL
UCL
+0.43* +0.52* +0.182* +0.496* +0.142* +0.236* +0.49*
0.001 0.001 0.001 0.001 0.006 0.001 0.001
0.38 0.44 0.086 0.410 0.086 0.179 0.423
0.490 0.584 0.243 0.552 0.195 0.284 0.533
14
The results of stage 1 of EBA+ indicate that all attribute similarity matrices were significantly correlated with the effort similarity matrix (i.e. p-value < 0.05) as shown in Table 5. The strong correlated similarity matrix from stage 1 was obtained by AFP with Bootstrap estimator r (AFP) =+0.52 and CI=[0.44 0.584] which indicates a strong positive agreement between AFP and effort. The stage 2 found that the similarity matrix of (AFP, INQ and KSLOC) attribute together produced correlation coefficient value larger than r (AFP) with Bootstrap estimator of correlation r (AFP INQ KSLOC) 0.53 and a narrower confidence interval. The abnormal project identification process revealed that the two projects (P5 and P21) are considered significantly abnormal with p-value > 0.05. The results obtained confirm that attributes AFP, INQ and KSLOC are still the most influential attributes, with an improved correlation coefficient r (AFP INQ KSLOC ) 0.54 . No further abnormal project cases exist in the dataset which in this case, the obtained attributes from this combination are the most influential attributes and will be used to generate new estimates. The obtained results thus reject the null hypothesis and consider that the dataset is reliable for EBA.
However, ANGEL identified four predictive attributes (INQ, FC, KSLOC, AFP), while Analogy-X identified only one attribute as predictive attribute which is (RawFP). No projects have been removed by both algorithms. Interestingly, there are two attributes that are common between EBA+ and ANGEL which shows the importance of these two attributes. In contrast, there is no any attribute in common between Analogy-X and others. Comparisons of prediction accuracy based upon using EBA+ and other (ANGEL, Analogy-X) attributes selection approaches are shown in Table 6. The results obtained demonstrate that predictions generated using EBA+ are nearly more accurate than others in terms of MMRE and PRED(25). Also the attributes identified by ANGEL produced better MMRE value than Analogy-X that produced worst predictions and even worse than using all attributes with MMRE=97.8%. The main reason may be that ANGEL attempts to search for attribute based on optimizing MMRE, therefore the MMRE obtained by ANGEL is regarded as the best value can be achieved.
Table 6 Prediction accuracy comparison for Albrecht dataset Algorithm ALL EBA+ ANGEL Analogy-X
Best Attribute set ALL AFP+INQ+KSLOC (with removed (P5 and P21)) INQ+FC+KSLOC+AFP RawFP
two
projects
MMRE 71.0 59.2
PRED(25)% 29.16 41.67
MdMRE 38.9 33.2
63.5 97.8
33.33 44.1
38.9 29.17
Since MMRE is not widely recommended to compare between prediction models [14], we used Boxplots of absolute residuals and Wilcoxon sum rank test to investigate whether the differences in absolute residuals of predictions are statistically significant.
15
Figure 8 Box-plot of absolute residuals of prediction using EBA+, Analogy-X, and ANGEL for Albrecht dataset
Table 7 Wilcoxon sum rank test for Albrecht dataset Algorithms EBA+ Vs. ANGEL EBA+ Vs. Analogy-X
p-value 0.783 0.881
Rank sum 576 582.5
The results obtained in Table 7 and Figure 8 indicate that the difference between predictions generated based on attributes identified by EBA+ and those based on ANGEL and Analogy-X are statistically insignificant (p-value > 0.05). Furthermore, there is sufficient evidence that all predictions using different combinations of attributes are approximately similar. This comes to conclude that EBA+ has the ability to identify significantly, with justification, the optimal attribute subset that produces comparable accuracy.
6.3.1
Kemerer dataset
The Kemerer dataset [7] includes 15 software projects described by 6 attributes and one predictable attribute which is measured in 'man-month'. The 6 attributes are represented by 2 categorical and 4 numerical attributes. A similar procedure to the previous case study was applied to Kemerer dataset. The EBA+ identified 4 significant correlated similarity matrices based attributes: KSLOC, AdjFP, RawFP and Language individually. This confirms that the dataset has reliable attributes that satisfy hypothesis of EBA. The strong significant correlated similarity matrix was obtained by attribute AdjFP with r (AdjFP ) =+0.336 and CI=[0.1612 0.4491]. It is interesting to note that the categorical attribute Language was also significant with p-value < 0.05 which indicates that the EBA+ is able to identify whether the categorical attribute is reliable for predictions or not. In the final step of EBA+ stage 2 we found that the similarity matrix based on combination of AFP and Language was stronger correlated than best correlated attribute AFP with r (AdjFP Language ) 0.346 and narrower CI. The abnormal project identification process revealed that the two projects (P5 and P12)1 are considered significantly abnormal. The results obtained confirm that attributes AdjFP and language are still the most 16
influential attributes, with an improved correlation coefficient r (AdjFP Language ) 0.352 . No further abnormal project cases exist in the dataset. The attribute selected using EBA+ in here is different to the attributes selected by ANGEL that identified two attributes: Language and KSLOC, and Analogy-X that identified only AdjFP as predictive reliable attribute. However it is reasonable to believe that the combination of attributes Added, AdjFP and Language will be useful for EBA. We can also notice that the categorical attribute Language is common between EBA+ and ANGEL, while attribute AdjFP is common between EBA+ and Analogy-X. This means that the attributes identified by EBA+ are also selected by ANGEL and Analogy-X which is an indication of their importance to effort prediction. Table 8 Prediction accuracy comparison for Kemerer dataset Algorithm ALL EBA+ ANGEL Analogy-X
Best Attribute set ALL AdjFP + Language (with two projects removed (P5 and P12)) Language + KSLOC AdjFP
MMRE 73.7 56.6
PRED(25)% 26.7 44.6
MdMRE 55.2 33.3
63.8 68.1
40.0 20
33.3 55.2
From Table 8, likewise Albrecht dataset, the best prediction accuracy was obtained by EBA+ in terms of MMRE and PRED(25) and MdMRE. As mentioned earlier, the target is to select the attributes that have sound statistical significance rather than optimizing based on some performance indicators. To assert that, Wilcoxon statistical sum rank test confirmed that the difference is not statistically significant as shown in Table 9 and Figure 9. From the results obtained, differences in absolute residuals of predictions between EBA+ and ANGEL are statistically insignificant, which means that median of both samples is not significantly different and their estimates are approximately similar.
Figure 9 Box-plot of absolute residuals of prediction using EBA+, Analogy-X, and ANGEL for Kemerer dataset
17
Table 9 Wilcoxon sum rank test for Kemerer dataset Algorithms EBA+ Vs. ANGEL EBA+ Vs. Analogy-X
6.3.2
p-value 0.454 0.983
Rank sum 251 231.5
Desharnais dataset
The Desharnais dataset originally consists of 81 software projects collected from Canadian software houses [7]. This dataset is described by 10 attributes, two dependent attributes which are duration and the effort measured in 'person-hours', and 8 independent attributes. Unfortunately, 4 projects out of 81 contain missing values therefore we excluded them because they may be misleading the estimation process. This data pre-processing stage resulted in 77 complete software projects.
The first stage of EBA+ method identified five significant influential attributes, namely: Transactions, Entities, RawFP, AdjFactor, AdjFPs and Dev.Env, for which their similarity matrices are statistically significant and correlated with effort similarity matrix. Although some attributes are not strongly correlated, they are significant as confirmed by permutation test. For example, similarity matrix based Dev.Env attribute is not strongly correlated with similarity matrix based effort with r (Dev.Env) =+0.086, but the significance test indicates that similarity matrix is significant and should be considered. So if the fitness criterion is the correlation coefficient only, then other attributes can be considered as influential attribute regardless of their significance. However, to ensure which attributes are more reliable for EBA, the significant attributes are then transferred into the next step in order to identify any possible attribute combination that are strong correlated than best individual attribute which is AdjFP with r (AdjFP ) = +0.278 and CI=[0.2287
0.3173]. The next step identified AdjFP,
and Dev.Env are the most influential attributes with r (AdjFP Dev.Env) 0.312 which is larger than
r (AdjFP ) . The abnormal project identification process revealed that the three projects (P38, P70 and P76)1 are considered significantly abnormal. The results obtained confirm that attributes AFP and Dev.Env are still the most influential attributes, with a slightly improved correlation coefficient r (AdjFP Dev.Env) 0.332 , and no further abnormal project cases exist in the reduced dataset. To conclude the reduced model with selected attributes and projects are reliable to generate estimates using EBA.
Table 10 Prediction accuracy comparison for Desharnais dataset Algorithm ALL EBA+ ANGEL Analogy-X
Best Attribute set ALL AdjFP+Dev.Env (with removed projects P76, P70 and P38) AdjFP + Dev.Env AdjFP+Dev.Env (with a removed project P77)
MMRE% 60.1 36.0 38.2 37.9
PRED(25)% 31.2 46.75 42.9 43.4
MdMRE% 41.7 30.5 30.8 30.4
Unsurprisingly, ANGEL and Analogy-X also identified the same two influential attributes but with one abnormal project being removed by Analogy-X. Validation of analogy prediction using EBA+ best attributes, ANGEL and Analogy-X are given in Table 10. Although all methods identified exactly the same attributes but 18
EBA+ beats ANGEL and Analogy-X in terms of MMRE because three abnormal projects were removed from the dataset. These results are also confirmed by Wilcoxon sum rank test on absolute residuals of predictions and Boxplots of residuals as shown in Table 11 and Figure 10 respectively. The results show also that the predictions generated by either of those attribute combinations will produce very similar estimates with p-value > 0.05, which indicates that the differences are not statistically significant. Furthermore, the median of absolute residuals of EBA+ in Figure 10 is much smaller than other which confirms better predictions produced by EBA+.
Figure 10 Box-plot of absolute residuals of prediction using EBA+, Analogy-X, and ANGEL for Desharnais Table 11 Wilcoxon sum rank test for Desharnais Algorithms EBA+ Vs. ANGEL EBA+ Vs. Analogy-X
6.3.3
p-value 0.287 0.264
Rank sum 5210 5170
COCOMO dataset
The dataset COCOMO [7] was frequently used for validating various effort estimation methods. It includes 60 software projects that are described by 17 attributes in conjunction with an actual effort. The actual effort in the COCOMO dataset is measured by person-month which represents the number of months that one person needs to develop a given project. Despite the fact that the COCOMO dataset are now over 25 years old, it is still commonly used to assess the accuracy of new techniques.
Following a similar procedure with the previous cases above on COCOMO dataset, EBA+ identified 5 significant correlated attributes from stage 1 are: TOOL, DATA, TURN, CPLX and LOC. The top significant attribute was LOC with r (LOC) =0.6925 with CI=[0.6640 0.7147]. Applying stage 2 of EBA+ attribute selection on the significant correlated attributes resulted in identifying the similarity matrix based combination of LOC, TOOL and TURN as the most influential attributes with improved correlation coefficient
r (LOC TOOL TURN ) 0.72 which is larger than r (LOC) and with narrower CI.
19
The abnormal project identification process revealed that the three projects (P14, P54 and P57)1 are considered significantly abnormal. The results obtained confirm that attributes LOC, TOOL and TURN are still the most influential attributes with no further abnormal project cases exist in the dataset.
Validation of analogy predictions using ANGEL obtained attributes (TIME, VEXP and LOC), EBA+ reliable attributes (TURN, TOOL and LOC) and Analogy-X best attribute (LOC) are presented in Table 12. The results of EBA+ are better than ANGEL and Analogy-x in terms of MMRE and PRED(25). This is confirmed by Wilcoxon sum rank significance test which shows that the differences between absolute residuals of predictions are statistically insignificant as shown in Table 13. Figure 11 Shows that EBA+ generates good estimates with absolute residuals skewed to zero.
Table 12 Prediction accuracy comparison for COCOMO dataset Algorithm ALL EBA+ ANGEL Analogy-X
Best Attribute set ALL TURN+TOOL+LOC (with 3 removed projects (P14, P54 and P57)) TIME+VEXP+LOC LOC
MMRE% 64.3 26.9
PRED(25)% 38.33 56.7
MdMRE% 38.1 21.5
29.4 44.9
50.0 36.7
25.8 34.9
Table 13 Wilcoxon sum rank test for COCOMO Algorithms EBA+ Vs. ANGEL EBA+ Vs. Analogy-X
p-value 0.64 0.39
Rank sum 3542 3247
Figure 11 Box-plot of absolute residuals of prediction using EBA+, Analogy-X, and ANGEL for COCOMO 6.3.4
ISBSG dataset
The ISBSG Repository (Release 10) [12] currently contains more than 4,000 software projects gathered from different worldwide software development companies. All projects involved in the ISBSG repository are described by several numerical and categorical attributes. In order to assess the efficiency of the proposed 20
similarity measures on software cost estimation we have selected a subset of attributes. Since many projects have missing values, only 575 projects with quality rating “A” are considered; 9 useful attributes were selected, 8 of which are numerical attributes and one is a categorical attribute. The selected attributes are: Adjusted Function Points (AFP), Input Functions (INC), Output Functions (OUC), Enquiry Functions (EQC), Count of Files (FILE), Interface Functions (INF), Added Functions (ADD), Changed Functions (CHC), and categorical attribute Resource Level (RSL).
In this section we investigate the effectiveness of EBA+ on the large ISBSG dataset. As in other datasets we applied EBA+ on ISBSG dataset, the first stage identified 6 significant correlated similarity matrices based on: AFP, OUC, INF, ADD, CHC and RSL individually. The best correlated attribute was r (OUC) 0.314 with CI=[0.223 0.413]. It is interesting to note that the similarity matrix based on categorical attribute RSL (identified also by ANGEL), presents a stronger correlation than other continuous attributes such as INC and EQC. This indicates the capability of EBA+ to identify the more influential attribute, either continuous or categorical.
The significant attributes are then transferred to the next stage in order to identify the best attribute combination, if exists. In this stage, it is found that the similarity matrix based attribute combination: AFP, OUC, INF and ADD produced a correlation value larger than r (OUC) 0.314 , with r (AFP OUC INF ADD ) 0.334 and narrower CI. Therefore these attributes are regarded as the reliable predictive attributes. Furthermore, no abnormal projects have been identified. However, it is interesting to note that ANGEL identified 6 predictive attributes as shown in Table 14, while Analogy-X identified just two predictive attributes: “AFP” and “ADD”. In order to compare the results of different attribute selection algorithms, the best attribute subset obtained from each algorithm is then validated in terms of all performance indicators. For prediction accuracy comparison we used 10-fold cross-validation because the use of Jackknife is computationally far too intensive for a large dataset. The corresponding predictions accuracies in Table 14 show unsurprisingly that prediction accuracy of EBA+ is comparable to ANGEL, and is better than prediction accuracy of Analogy-X. So we come to conclude that although the inclusion of relevant information affected the estimates, and consequently affected the level of prediction accuracy positively, but also the model acceptance is actually increased because the procedure of selection has a strong statistical background.
Table 14 Prediction accuracy comparison for the ISBSG dataset Algorithm ALL EBA+ ANGEL Analogy-X
Best Attribute set ALL AFP+OUC+INF+ADD INC+OUC+FILE+INF+ADD+CHC AFP+ADD
MMRE% 74.4 65.7 59.2 70.6
PRED(25)% 35.8 44.2 43.4 39.6
MdMRE% 43.8 32.3 34.2 39.4
21
Figure 12 Box-plot of absolute residuals of prediction using EBA+, Analogy-X, and ANGEL for ISBSG The significance test based on Wilcoxon sum rank test (shown in Table 15) suggests that the differences in predictions between EBA+ and ANGEL, Analogy-X are insignificant. Further, Figure 12 shows that the absolute residuals of predictions generated by either of those attribute combinations will produce similar estimates, indicating that the differences are not statistically significant.
Table 15 Wilcoxon sum rank test for ISBSG Algorithms EBA+ Vs. ANGEL EBA+ Vs. Analogy-X
7
p-value 0.321 0.853
Rank sum 249780 251342
Discussion and Conclusions
Quality of dataset that satisfies main assumption of an estimation model is very important for reliable effort predictions. EBA has fundamental hypothesis that governs the estimation process which assumes: The projects that are similar in terms of projects descriptors are also similar in terms of project effort values. This hypothesis implies that any attribute is regarded as reliable for prediction only if it has a strong relationship with the effort, otherwise it is irrelevant. Also it implies that for any target project the ranks of similar source projects with respect to a particular attribute should be consistent with ranks of similar source projects with respect to their effort values. Based on above assumptions we developed a new method to test quality of dataset using Kendall row wise correlation for EBA. Much of the initial work on EBA+ was motivated by experiences with software effort estimation using analogy and based upon the ANGEL toolset developed in [24] and Analogy-X developed by Keung et al.[16]. ANGEL’s attribute selection techniques have the limitation of being tightly coupled with the actual results, but provide no statistical evidence that the attributes satisfy fundamental hypothesis of EBA. On the other hand, Analogy-X cannot assess the relevancy of nominal attributes individually; however this can be done after identifying best numerical attributes and then partitioning dataset into subgroups according to the number of categories by only considering matrix elements of cases within the same group. However this approach for handling nominal attributes is not efficient, and removes a large number of matrix elements in the similarity matrix. Therefore EBA+ is designed to overcome the main limitations of ANGEL and Analogy-X. 22
The proposed method consists mainly of two processes, the first one attempts to select all reliable attributes that significantly satisfy EBA hypothesis, whilst the second process attempts to identify abnormal projects that undermines estimation process. If the test procedure of EBA+ failed to identify any reliable attributes (i.e. null hypothesis cannot be rejected) then the dataset is no longer reliable to generate predictions using EBA. However, using Kendall’s row-wise rank correlation gives a clear picture of how ranks of closest projects to the target project are considered important in judging which attribute is more reliable and influential than others. The results derived from EBA+ can be used to assess whether analogy is indeed appropriate for the given dataset or not. EBA+ method can be easily incorporated into any analogy estimation tools such as ANGEL [24], as an extension or a plug-in. The fundamental procedures can be fully automated in the tools, and would not be visible to the user other than to advise the user when analogy was not appropriate for the dataset under investigation. In summary, EBA+ functionality are:
It assesses the appropriateness of a specific dataset for EBA.
It provides a statistical mechanism for attribute subset selection.
It is able to identify the appropriateness of categorical attributes for EBA.
It provides a statistical mechanism to identify abnormal projects within a dataset.
It has been shown that EBA+ greatly improves the performance of EBA. EBA+ works at a preliminary stage in an analogy-based system, the dataset preparation and evaluation level. There is no doubt that an evaluation system at this level significantly influences the later process and thus the prediction outcome. Performance studies on six established datasets indicated that EBA+ is highly competitive when compared with ANGEL’s brute-force search and Analogy-X algorithms in term of prediction accuracy and statistical significance. Furthermore, EBA+ scales well if compared with ANGEL’s brute-force searching algorithm with regards to computation power. However, results showed that EBA+ may take longer to compute than expected especially when dealing with large datasets such as ISBSG because of the Bootstrapping procedure which is computationally far too intensive. Further research is necessary to assess the overall efficiency and performance of EBA+ on datasets with many categorical attributes. In the future work, we will extend EBA+ to include attribute weighting derivation. We will also study the problem of using categorical data as nominal and ordinal scale data type and their impact on attribute weighting. 8
Acknowledgements The authors are grateful to the Applied Science Private University, Amman, Jordan, for the financial support granted to this research project.
9
References 1.
S.J. Albrecht, J. R. Gaffney, Software function, source lines of code, and development effort prediction: A software science validation, IEEE Transactions on Software Engineering 9 (1983) 639– 648.
23
2.
3. 4.
5. 6. 7.
8. 9. 10. 11. 12. 13. 14. 15. 16. 17.
18.
19.
20.
21. 22. 23. 24. 25.
M. Azzeh, D. Neagu, P. Cowling, Fuzzy Feature subset Selection for Software Effort Estimation, International workshop on software predictors PROMISE'08 (part of ICSE'08), Leipzig, Germany, 2008a, pp.71-78. M. Azzeh, D. Neagu, P. Cowling, Software Project Similarity Measurement based on Fuzzy c-Means, International Conference on software process, Leipzig, Germany, 2008b, pp. 123-134. M. Azzeh, D. Neagu, P. Cowling, Software Effort Estimation Based on Weighted Fuzzy Grey Relational Analysis, 5th International conference on software predictors PROMISE'09 (co-located with ICSE'09) Vancouver, Canada, 2009a, ACM International Conference Proceeding Series archive, Article number 8. M. Azzeh, D. Neagu, P. Cowling, Fuzzy grey relational analysis for software effort estimation, Journal of Empirical software engineering (2009b) DOI. 10.1007/s10664-009-9113-0. B. Boehm, Software engineering economics, Prentice Hall, Englewood Cliffs, NJ, 1981. G. Boetticher, T. Menzies, T. Ostrand, PROMISE Repository of empirical software engineering data http://promisedata.org/ repository, West Virginia University, Department of Computer Science, (visited 2 August 2009). Desharnais, J.M. (1989), Analyse statistique de la productivitie des projects informatique a partie de la technique des point des function, PhD thesis, Univ. of Montreal. T.J. DiCiccio, B. Efron (1996) Bootstrap confidence intervals (with Discussion). Statistical Science, 11, 189-228. N. Fenton, S.L. Pfleeger, Software metrics: a rigorous and practical approach, PWS Publishing Co. Boston, 1997. T. Foss, E. Stensrud, B. Kitchenham, I. Myrtveit, A simulation study of the model evaluation criterion MMRE, IEEE Transactions on Software Engineering, (2003), 985-995. ISBSG, International Software Benchmarking standards Group, Data repository release 10, web site: http://www.isbsg.org, 2007. G. F. Kadoda, M. Cartwright, M. J. Shepperd, Issues on the Effective Use of CBR Technology for Software Project Prediction. ICCBR, 2001, pp. 276-290 C. F. Kemerer, An empirical validation of software cost estimation models, Comm. ACM 30 (1987) 416–429. M.G. Kendall, J.D. Gobbons, Rank Correlation Methods (5th edition). London: Arnold 1990. J. Keung, B. Kitchenham, D. R. Jeffery: Analogy-X: Providing Statistical Inference to Analogy-Based Software Cost Estimation. IEEE Trans. Software Eng. 34(4): 471-484 (2008). B. Kitchenham, E. Mendes, Why comparative effort prediction studies may be invalid, 5th International conference on software predictors PROMISE'09 (co-located with ICSE'09) Vancouver, Canada, 2009a, ACM International Conference Proceeding Series archive, Article number 4. C. Kirsopp, M. Shepperd, Case and Feature Subset Selection in Case-Based Software Project Effort Prediction, Proceedings of 22nd International Conference on Knowledge-Based Systems and Applied Artificial Intelligence (SGAI'02), 2002. C. Kirsopp, M. J. Shepperd, J. Hart, Search Heuristics, Case-based Reasoning and Software Project Effort Prediction, Proceedings of the Genetic and Evolutionary Computation Conference, 2002, pp. 1367-1374. J. Li, G. Ruhe, Multi-criteria Decision Analysis for Customization of Estimation by Analogy Method AQUA+, In: International workshop on software predictors PROMISE'08 Leipzig, Germany, 2008, pp. 55-62. J. Li, G. Ruhe, Analysis of attribute weighting heuristics for analogy-based software effort estimation method AQUA+. Journal of Empirical Software Engineering (2007) 13, 63-96. Manly, B. F. J. (1998), Multivariate Statistical Methods - A Primer, Chapman & Hall/CRC. E. Mendes, I. Watson, C. Triggs, N. Mosley, S. Counsell, A comparative study of Cost Estimation models for web hypermedia applications, Journal of Empirical Software Engineering 8 (2003)163-193. M. J. Shepperd, C. Schofield, Estimating Software Project Effort Using Analogies, IEEE Transaction on Software Engineering 23 (1997), 736-743. H. D. Vries, The rowwise correlation between two proximity matrices and the partial rowwise correlation, The Psychometric Society, 58:1, (1993), 53-69
24