International Journal of Smart Grid and Clean Energy
An improved statistical time series method for voltage violation quantification in residential distribution network with small wind turbines and battery electric vehicles Chao Long*, Donald M. Hepburn, Mohamed E.A. Farrag, Chengke Zhou School of Engineering and Built Environment, Glasgow Caledonian University, Cowcaddens Road, UK. G4 0BA
Abstract The probabilistic power flow method has previously been used for voltage violation quantification in residential distribution networks (RDNs) with small wind turbines (SWTs) and battery electric vehicles (BEVs). An improved statistical time series approach is developed in this paper to account for factors which impact on system conformity. In addition to consideration of variations in wind speed over time and BEV charging, using a statistical time series approach, the novel method takes into account variations in system load caused by the randomness of load switching by customers. The method has been applied to a generic UK distribution network. Results show that the proposed method provides a closer indication of daily probability distribution of voltage violations in a RDN, based on physical data, than the previous statistical time series approach. Keywords: Battery electric vehicles, probability distribution, small wind turbines, time series, voltage violation
1. Introduction Increasing penetration of electric vehicles (EVs) and distributed power generating equipment, such as small wind turbines (SWTs), has been evident in residential distribution networks (RDNs) [1], [2]. The impact of the changes resulting from additional demand and generation capability will affect operation of RDNs. Voltage violation tends to be one of the dominant constraints or critical factors that limit a distribution network’s ability to incorporate SWTs and EVs [3]-[5]. Due to the intermittent characteristics of wind speed, the resultant time-variations in SWT output will change either, or both, magnitude and direction of network power flow. The randomness of EV charging events, through plugging into a RDN, will impact on power required from the RDN grid connection point. The changes in power flowing through the cables as a result of localized power generation and battery charging will impact on voltage drop through the system. The lack of predictability of the power generation and charging load requirements introduce difficulties in evaluating voltage violation in RDNs. According to Engineering Recommendation G83/1, a distributed generation (DG) unit rated up to 16 A per phase can be connected to distribution networks [6]. In this paper SWTs in RDNs refer to singlephase wind turbines of this type, i.e. at 230 V a.c. they are rated less than 3.68 kVA. In relation to gridconnected EVs, there are two primary types: battery EV (BEV) and plug-in hybrid EV (PHEV). For simplicity, this paper only considers BEVs. In the UK, for systems above 50V and below 1kV, unless otherwise agreed, voltage variations between ±10% of nominal voltage are permitted. For the purposes of this paper when the voltage at any node of a distribution network breaches the statutory limits it is considered a voltage violation. Due to the inherent variability in system loads and in SWT outputs, the application of a time series approach to power flow analysis can be advantageous [7]-[11]. The time series analysis is a method
* Manuscript received May 16, 2013; revised August 6, 2013. Corresponding author Tel.: +44(0)141 331 3453; E-mail address:
[email protected].
30
International Journal of Smart Grid and Clean Energy, vol. 3, no. 1, January 2014
applied to execute power flow analyses in a set of time series with specific values of system load and generation for each time step [7]. For detailed analysis, a time window with a period of a day or a week is usually utilized. However, the specific time windows cannot provide a global picture of voltage violation of the network under study. Although several studies have executed power flow analysis by using the extreme conditions of minimum load and maximum DG output, e.g. [12] and [13], they failed to take into account the likelihood of the violation occurring. Therefore, it has been considered worthwhile to approach the voltage violation problem in a statistical manner. The probabilistic power flow (PPF) method has been employed for voltage variation study of a distribution network in many previous works [14]-[18]. The PPF calculation can be divided into a numerical method, e.g. Monte Carlo simulation, and an analytical method. Using the Monte Carlo technique is computationally intense, a large number of simulations, e.g. 20,000, are required. To reduce the computational burden, the PPF calculation was performed with statistical distribution of loads and generations in [14]-[16]. A statistical model of wind generation was developed in [14], but the variation in load was not considered. In [15] and [16], the statistical distributions of wind generation in winter and summer were integrated to the network with winter and summer loads, respectively, but the timevariations in loads and wind speeds were not considered. A statistical time series method was developed in [18], and the time variations in wind speeds and BEV charging were considered. At different times of day, the wind speeds were discretized and considered in a statistical manner, a deterministic value of load following a typical daily load profile was assumed for each time instant, but the randomness of load switching by customs was not considered. To develop the approaches previously taken, in addition to the consideration of time-variations in wind speeds and BEV charging in statistical time series approach, the improved method models the variations in system load caused by the randomness of load switching by customers. As a result, simulations using the proposed method are shown to provide results of probability distribution of voltage violations in a RDN which are closer to results based on physical data than using the statistical time series approach. 2. Modeling In RDNs containing SWTs and BEVs, node voltages related to active and reactive power flow in branches can be obtained via steady-state power flow analysis. Power flow in RDNs depends on the instantaneous injection of electrical power from SWTs and the sum of individual electrical demands from customers. SWT generator outputs and loads should be modeled prior to the power flow analysis.
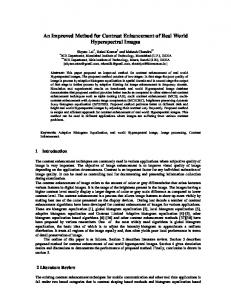
Fig. 1. The probabilistic distribution of SWT output, M=10.
2.1. Statistical SWT model Due to the intermittent characteristic of wind speed, SWT output is neither continuous nor stable. To calculate the likely power output from a given SWT it is necessary to understand the wind behavior in the location under consideration. The Weibull distribution function is widely used to statistically describe the wind speed distribution, e.g. [14], [19]. The statistical SWT model used in [18] is employed in this work. All wind speed data at a specific instant is differentiated into discrete values. With a given SWT power
Chao Long et al.: An improved statistical time series method for voltage violation quantification…
31
output curve, discrete SWT output and the corresponding probabilities of the SWT output can be obtained from (1): FG {PG (i), FG (i): i 0,1, 2, ... , M }
(1)
where power PG(i) has M+1 states at which the probability of PG(i) is calculated from the discrete wind speeds and the SWT power output curve and FG(i) is the probability of SWT output for the ith SWT output value, as shown in Fig.1 M has been taken as 10. 2.2. Statistical model of load profile In [18], a typical residential load profile was extracted based on historical UK load data. At a specific time instant, a deterministic load value following the typical load profile was taken, so that the voltage violation under typical load conditions can be obtained. However, the load at a time instant varies in a random manner due to the variability of load switching by customers. In this paper the load has been considered as a random variable. Load data at the same time instant of day have been differentiated into discrete values. The probability distribution of the discrete values can be expressed by equation (2) In [18], a typical residential load profile was extracted based on historical UK load data. At a specific time instant, a deterministic load value following the typical load profile was taken, so that the voltage violation under typical load conditions can be obtained. However, the load at a time instant varies in a random manner due to the variability of load switching by customers. In this paper the load has been considered as a random variable. Load data at the same time instant of day have been differentiated into discrete values. The probability distribution of the discrete values can be expressed by equation (2) In [18], a typical residential load profile was extracted based on historical UK load data. At a specific time instant, a deterministic load value following the typical load profile was taken, so that the voltage violation under typical load conditions can be obtained. However, the load at a time instant varies in a random manner due to the variability of load switching by customers. In this paper the load has been considered as a random variable. Load data at the same time instant of day have been differentiated into discrete values. The probability distribution of the discrete values can be expressed by equation (2):
FL {L(l ), FL (l ): l 1, 2, ... , W }
(2)
where L(l) is the discrete value of the load, at a time instant, and W is the number of the discrete values. FL(l) is the corresponding probability of load at discrete value L(l). 2.3. Probabilistic model of BEV charging load The BEV charging load model presented in [2] is adopted in this paper. The load due to BEV charging is determined by several factors: the battery type, the initial state-of-charge (SOC) (residual capacity since last charge) and the start time of BEV charging. The lithium-ion battery selected for this work is based on that used in the Nissan Altra; it has recently undergone a rapid improvement in performance characteristics and an increase in popularity [20]. The power demand and related battery SOC profile of the battery has been taken from [21]. The power demand during a battery charging process is scattered with values PE(j) taken in constant time intervals from the curve of a battery charging profile. The corresponding power levels of BEV charging load are expressed using equation (3):
PE ( j )
PE (( j 1)t ) PE ( j t ) , j 1, 2, ... , nc 2
(3)
where PE is the function of a battery charging power demand profile, nc is the number of intervals in the profile, Δt is the constant time interval. Using discretized values of the BEV charging load, following the method in [2] and [18], the probability distribution of the discrete values can be expressed by (4):
{PE ( j), ( PE ( j)) : j 1, 2, ... , nc }
(4)
32
International Journal of Smart Grid and Clean Energy, vol. 3, no. 1, January 2014
where PE(j) is the discrete value of BEV power demand, nc is the number of the discrete values, and ( PE ( j )) is the corresponding probability of power demand at value PE(j). Based on the statistical analysis in [2], the probability distribution function (pdf) of the initial SOC was obtained. From this data, the initial SOC of private BEVs has a mean of 72% after one day’s travel and 44% after two-day’s travel. Thus, BEVs in a residential area are assumed to be charged every other day on average. The time at which a BEV is plugged in for charging depends on resident’s choice: three domestic BEV charging schemes were employed in [2], uncontrolled charging, off-peak charging and smart charging. For simplicity, this paper assumes uncontrolled domestic charging, and that the charging start time is uniformly distributed over four hours (from 18:00 to 21:59). Therefore BEV charging will only impact on loading of a RDN between 18:00 and 3:00 the next day. 3. Formulation The voltage at each node of a RDN must be maintained within the rated range:
Vx min Vx Vx max x N
(5)
where Vx is the voltage at the xth node, and Vxmin and Vxmax are the minimum and maximum allowable voltage levels. 3.1. Calculation of probability of voltage violation For simplicity two assumptions are made: firstly, the wind speed at any given time is the same for all SWTs in the small-scale area of the RDN; secondly, all BEV batteries in the network have an identical charging characteristic. During the times when there are no BEV charging loads in the RDNs, voltages of the network depend on the original network load and SWT output. For SWT power output, assume P(i) < P(i+1), 0 ≤ i ≤ M-1; regarding load data, assume L(l) Vxmax
{
0.2
Vx