Available online at www.sciencedirect.com
ScienceDirect Energy Procedia 105 (2017) 3213 – 3218
The 8th International Conference on Applied Energy – ICAE 2016
An information provision system as a function of HEMS to promote energy conservation and maintain indoor comfort Kanae MATSUIa,b, * b
a Tokyo Denki University, Ishizaka, Hatoyama, Hiki-gun, Saitama Prefecture, 350-0394, Japan Graduate School of Media Design, Keio University, Hiyoshi Kohoku-ku Yokohama-city Kanagawa, 223-8526, Japan
Abstract This study proposes an information provision system that displays customized information according to the user’s indoor comfort preferences, as one of the functions of home energy management systems (HEMS). HEMS mainly focus on energy efficiency, yet indoor comfort should also be considered for residents because they are likely to maintain indoor comfort even if it incurs a cost. Recently developed HEMS collect various types of data using networked sensors. These data can be utilized for creating an index of short-term indoor comfort called the predicted mean vote (PMV). This study implemented an information provision system to help identify worthwhile information from stored data according to PMV preferences. The information suggests ways to reduce electricity consumption whilst maintaining indoor comfort. To test the system’s applicability, it was installed in three households, and an experiment was conducted over 12 days in winter. When the system was used, electricity consumption was reduced by 5.15% and comfort level, which expressed by PMV, increased by 42.3%. Qualitative results show that indoor comfort increased by 16.4% with system use. In addition, this study compared the provision of random information to users versus information selected according to PMV preferences. The specially selected information was more effective in both reducing electricity consumption and increasing indoor comfort. © 2017 The Authors. Published by Elsevier Ltd. This is an open access article under the CC BY-NC-ND license © 2016 The Authors. Published by Elsevier Ltd. (http://creativecommons.org/licenses/by-nc-nd/4.0/). Selection and/or peer-review of under responsibility of ICAE Peer-review under responsibility the scientific committee of the 8th International Conference on Applied Energy. Keywords: Energy efficiency; Information provision; Home Energy Management Systems; Indoor comfort; Data sensing
1. Introduction Energy consumption in residential areas has been increasing in recent years in Japan [1]. Home energy management systems (HEMS) have the potential to reduce consumption by contributing to energy efficiency. However, installing HEMS is expensive and the technology is not yet widely diffused [2]. This is partly because HEMS do not consider maintaining indoor comfort as a priority, although residents tend to want indoor comfort, even if they incur a cost for it. HEMS collect not only energy consumption data in
* Corresponding author. Tel.: +81-49-296-6154; fax:+81-49-296-6185. E-mail address:
[email protected]
1876-6102 © 2017 The Authors. Published by Elsevier Ltd. This is an open access article under the CC BY-NC-ND license (http://creativecommons.org/licenses/by-nc-nd/4.0/). Peer-review under responsibility of the scientific committee of the 8th International Conference on Applied Energy. doi:10.1016/j.egypro.2017.03.705
3214
Kanae Matsui / Energy Procedia 105 (2017) 3213 – 3218
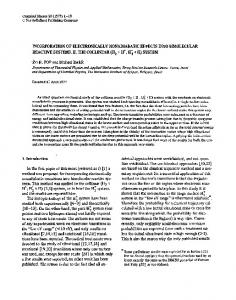
Fig. 1. Proposed system overview
near real-time but also many other types of data such as indoor temperature, humidity, and luminance for prediction of energy usage. This study utilized these data for calculating predicted mean vote (PMV), which is an index of indoor comfort [3]. The proposed system consists of two main functions: to sense various data using networked sensors for calculating PMV and to store the data and select suitable information from the database, which is displayed as a webpage for users. In addition, users can select whether or not the provided information is suitable for them. To test the applicability of the system, an experiment was conducted for 12 days in winter, a season during which indoor comfort is usually lower. 2. Related works The roles of HEMS have widened from energy efficiency to include home security and health care, because HEMS collect various types of data that can be utilized not only for energy efficiency but also for detecting levels of indoor comfort. Maintaining indoor comfort is necessary for residents, because they are likely to prefer being relaxed in their homes even if that means incurring a cost. To widen the diffusion of HEMS, maintaining indoor comfort will need to be one of the key factors of use. To maintain indoor comfort, PMV, obtained through calculations involving environmental data (temperature, humidity, luminance, and wind speed) and physical data (activity mass and amount of clothes), is utilized [4]. Values of PMV are widely used in architecture, where PMV defines that comfort zone from −0.5 to 0.5 [5]. Therefore, PMV was collected and used to try to help maintain indoor comfort and change behaviors towards reducing electricity consumption during this study [6]. In addition, PMV is different for each resident, even those within the same home; therefore, this system determined a resident’s comfort level based on their answers to a web-based questionnaire. 3. System description The proposed system consists of two main functions. Fig. 1 illustrates an overview of the system, which collects environmental and physical data by networked sensors and smartphones and provides information according to each resident’s PMV preference.
3.1. Data sensing To collect electricity consumption, environmental, and physical data for calculating PMV values, networked sensors of electricity consumption were attached to a switchboard and the environmental data
3215
Kanae Matsui / Energy Procedia 105 (2017) 3213 – 3218
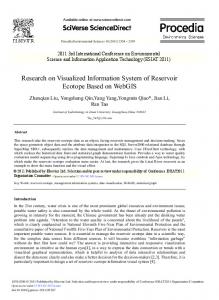
(temperature, humidity, and luminance) of a room are sent at 1 min intervals via 920 MHz communication to a Linux server. Physical data and wind speed were collected by a web-based questionnaire that the user could access at 15 min intervals, following a notification sent by e-mail to their smartphones. The residents answered questions about their comfort status in a particular room on a fivepoint scale, and then they evaluated whether or not the provided information (a selection of data readings from the sensors in the room) was useful. The collected data was sent to a Linux server, which was connected to a Wi-Fi router in the home, on which a web application server to provide the web-based questionnaire function was installed. The server sends the information to a central server in the university via the Internet, providing a backup of the data. Fig. 2 shows the Linux server and the environmental and networked electricity consumption sensors. 3.2. Information provision There are two main components to information provision. The first is to determine PMV preference from four categories: (A) a person who is sensitive to heat, (B) in accordance with the PMV value, (C) a person who is sensitive to cold, and (D) not in accordance with the PMV value. The second is to provide information, stored in the database, and create a circulation of information provision with the results of the evaluations from each user via the webpage. Firstly, the PMV preference is extracted following an explicit method using equation (1), based on k-means clustering [7]. N K
P= Σ Σ rnk Xn − μ k
2
(1)
n=1 k=1
According to equation (1), P indicates the user’s PMV preference, N denotes cold, and K denotes hot. The ranges of N and K indicate the range of the comfort zone. If P is close to N, the comfort type will be (A) a person who is sensitive to heat. Meanwhile, if P is a value between N and K, the type will be (B) in accordance with the PMV value. If P is close to K, the type will be (C) a person who is sensitive to cold, and if P is discrete, the type will be (D) not in accordance with the PMV value. After clustering the PMV preferences, 80 items of information in four main categories are delivered to the user. Users evaluate the provided information, and then weighting factors are applied using the frequency distribution described in equation (2).
Σ
k
mi f i
i=1
n
=
m1 f1 + m2 f 2 + ... + mk f k f1 + f1 + ... f k
(2)
The rate of frequency is used to select the provision of the next piece of information [8]; each piece of information has tags connecting it to other information items, such as PMV types, similar targets for electricity appliances, and other issues related to scheduling in the household.
Fig. 2. Key components of the information-gathering system
3216
Kanae Matsui / Energy Procedia 105 (2017) 3213 – 3218
Table 1. Participant information and PMV types Participant
House type
Location
Sex of resident
Age of resident
# of residents/house
PMV type
TP-1
Apartment
Tokyo
Male
30
2
D
TP-2
Apartment
Tokyo
Female
30
2
D
CP-1
Detached house
Chiba
Male
60
3
B
CP-2
Detached house
Chiba
Female
60
3
B
CP-3
Detached house
Chiba
Female
30
3
B
SP-1
Detached house
Shizuoka
Male
70
2
A
SP-2
Detached house
Shizuoka
Female
70
2
C
4. Experiment To test the system’s applicability, it was installed in three households TP, CP, and SP during 12 days in winter (February 15 to 26, 2016). The first six days were used for clustering PMV preferences (period X), and the next six days were used for an ABAB test, with information provided randomly during period A (3days) and information selected according to the PMV provided during period B (3days). Table 1 shows the PMV preferences of participants as determined by the data collected during period X using equation (1). During the experiment, smartphones that were delivered to all participants were used to answer the questions. 5. Evaluation The system was evaluated quantitatively, using data on electricity consumption comparing period X with periods A and B and comparing period A with period B, and qualitatively, using web-based questionnaires comparing A to B. 5.1. Quantitative results Fig. 3 shows electricity consumption and PMV values in period X and period A and B. The daily electricity consumption of all three households was 5.15% lower during period A and B than during period X. Household TP consumed 12.2 kWh per day during period X, which was reduced by 5.85% during period A and B. Households CP and SP consumed 8.25 and 14.3 kWh per day during period X, respectively, which decreased by 3.43 and 6.16% during period A and B. In addition, approximately 2.70% electricity consumption reduction occurred during period B. Next, the PMVs in periods A and B were compared to evaluate whether random or selected information was better for maintaining PMV values within the comfort zone. Comfort levels in period B increased 42.3%, excluding the three participants who were already in the comfort zone of PMV values. These results show that both reducing electricity consumption and maintaining the comfort zone were accomplished. In conclusion, the information provision helped to reduce the electricity consumption and maintain the indoor comfort, and customized information according to PMV preference was more effective at this compared with random information provision.
3217
Kanae Matsui / Energy Procedia 105 (2017) 3213 – 3218
Fig. 3. (a) Energy consumption and (b) PMV values throughout the study period
5.2. Qualitative results A web-based questionnaire about user satisfaction with indoor comfort was used to provide qualitative data. The users were asked to classify their indoor comfort on a five-point scale. Table 2 shows the results regarding the participants’ comfort satisfaction during periods X, A, and B. All participants were satisfied with the indoor comfort 16.4% compared with period X (without the information provision) and period A and B (with information provision). With information provision, satisfaction was increased compared to period X, where no information was provided. Satisfaction also increased from period A to period B. Therefore, the information tailored to the user’s PMV preference was effective in maintaining indoor comfort. 6. Conclusion and remarks This study focused on an information provision system for both reducing electricity consumption and maintaining indoor comfort with information provision to change the residents’ behaviors. To accomplish both purposes, a system with two main functions is proposed. One is a sensing function, which senses electricity consumption, environmental (temperature, humidity, luminance, and wind speed), and physical data (activity mass and amount of clothes) to calculate PMV values. The electricity consumption and PMV value data were used for evaluation and for selecting the information from the database to provide to the user. The second function is to select information to provide to the user via the webpages. Table 2. Participant satisfaction with indoor comfort throughout the study period, as assessed by web-based questionnaire Participant
Comfort satisfaction during period X (%)
Comfort satisfaction during period A (%)
Comfort satisfaction during period B (%)
TP-1
76.2
78.2
78.5
TP-2
67.5
81.4
80.4
CP-1
81.2
92.3
91.0
CP-2
56.2
57.3
58.3
CP-3
32.5
60.2
60.5
SP-1
81.3
84.3
83.9
SP-2
56.3
70.1
70.3
3218
Kanae Matsui / Energy Procedia 105 (2017) 3213 – 3218
The answers to the web-based questionnaire were used to select information to display, and then the users were divided into four patterns. After dividing the clusters, the information related to PMV preference was provided to each user. To test the applicability of the system, the experiment was conducted in three households, with seven people total, for 12 days in winter. The experimental days were divided into period X, when baseline data on electricity consumption, PMV, and PMV preference were collected, and periods A and B, when information provision started according to the user’s PMV preference. The main difference between period A and B was that random information was provided during period A, and during period B, information selected according to the user’s PMV preferences was provided. Electricity consumption decreased by 5.15% in period A and B from period X, and 2.70% electricity consumption reduction occurred during period B, when the customized information was provided. In addition, the comfort level increased by 42.3% when the system was used, compared to when it was not in use. When comparing provision of random and selected information, the information selected according to PMV preference was more effective in both reducing electricity consumption and maintaining indoor comfort. Acknowledgements This work was supported by Funds for the Integrated Promotion of Social System Reform and Research and Development, MEXT, Japan; MEXT/JSPS KAKENHI Grant (B) Number 15K16094; and the Research Institute for Science and Technology of Tokyo Denki University Grant Number Q16J-06/Japan. References [1] Ueno T, Sano F, Saeki O, Tsuji K. Effectiveness of an energy-consumption information system on energy savings in residential houses based on monitored data. Appl Energy 2006;83(2):166–83. [2] Gao J, Xiao Y, Liu J, Liang W, Chen, CLP. A survey of communication/networking in Smart Grids, Future Gener Comput Syst 2012;28(2):391–404. [3] Ito M, Nishi H. A practical case study of HVAC control with MET measuring in HEMS environment. Industrial Electronics Society, IECON 2013—39th Annual Conference of the IEEE, IEEE, 2013, p. 8136–41. [4] Ito M, Nishi H. Real-time METs estimation for effective indoor amenity control in HEMS. 2013 IEEE International Symposium on Industrial Electronics (ISIE), IEEE, 2013, p. 1–6. [5] Yao R, Li B, Liu, J. A theoretical adaptive model of thermal comfort—Adaptive Predicted Mean Vote (aPMV). Build Environ 2009;44(10):2089–96. [6] Fukuta M, Ito M, Yamaguchi F, Nishi H. Construction of HEMS in Japanese cold district for reduction of carbon dioxide emissions. IECON 2014—40th Annual Conference of the IEEE Industrial Electronics Society, IEEE, 2014, p. 5338–43. [7] Celebi M, Emre K, Hassan A, Vela PA. A comparative study of efficient initialization methods for the k-means clustering algorithm. Expert Syst Appl 2013;40(1):200–10. [8] Tague-Sutcliffe J. An introduction to informetrics. Inf Process Manag 1992;28(1):1–3.
Biography Kanae MATSUI is an assistant professor in the Division of Information System Design at the School of Science and Engineering, Tokyo Denki University, and a researcher at the Graduate School of Design, Keio University. Her research field is sensor networks and utilization of sensed data, including secondary use.