Available online at www.sciencedirect.com
Procedia Environmental Sciences 10 (2011) 2354 – 2359
2011 3rd International Conference on Environmental www.elsevier.com/locate/procedia Science and Information Application Technology (ESIAT 2011)
Research on Visualized Information System of Reservoir Ecotope Based on WebGIS Zhenqian Liu, Yongsheng Qin,Yang Yang,Yongmin Qiao*, Jian Li, Ran Tao Institute of hydrobiology in Jinan University, Guangzhou,China 510632 a
[email protected]
Abstract This research take the reservoir ecotope data as an object, facing reservoir management and decision-making. Saves the space geometric object data and the attribute data integration to the SQL Server2000 relational database through SuperMap SDX+, subsequently realizes the data management and maintenance. Uses JFreeChart technology, with which realizes the historical data front end statistical graph demonstration function. Provides a way to water quality evaluation model sequencing using Java programming language, Supermap Is Java controls and Ajax technology, by which make the reservoir ecotope evaluation more easier. At last, the research gives the Liuxi River reservoir as an example to show the main function and the visual effect.
© 2011 Published by Elsevier Ltd. Selection and/or peer-review under responsibility of Conference ESIAT2011 © 2011 Published by Elsevier Ltd.under Selection and/or peer-review under responsibility of [name organizer] Organization Committee. Open access CC BY-NC-ND license. Key Words: reservoir ecotope, management information systems, data visualization, WebGIS, statistical graph
Introduction In the 21st century, water crisis is one of the most prominent global resources and environment issues; potable water safety is also concerned by the whole world. As the threat of environmental pollution is growing in intensity for the moment, the Chinese government has been already put the drinking water problem into agenda. “Attention to the water quality is concerned about the livelihood of the people", which is clearly emphasized in National Eleventh Five-Year Plan of Environmental Protection and the consultative paper of National Twelfth Five-Year Plan of Environmental Protection. Reservoir is the most important potable water sources. It is essential to manage the reservoir ecotope data in a scientific way, for the complex data comes from different sources. It will become worthless “information garbage” without do that. But how could we? The answer is providing interactive and responsive visualization environment as intuitive as the human eyes[1], in a way to express the data connection or trends with a visualized graphical representation, which is helpful to analysis of data interactive relationships and dissect the data more clearly and also make a better decision for the decision-makers [2,3]. Therefore, it is particularly important to design a set of reservoir ecotope information visual system [4].
1878-0296 © 2011 Published by Elsevier Ltd. Selection and/or peer-review under responsibility of Conference ESIAT2011 Organization Committee. Open access under CC BY-NC-ND license.
doi:10.1016/j.proenv.2011.09.367
Zhenqian Liu et al. / Procedia Environmental Sciences 10 (2011) 2354 – 2359
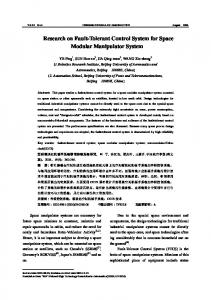
1 System design and development 1.1 The source data of reservoir area eco-environment First, map data, including the spatial and attribute data. Vector format electronic map involves reservoir basin administration boundary map, the watershed map, traffic map, water system map, water sampling sites, towns and rural areas distribution map, etc. Raster format electronic map contains digital elevation mode. Secondly, reservoir information data, including hydrological data, water quality data as well as model data. Among them, hydrological data involves water temperature, precipitation, flow, water level, storage capacity in the past years. Water quality data contains TN, total P, water transparency, pH, ammonia nitrogen, etc. Model data involves water environment quality evaluation data, eutrophication evaluation data, etc. Finally, multimedia data, including reservoir plankton, aquatic animal, water pollution, reservoir restoration cases and a lot of texts, pictures, videos about reservoir management laws and regulations. 1.2 System development environment and software platform The software development environment in this system consists of J2EE, Supermap IS Java, Mirosoft SQL Server2000 and Supermap Deskpro. ArcIMS, GeoMedia, MapXtreme, GeoBeans, GeoSurf and SuperMapIS. Which are widely used in the software platform of WebGIS at the present time. Among these, SuperMap IS Java is better, because of its ascendant capability, such as facing the Internet distributed computing technology, supporting cross network application system integration or providing SuperMap IS Java WebControl, by which can realize most function of GIS. 1.3 Structural design The system applies Browse/Server structure as shown in figure 1. In the B/S three structures, the client is only responsible to transmit the request and unconnected with the database directly. The functions of the interlayer are program monitoring, safety management, data calculation and processing, etc, which make it more efficient and lower cost with the comparison to traditional two structures, particularly in Intemet/Intranet environment, this excellence become much more obviously.
Fig.1 Structural design of the system
1.4 Function design The system designed five function modules according to the characteristic of reservoir ecotope data and the client realistic needs. Firstly, GIS function module realizes map information basic manipulation like layer editing, layer controlling and so on. Secondly, information query function module. You can query almost you can about reservoir information data conveniently. Thirdly, database management function module, which realizes four fundamental operations on the data comprise data adding, modifying, deleting and checking. Fourthly, multimedia display module provide a good way to client who want to
2355
2356
Zhenqian Liu et al. / Procedia Environmental Sciences 10 (2011) 2354 – 2359
know reservoir plankton, aquatic animal, water pollution, reservoir management laws and regulations or something like that. Fifthly, export function module, with which allows clients to output or print map, statistical graph, etc. In addition, the users could taste of our system through the Internet. 1.5 Key technology 1.5.1 Add SuperMap IS Java MapControl SuperMap IS Java MapControl is applied to display or manipulate map. In order to actualize the function, we followed three steps. First, found a JSP document in the project folder, named demo.jsp, and then add to the JSF citation. Last but not least, put the accession codes behind the that shows in demo.jsp. 1.5.2 JFreeChart open sources module The system utilizes JFreeChart technology by which gets data from database and puts it in Dataset, a category in JFreeChart module. Several subclasses will be used in displaying histogram or curve graph, for instance, Default.Category.Dataset ǃ XYSeries ǃ XYSeriesCollection, etc. The main codes for implementing the function were correspondingly written . 1.5.3 To achieve asynchronous relevance calculation based on AJAX The system utilized AJAX to carry on asynchronous interchange, when users input storage capacity, proportion or water level; the corresponding results will be showed right away without waiting. The function was carried on by writing the codes. 1.5.4 Data Visualization The system can convert environmental information into text, maps, pictures and other multimedia to display, and maps can provide users with window, zoom, hierarchical display functions. This system not only implement the management of spatial information, graphics, images and other forms of information, but also greatly enhance the performance of information. Through pictures, literature and other comprehensive presentation, it shows a comprehensive picture of the profile of the ecological environment of reservoir intuitively and vividly. This system uses JSP language to develop the front page mainly. JSP page is made up of HTML codes and some Java codes. After the page is requested by the client, the server will deal with the JSP code in the page and then will return to the client browser by generating the HTML page. JSP has some characteristics which belong to Java technology mainly for the internet-oriented. They are easy to use, fully object oriented, platform independent, secure and so on. 2 Central function and application We concerned about the gross composition of the system above, and then the research will give a case study of Liuxi River reservoir for the purpose of displaying its central function and visual efficiency. 2.1 The mutual interface of the system
Zhenqian Liu et al. / Procedia Environmental Sciences 10 (2011) 2354 – 2359
Fig.2 The home page
Fig.3 The page of reservoir area water
environment quality evaluation While users log into the system successfully, you will see the home page with flexible changed windows as shown in Fig.2. On the left, there are functional windows and the five primary function modules. In the middle of the page, you could see the map display window with status window below, foldable toolbar on the right, navigation and results display window on the upper right corner. On the right, there is layer control window. The system has finished some basic function of the map such as zoom in, zoom out, pan, etc, and some advanced function such as spatial query, navigation, etc. 2.2 Reservoir area water environment quality evaluation and application The water environment quality evaluation model include: single factor water quality evaluation index and multi-factor water quality evaluation index. The latter contains arithmetic mean algorithm, weighted mean method and geometrical-mean method. If you plan to get information from the database, choose to enter sampling date or sites, or input data by yourself. The system produces national water quality
2357
2358
Zhenqian Liu et al. / Procedia Environmental Sciences 10 (2011) 2354 – 2359
standard of surface water (GB3838—2002) and it will show you the evaluation results as you wish. The page showed in Fig.3. 2.3 Reservoir area water eutrophication assessment models The water eutrophication assessment models comprise trophic status indices, method of point rating and biological indicator method. Users could select one in consideration of the actual conditions. The assessment data saved in SQL Server database, to get it, just enter the sampling date or import personally. 2.4 Graphical display on web browser The system provides the fundamental hydrological information of Liuxi River reservoir, including water temperature, precipitation, flow, water level, storage capacity, reservoir area, evaporation, groundwater and so forth during the year 1959-2006. The client could obtain the information in statistical graph by time query as well as the connection among water level, storage capacity, reservoir area, since the system
Fig.4 the histogram of monthly rainfall in a year
Fig.5 the curve line between water level and storage capacity
has produced the models. If you enter one value and the two others will be shown in curve line, just as shown in Fig.4 and Fig.5. 3 Outlooks Reservoir undertakes the subordinate basin flood control, water storage, irrigation, water supply, regulating the ecological balance and so on. On the one hand along with the rapidly industrial and agricultural development of China, industrial wastewater and life wastewater is increasing. In addition to the people's awareness of environmental protection and lack of the ecological environment system tolerance capability understanding and study, as a result, human activities intensify on the reservoir ecosystem will greatly accelerated the process of eutrophication[5], on the other hand if a large number data that reflects the ecological environment quality of the reservoirs ineffectively management, the potential value of the data will be buried[6,7]. The reservoir ecotope information visual system based on WebGIS has developed and successfully applied to the reservoir, which realizes ecological environmental quality information visual expression, and uses the model designed to explore knowledge in data, the system eventually achieve the purpose of service management. In conclusion, data visualization technology in management information system applications will certainly become a research focus. Acknoeledgement This paper is written based on an environmental management information system project. I sincerelly thank my cooperators who work with me in the project team. Then are Guang Deng, Liang Li, etc. I am
Zhenqian Liu et al. / Procedia Environmental Sciences 10 (2011) 2354 – 2359
not able to accomplish the mission without their selfless help. I appreciate the help from the SuperMap Software Co., Ltd. who permitted us using the software of Super Map. * author for Correspondence: Tel:86-20-85223445; Email:
[email protected]. References [1] Nahum D.Gershon, Stephen G.Eick.IEEE Computer Graphics and Applications Vol.7-8(1997), p.29-31. [2] Qin Fenglin. Journal of Chinese Education Network Vol.6(2009): 40-41. [3] R.M. Argent, J.-M. Perraud, J.M. Rahman, R.B. Grayson, G.M. Podger.Environmental Modelling & Software Vol.24(2009), p.809-818 [4] Stephen Cranefield, Martin Purvis. Advances in Environmental Research Vol.5 (2001) p.319-325 [5]
M.G. Culshaw, C.P. Nathanail, G.J.L. Leeks, etal. Science of The Total Environment Vol.360 (2006) p.233-245
[6] Hongjie Xie, Xiaobing Zhou, E-nrique R.S. etal. Computers & Geoscience Vol.31 (2005), p.65-76 [7] Lei Chi, Kiku G. Jones, Albert L. etal. International Journal of Information Management, Vol.25(2005), p.253-269
2359