BLiPP reads values from the operating system; on Linux .... selected in Linux kernel 2.6.35. ..... [3] Net:netem. http://www.linux-foundation.org/en/Net:Netem.
An Instrumentation and Measurement Framework for End-to-End Performance Analysis Ezra Kissel, Ahmed El-Hassany, Guilherme Fernandes, Martin Swany
Dan Gunter, Taghrid Samak
Computer and Information Sciences University of Delaware Newark, DE 19711 Email: {kissel, fernande, elhassa, swany}@cis.udel.edu
Computational Research Division Lawrence Berkeley National Laboratory Berkeley, CA 94720 Email: {dkgunter, tsamak}@lbl.gov
Abstract— This paper presents Periscope: a metric caching, analysis, and visualization platform for troubleshooting end-to-end network and system performance. Periscope collects and caches on-demand, real-time measurements from both global network monitoring infrastructures such as perfSONAR as well as locally generated host metrics in a common representation. We describe a flexible host monitoring implementation and the intrumentation of GridFTP with an enhanced log summarization API. We evaluate the ability of Periscope to analyze and detect bottleneck conditions over a series of high-speed and I/O intensive bulk data transfer experiments. Periscope is supported by a light-weight eXtensible Session Protocol (XSP) that enables context-sensitive measurement collection from end-hosts and applications.
II. S YSTEM D ESCRIPTION
The Periscope system provides an end-to-end view of system performance to a user. Periscope presents data from the processes, hosts and various relevant points in the network in a single, scalable analysis and presentation framework. The context of a user’s activity is captured by the introduction of a session protocol that initiates and controls various monitoring activities. In addition, Periscope uses this context to gather performance information from ongoing measurement activities on and between relevant network elements. Periscope utilizes a session-layer protocol for controlling and transmitting measurement data. The XSP approach replaces calls to the socket library and adds an explicit session layer. I. I NTRODUCTION When an application calls connect(), the XSP library can 2 Measurement is critical for understanding system perfor- connect to an intermediate service , in our implementation a mance, but it is often difficult in distributed environments. This daemon named XSPd. The XSP library can provide process paper describes a framework that extends and integrates existing context information, allowing XSPd to group and aggregate systems to provide end-to-end, activity-specific measurements related monitoring information. In addition, XSPd can send that can potentially handle all relevant performance data for a control information to the library, providing parameters to the measurement gathering infrastructure. This control channel can given user’s activity in a distributed system. Periscope leverages perfSONAR [11] and NetLogger [18] to affect the fidelity (and volume) of monitoring. Inside the XSP library, all read() and write() calls provide a user-centric view of distributed system performance. are instrumented with NetLogger. A NetLogger call before perfSONAR provides a distributed measurement reporting and after each system call allows us to report the time spent framework; the NetLogger Calipers component performs blocked and the bytes transferred, providing a timeseries of configurable aggregation of high frequency data to ensure transfer rates from the application’s perspective. In addition, scalability while providing “tunable” visibility. XSP can initiate host system monitoring (as described below.) Another important aspect of our approach is the use of The application and host metric sets are sent to XSPd. the eXtensible Session Protocol (XSP). Many of the problems Periscope receives session and performance information from related to measurements that span layers and systems are related XSPd. Periscope can then begin to gather and cache relevant to context. Our notion of a session in XSP groups related performance information from perfSONAR. The perfSONAR network connections, abstracting the user/network interaction system has a wide deployment and thus there are many away from a single connection and into a “period devoted paths over Research and Education (R&E) networks that are 1 to a particular activity.” XSP signals the network to provide completely instrumented with perfSONAR. In our dynamic context for an activity of interest. It creates a data transport network allocation work, we have used XSP and Periscope to connection, as well a control channel to adjust measurement dynamically install flow-specific monitoring in network devices activities and frequency. on the path. The details of this monitoring are beyond the scope This paper will describe the components and overall system, of this paper but details are provided elsewhere, in e.g. [11]. and will present results from an important case study: high We have developed a lightweight, extensible monitoring performance data transfer. 1 New
Oxford American Dictionary, 2nd, Ed., 2006.
2 We have used this protocol for network control and to enable a performance proxy previously, but that is not our concern here.
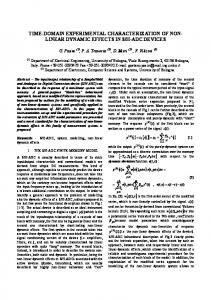
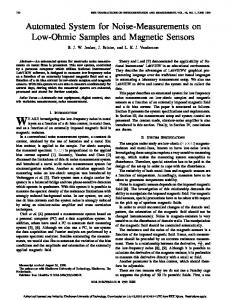
framework called Basic Lightweight Periscope Probes (BLiPP). B. Data Collection BLiPP reads values from the operating system; on Linux Generated measurement data blocks are communicated with systems this means reading from the /proc filesystem to our XSP implementation. XSP is a light-weight, binary protocol report relevant system variables. The OS generally provides a over which stateful measurement “sessions” may be established great deal of information. We can read these variables when with one or more collection and aggregation nodes. Although they are of interest and can relate them to the other Periscope the details of XSP are outside the scope of this paper, the ability values. of XSP to signal control information out-of-band allows for a The overall system architecture and components are shown flexible measurement framework that includes transformation in Figure 1. and aggregation points within the network. Our current model enables Periscope with an XSP frontend in addition to a RESTful-style interface for measurement collection. Our data blocks implement the perfSONAR measurement schema in a binary encoding of the Javascript Standard Object Notation (JSON) [2], called BSON3 [1]. Like JSON, BSON supports the embedding of documents and arrays within other documents and arrays. Also like JSON, but unlike many other Fig. 1. Overall system architecture binary interchange formats BSON is entirely “schema-less”. This provides greater flexibility at the cost of some space efficiency (BSON retains field names within the serialized A. NetLogger Calipers data). The perfSONAR-BSON data blocks provide a compact, We have implemented a log summarization extension to flexible format for describing collected measurement data from the NetLogger Toolkit. Our NetLogger Toolkit provides an any number of sources. Details about the data includes an event integrated set of tools for creating sensors and for collecttype (what is being measured), parameters such as start/end ing, archiving, and analyzing sensor data. Using NetLogger, time and the sampling interval, and any other descriptive fields distributed application components are modified to produce about the data. This information forms the instrumentation timestamped traces of events at critical points. metadata for a given measurement. In this scheme, a BSON The log summarization extension is based on our earlier work structure is constructed that contains a metadata chain that [10], but radically streamlines that implementation to reduce describes the collected event types and the actual measurement overhead. We call this new implementation the NetLogger data. For each new event type, the metadata is sent only calipers API, by analogy to the function of a calipers to measure once and subsequent summarized measurement data simply the distance between two points. In our case, the calipers references this metadata via parent identifiers. This effectively measure the duration of an activity and associates that duration reduces a large amount of communication overhead especially with a user-provided numeric value. as the sampling rate increases. Metadata state is maintained by The NetLogger calipers API is written in C, and is designed Periscope and associated with an XSP measurement session to minimize the cycles spent at each instrumentation point. which is established by the instrumented application. On the The memory used at any time is a small constant. Each caliper specified sampling interval, a completed BSON structure is instance records statistics for a single stream of activity, e.g., encapsulated within an XSP measurement message and queued a sequence of reads from a file or a stream of writes to a TCP for delivery over the previously established XSP session. socket. The activity is bracketed by calls to the NetLogger We should note that the Periscope architecture is not tied to calipers begin() and end(value) functions. In our case, any particular measurement format. The perfSONAR-BSON the activities are the read() and write() system calls, and data blocks were developed to remain compatible with the the value is the number of bytes read or written. existing perfSONAR metadata schema [21] and to easily Each caliper stores a summary of the values and durations support monitoring of the bulk-data transfer use case presented recorded by each begin/end pair. The available summary in this paper. statistics are the minimum, maximum, sum, mean, and standard deviation of both the numeric value and the ratio of that value C. Instrumenting GridFTP / XIO to a given caliper duration. The number of calls, wallclock The well-known file transfer application GridFTP [9] within duration, and exclusive time spent in the calipers is also the Globus Toolkit [8] uses an extensible input/output library recorded. Of particular interest in this analysis is the mean called XIO. By utilizing the concept of a driver stack, various ratio of the value to the duration, called here mean_r, which modular drivers may be implemented independently and loaded represents the ”speed” of a given I/O operation. dynamically at run time. This modularization facilitates reThe NetLogger calipers API provides functions for reporting usability for applications developed with the toolkit. Using the summarized data as either NetLogger BP log messages, or as perfSONAR-BSON data blocks, which are described in 3 pronounced bee-sahn to avoid confusion with the GNU parser generator, detail in the next section. Bison Periscope
Calipers
libxsp
Calipers
XSP Daemon
NetLogger
perfSONAR Network Monitoring
XSP Daemon
libxsp
BLiPP
BLiPP
App
System
NetLogger
App
System
MBytes/s
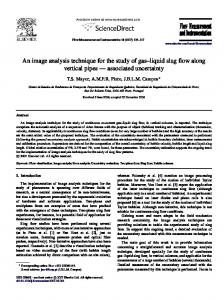
this XIO framework, we have developed a transform driver and CUBIC was the default congestion control algorithm that gives Globus applications such as GridFTP the ability to selected in Linux kernel 2.6.35. We then ran a series of iperf4 enable configurable instrumentation in conjunction with other and GridFTP tests (without any instrumentation). We used the drivers loaded on the available driver stacks. The xio-nl-xsp netem [3] kernel module to emulate wide-area network (WAN) instrumentation driver leverages both our calipers and XSP latency of 100ms. To remove the disk as a bottleneck, we also libraries and is loadable on both the network and file system performed a number of memory-to-memory tests Each test was stacks utilized within the Globus Toolkit. We are thus able run using both a single stream (p1) and four parallel streams to collect and report measurements on the underlying file I/O (p4). Figure 2(b) shows the network baseline results. operations as well as any enabled data channel network drivers (e.g. built-in TCP, UDT [5], Phoebus [13]). 10-a 10-b The XIO framework provides the means to intercept read 1400 and write calls passed along the driver stack via pass-through 1200 100 and callback methods. Our xio-nl-xsp driver takes advantage 1000 of this by employing calipers begin/end events within these Test 90 read methods, effectively instrumenting the data transfer operations reread 800 rewrite of the Globus application. In addition to read/write statistics, 80 write 600 the driver collects stack-specific information about the transfers. This includes source and destination IP addresses, port numbers, 400 70 and unique parallel stream identification on the network stack 200 and transferred filename and size on the file system stack. This 1 2 3 4 1 2 3 4 transfer-specific information is made visible to Periscope via Number of processes the perfSONAR-BSON metadata described above. (a) Disk Once enabled on a GridFTP server, the xio-nl-xsp driver may be loaded on-demand by the requesting application, reducing 0ms_p1 0ms_p4 the complexity of deploying instrumentation on a production 1200 system. A number of options provide control over the driver 1000 when specified on the command line. The options take the form 800 of name=value pairs and may specify the XSP session path 600 (single or multiple hops), sampling interval, instrumentation 400 type, and user-specified metadata fields such as a task id.
A pair of hosts built with off-the-shelf components were used in the experiments. These are labeled 10-a and 10-b. Both hosts have a hex-core Intel CoreTM i7 980X 3.33GHz CPU, Myricom 10G-PCIE2-8B2-2S NIC, 3ware 9750-8i hardware RAID, and 12GB of memory. The major difference between them is that 10-a has 16x500GB SAS drives compared with 2x500GB SAS drives in 10-b. This creates a natural I/O imbalance which is revealed in our testing below.
MBytes/s
200
III. E XPERIMENTAL E VALUATION
Test 100ms_p1
GridFTP/UDP
1200
iperf/TCP
1000 800 600 400 200
20
40
60
80
100
120
20
40
60
80
100
120
Time (s)
A. Baselines We began by establishing baselines for network and disk speeds for the test configurations. For the disk baselines, we tested with the standard iozone3 tool with the following options: iozone -s48G -r256k -i0 -i 1-l1 -u4 -F, which runs sequential read and write tests of 48GB of data using 256KB blocks. From one to four concurrent processes were used to perform the I/O. Figure 2(a) shows the results. Overall, multiple concurrent processes degrade throughput, though 10-a write throughput almost doubles from 1 to 4 writers, perhaps due to better loadbalancing across all 16 disks. For the network baseline, we first ensured that our test systems were properly tuned: maximum TCP buffers were set to 256MB, metric caching was disabled, autotuning was enabled,
GridFTP/TCP
100ms_p4
Fig. 2.
(b) Network Disk and network performance baselines
B. Instrumentation overhead In order to verify that the detailed low-level measurements from NetLogger calipers would not perturb the data transfer, we first estimated instrumentation overhead using a microbenchmark, then measured end-to-end overhead in real transfers. The microbenchmark was a tight instrumented loop, with summary events generated once per second for one minute (n = 60). We calculated the 10% trimmed mean of the time spent instrumenting a block of data, assuming GridFTP’s default 4 Popular
network measurement tool – see http://iperf.sourceforge.net
256KB blocks and four instrumentation points: a read and write on each server. The estimated overhead was 65ns per block on 10-a and 67ns on 10-b ; this equates to 0.13% and 0.14% overhead at 10Gbit/s, respectively. We then measured the overhead by comparing instrumented and un-instrumented real transfers from 10-b to 10-a. Both disk to disk and memory to memory (i.e. /dev/zero to /dev/null) tests were run, but no induced latency or other perturbations were added. The measurement used was an average of the steady-state ”instantaneous” numbers reported by the well-known GridFTP client globus-url-copy after running for at least 30 seconds. The standard deviation for the disk/disk transfers was about 1.3M Bytes/s and for the memory to memory transfers it was 0.25M Bytes/s. The measured overhead was −0.12 for disk and 0.04 for memory, which given the standard deviations are indistinguishable from random variation. In summary, both the microbenchmark estimate and real transfers indicated that at speeds up to 10Gbits/s there is practically no overhead introduced by the NetLogger Calipers API. Furthermore, the results suggest that even at 40Gbits/s overhead will be under 1%.
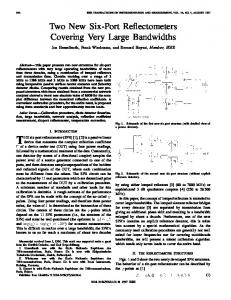
focuses on identifying the main component limiting the transfer rate. This includes limitations from disk read, disk write, or network read. For each experiment configuration from Table I, the rate is monitored over time. For the collected measurements, we compare the mean value of the rate for each potential bottleneck (µdr , µdw and µnr for disk read, disk write and network read means, respectively). The components with the lowest overall mean rate is identified as the potential bottleneck. A standardized t-test is then used for all observations to validate the conclusion. For example if µnr is the lower value, then network read could be the bottleneck. We then perform tests for two hypotheses, µnr < µdr and µnr < µdw . Figure 3 shows the average rate over time for some of the TCP experiments. Each sub-figure reflects an individual experiment. The sample shown here exposes different identified bottlenecks. For example, the bottom-left figure shows the disk read bottleneck when using disk-to-disk transfer with no latency. The memory-to-disk transfer on the top-left chart reflects network read bottleneck. Network read is also the bottleneck for the right-top chart. This result is expected for the memory-to-memory transfer, where the network clearly has more limitations. The bottom-right chart shows the results for introducing 0.01% loss in the middle of the transfer, with C. Experiments 100ms latency when using 4 parallel streams. Two interesting A number of GridFTP transfer scenarios were tested in order observations can be seen here. First, using 4 parallel streams to evaluate our monitoring framework and provide a variety causes the disk write to be the limiting bottleneck at the of data sets for analyzing our bulk-data transfer use case. The receiving end (the red stable line). Second, the loss causes the experiment types listed in Table I represent cases where either network (both read and write events) to drop in the middle of the disk or network becomes a bottleneck for a given transfer. the transfer. For instance, we allow 10-b to write from memory to the fast disk on 10-a in the memory-to-disk experiments. For each type, we modified network conditions such as latency and loss and utilized 1 stream or 4 parallel streams in each case. In the loss cases, .01% loss was introduced at the midpoint of a transfer, providing a scenario where a transfer is suddenly affected by a change in network conditions. Finally, both TCP and UDT transports available within GridFTP are used in these experiments. disk nl.read.summary disk nl.write.summary network nl.read.summary network nl.write.summary
10G−TCP−P1−MEMDISK−100_LAT
10G−TCP−P1−MEM−NO_LAT
10^5
10^4
10^3
Experiment Type Description Memory-to-Memory 120s transfer, /dev/zero -> /dev/null Disk-to-Disk 36 GB file from source to destination Memory-to-Disk 120s transfer, removes 10-b disk restriction Testing Parameters (Both TCP and UDT) Single stream, no latency Single stream, 100ms latency Single stream, 100ms latency, .01% loss Four parallel streams, no latency Four parallel streams, 100ms latency Four parallel streams, 100ms latency, .01% loss
Average Rate (MB/s)
10^2
10^1
0
20
40
60
80
100
0
10G−TCP−P1−DISK−NO_LAT−36GB
20
40
60
80
100
120
10G−TCP−P4−MEMDISK−100_LAT−01_LOSS
10^5
10^4
10^3
10^2
10^1 0
100
200
300
0
20
40
60
80
100
Time (s)
Fig. 3.
Time series of average transfer rate, for different TCP experiments.
TABLE I
I NSTRUMENTED EXPERIMENTS
D. Bottleneck Analysis In this section, we show preliminary results for bottleneck detection. The average ”instantaneous” rate (mean_r statistic from NetLogger calipers) is used as an estimate of the overall transfer performance, where low rates incurred on a certain components will reflect a potential bottleneck. The analysis
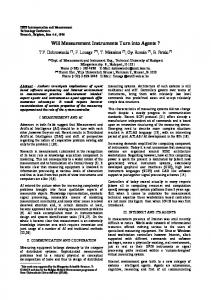
UDT results are shown in Figure 4. Disk reads are the bottleneck for the disk-to-disk transfers on the bottom-left chart. The latency affects the rest of the charts, where the rate of network reads are dropping, while writes take on a random trend. Disk writes were identified as the bottleneck for highlatency lossy transfer (top-right), where the red line shows a more consistent trend than network trends. The stability of the rate for disk reads was the main factor for the t-test to show significance. On the other hand, network reads were identified
disk nl.read.summary disk nl.write.summary network nl.read.summary network nl.write.summary 10G−UDT−P4−MEMDISK−100_LAT
10G−UDT−P4−MEMDISK−100_LAT−01_LOSS 10^5.0
10^4.5
Table II summarizes the results of our algorithm for each experiment configuration. All memory-to-memory variants showed the network as the bottleneck and are thus not shown in the table.
10^4.0
Average Rate (MB/s)
10^3.5
10^3.0 0
20
40
60
80
100
0
20
10G−UDT−P4−DISK−100_LAT
40
60
80
100
10G−UDT−P4−MEM−100_LAT
10^5.0
Resources Disk to Disk Memory to Disk
10^4.5
10^4.0
Prot. TCP UDT TCP UDT
Streams 1 4 1 4 1 4 1 4
0/0 disk.read disk.read disk.read disk.read network disk.write network network
Latency / Loss 100ms / 0 network network disk.read disk.read network disk.write network network
TABLE II B OTTLENECK ANALYSIS RESULTS
10^3.5
100ms / 0.01 n/a n/a n/a n/a network disk.write network disk.write
10^3.0 0
100
200
300
0
20
40
60
80
100
120
Time (s)
Fig. 4.
Time series of average transfer rate, for different UDT experiments.
1.4
CPUs * value
1.2 1.0 metric
0.8
sys
0.6
user
0.4 0.2
IV. R ELATED W ORK 0
20
40
60
80
100
Time (s)
103.5 103
MBytes/s
102.5
operation disk read
102
disk write
101.5 10
There is clearly much room for additional research in this area. For example, we do not address the possibility that the bottleneck shifts during a given transfer session (which would require application of change point detection techniques [7]), resource contention is only minimally considered, etc. These initial results do show clearly, however, that the summarized low-level measurements highlight many important aspects of observed performance.
network read
1
network write
100.5 100 0
20
40
60
80
100
Time (s)
Fig. 5.
System analysis for UDT transfers.
as the bottleneck for latency without loss. The UDT loss case exhibits curious behavior in terms of an observed increase in network read/write performance. In fact, we have identified this apparent contradiction as a sideeffect of the userspace UDT API visible to our instrumentation within xsp-nl-xio. Poor UDT performance at 10Gb/s speeds is shown in our baseline testing and is attributable to the increased overhead in performing userspace context switching and buffer copying. When the disk is the bottleneck, there are adequate free cycles for the UDT write call to copy the user buffer and return immediately. As the CPU load increases, this copy operation requires more time and we see a decrease in UDT write performance. Similarly, the incurred CPU load is reduced when less data is being transferred and the observed UDT write performance increases. Figure 5 illustrates this behavior by correlating system measurements with the instrumented UDT operations when loss is introduced during the test. Finally,
Data management and reduction have been widely studied in many areas, including medical data analysis [16], financial time series prediction [15], and biological data sampling [20]. Data reduction strategies chiefly rely on statistical techniques such as averaging, variance, covariance matrices, sampling, and principal component analysis. Other researchers have examined correlation elimination to diminish the volume of performance data [14] [19]. In [12], online bandwidth prediciton is studied in Grid architecture. Support vector regression is used in predicting bandwidth, from sliding window observations. The monitoring framework collects measurements from different grid nodes, and normalizes bandwidth measures to be stored in a PostgreSQL database. Our work is similar in spirit with the measurement frameworks proposed in [4], [6], [17]. Periscope extends these approaches by providing a common, user-centric view of the network with the notion of session-bound context between related activities and collected performance metrics. V. C ONCLUSION AND F UTURE W ORK We have outlined an architecture for a flexible, contextsensitive instrumentation and measurement system. A number of key system components have been developed and benchmarked and we have evaluated our approach in detecting bottleneck conditions across various bulk-data transfer scenarios. Our preliminary analysis demonstrates the ability to correctly aggregate and correlate collected metrics and accurately determine the cause of end-to-end performance bottlenecks. As future work, we plan to extend the analysis capability within Periscope and enable XSP measurement sessions to explicitly control the fidelity of monitoring at instrumentation points.
ACKNOWLEDGMENTS This work was supported in part by the Mathematical, Information, and Computational Sciences Division subprogram of the Office of Advanced Scientific Computing Research, Office of Science, U.S. Department of Energy, under contracts DE-AC03-76SF00098, DE-AC02-06CH11357 and DESC0001421. R EFERENCES [1] [2] [3] [4] [5] [6] [7] [8] [9] [10]
[11]
[12]
[13] [14]
[15]
[16]
[17] [18] [19] [20] [21]
Bson. http://bsonspec.org. Json. http://json.org. Net:netem. http://www.linux-foundation.org/en/Net:Netem. M. Allman and V. Paxson. A reactive measurement framework . PAM’08 Proceedings of the 9th international conference on Passive and active network measurement, 2008. J. Bresnahan, M. Link, R. Kettimuthu, and I. Foster. Udt as an alternative transport protocol for gridftp, 2009. P. Calyam, D. Krymskiy, M. Sridharan, and P. Schopis. Tbi: End-toend network performance measurement testbed for empirical bottleneck detection. In IEEE TRIDENTCOM, pages 290–298, 2005. E. Carlstein, H. M ”uller, and D. Siegmund. Change-point problems. Inst of Mathematical Statistic, 1994. I. Foster and C. Kesselman. Globus: A metacomputing infrastructure toolkit. 11(2):115–128, 1997. GridFTP. http://www.globus.org/datagrid/gridftp.html. D. Gunter, B. Tierney, A. Brown, M. Swany, J. Bresnahan, and J. Schopf. Log summarization and anomaly detection for troubleshooting distributed systems. In Grid Computing, 2007 8th IEEE/ACM International Conference on, pages 226–234. IEEE, 2007. A. Hanemann, J. Boote, E. Boyd, J. Durand, L. Kudarimoti, R. Lapacz, M. Swany, S. Trocha, and J. Zurawski. PerfSONAR: A service oriented architecture for multi-domain network monitoring. In In Proceedings of ICSOC 2005, December 2005. L. Hu and X. Che. Design and implementation of bandwidth prediction based on grid service. In High Performance Computing and Communications, 2008. HPCC ’08. 10th IEEE International Conference on, pages 45 –52, 2008. E. Kissel, M. Swany, and A. Brown. Improving gridftp performance using the phoebus session layer. In In Proceedings of SC ’09, pages 1–10, New York, NY, USA, 2009. ACM. M. Knop, J. Schopf, and P. Dinda. Windows performance monitoring and data reduction using watchtower. In Proceedings of Workshop on Self-Healing, Adaptive and self-MANaged Systems (SHAMAN), June 2002. A. Lendasse, J. Lee, E. Bodt, V. Wertz, and M. Verleyen. Input data reduction for the prediction of financial time series. In Proceedings of the European Symposium on Artificial Neural Networks (ESANN’01), 2001. Y. Qu, B. Adam, M. Thornquist, J. Potter, M. Thompson, Y. Yasui, J. Davis, P. Schellhammer, L. Cazares, M. C. Jr., and Z. Feng. Data reduction using a discrete wavelet transform in discriminant analysis of very high dimensionality data. In Biometrics, volume 59, 2003. D. Skinner. Performance monitoring of parallel scientific applications. Technical Report LBNL-5503 2005. B. Tierney and D. Gunter. Netlogger: A toolkit for distributed system performance analysis. In Proc. of the IEEE Mascots 2000 Conference (Mascots, 2000. L. Yang, J. Schopf, C. Dumitrescu, and I. Foster. Statistical data reduction for efficient application performance monitoring. In Proceedings of the Grid Workshop 2006, October 2006. N. Yoccoz, J. Nichols, and T. Boulinier. Monitoring of biological diversity in space and time. In Trends in Ecology and Evolution, volume 16, pages 446–453, 2001. J. Zurawski, M. Swany, and D. Gunter. A scalable framework for representation and exchange of network measurements. In TRIDENTCOM, 2006.