An Integrated Bayesian Approach to Layer Extraction from Image. Sequences. 642. Abstract. This paper describes a Bayesian approach for mod- eling 3D ...
An Integrated Bayesian Approach to Layer Extraction from Image Sequences 642 Abstract This paper describes a Bayesian approach for modeling 3D scenes as a collection of approximately planar layers that are arbitrarily positioned and oriented in the scene. In contrast to much of the previous work on layer based motion modeling, which compute layered descriptions of 2D image motion, our work leads to a 3D description of the scene. We focus on the key problem of automatically segmenting the scene into layers based on stereo disparity data from multiple images. The prior assumptions about the scene are formulated within a Bayesian decision making framework, and are then used to automatically determine the number of layers and the assignment of individual pixels to layers. Although using a collection of 3D layers has been previously proposed as an efficient and effective representation for multimedia applications, results to date have relied on hand segmentation. In contrast, the work described here aims at getting the best automatic segmentation that is possible based on disparity and color data alone.
1
Introduction
The classical approach to 3D scene modeling from multiple images is to break the problem into two subproblems: creating a 3D geometric model of the scene, and creating a texture map that captures the visual appearance of the scene. A more recent emerging paradigm is Image-Based Modeling and Rendering (IBMR) in which the representation of appearance and geometry are more tightly coupled. Examples include plenoptic modeling such as the Lumigraph, characteristic views etc. These representations are used as the basis for compression, new view rendering, and video editing. IBMR methods are tailored to this class of “image-in, image-out” functions which are important in multi media applications. Since motion and stereo have been the dominant methods for recovering 3D scene structure from multiple images, there is a direct mapping between motion (or stereo disparity) recovery and 3D scene modeling. A recent trend in image motion modeling is the use of layers (e.g., [8]) which are 2D sub-images, such that pixels within a layer move in a manner consistent with a 2D parametric transformation (e.g., affine). These 2D layers, however, are usually not intended to cap-
ture 3D scene structure. In contrast, it was proposed in [1] that the scene should be decomposed into a collection of 3D layers (or sprites), each of which consists of a plane equation, a color image that captures the appearance of the sprite, a per-pixel opacity map, and a per-pixel depth-offset relative to the nominal plane of the layer. This approach to layered representation can be viewed as an extension of the plane+parallax decomposition of image disparities across multiple views. Although [1] proposed a complete generative model for images based on layers, the algorithm described in that paper for recovering the layers from a given set of input images is incomplete. Layer initialization was based solely on manual user input and as the paper confesses, the final assignment of pixels to layers was not fully developed. In fact, the central problem of layer-based scene modeling is the determination of the number of layers and the assignment of pixels to layers. An infinite number of decompositions are equally consistent with the generative model proposed in [1], ranging from assigning one layer plane to every pixel (with no depth offset) to modeling the entire scene with a single layer plane (with lots of depth offset). Apart from object and scene level semantic information (which is important, but outside the scope of this paper), the natural criterion to use is compactness or parsimony of description. But computing a parsimonious description is implicitly and tightly tied to our prior assumptions about the scene and the imaging process that generated the input images. Bayesian decision theory provides a foundation for accurately and formally stating our prior assumptions and then developing algorithms for applying these priors during reconstruction.
2
The Bayesian Method
The approach that follows is unashamedly Bayesian, to quote E. T. Jaynes “Vision is inference from incomplete data”. As set out in his internet book [5] (which every vision postgraduate would be well advised to read), the Bayesian method provides a consistent way of reasoning about the world that can be viewed as an extension of the Aristotelian calculus of logic to uncertainty. Some will complain that to use Bayesian methods one must introduce arbitrary priors on the parameters. However, far from being a
disadvantage, this a tremendous advantage as it forces open acknowledgement of what assumptions were used in designing the algorithm, which all too often are hidden away beneath the veneer of equations. Furthermore there is nothing wrong with injecting our prior information into the design of vision algorithms – all vision researchers do it when ever they choose the probability distribution of their error. As will be seen, the validity of the prior assumptions can be tested by altering the priors and seeing whether this leads to radically different results. In addition to the utilization of prior information, Bayesian methods are further distinguished from orthodox statistical methods by their use of full probability distributions rather than the mode to describe parameters. This difference can be illustrated by how to compare two competing models for the data. This will be useful later when we need to determine the number of layers used to describe the image. Given a closed set1 of k models M1 . . . Mk that can explain the data D the Bayes rule leads us to
∞
Pr(D|Mi I) Pr(Mi |I) , Pr(Mi |DI) = Pr(D|I)
(1)
where I is the prior information assumed about the world. In this paper the set of models are: M1 that the data can be explained by one layer, M2 that the data can be explained by two layers, and so on. The posterior probability that a given model Mi is the correct one is Pr(D|Mi I) Pr(Mi |I) , Pr(Mi |DI) = Pj=k j=1 Pr(D|Mj I) Pr(Mj |I)
(2)
Pj=k Note that by construction, j=1 Pr(Mj |D) = 1. The key to this equation is the evaluation of Pr(D|Mj I), which is called the evidence. In contrast to nonBayesian techniques, the evidence for a model is in fact the integral of the likelihood over all possible values of the model’s parameters: Z
j
=
Evidence
=
Pr(D Mj I)
j
Pr(D Mj θ j I) Pr(θj
Z
likelihood
jMj I)
prior dθ j
;
θ (3)
d j
(4)
where θ j are the kth model’s parameters, and Pr(θ j |Mj I) is the prior distribution of parameters of the model. How does this relate to the principle of parsimony so prevalent in model selection (AIC, MDL etc.)? Not as it commonly believed, i.e., by penalizing more complex models a priori 2 . In the absence of any 1 This
prior preference between the two models, (Pr(Mi ) = Pr(Mj )), all the models are equally likely a priori. Rather, more complex models have the probability of the prior dispersed over a Rgreater region of parameter space. Note by definition Pr(θj |Mj I)dθ j = 1. Thus a more complex model will only be supported if there is a corresponding increase in the likelihood of the data given that model. This is a subtle point and worthy of some reflection. Equation (4) representing the evidence for a given model is a crucial equation and is worthy of close scrutiny. If one accepts Bayes rule then logic dictates that this is the only way to calculate the posterior probability of each model [5]. Another useful Bayesian technique is that of marginalization, which allows us to dispose of parameters that are not directly useful to us at any given time by integrating them out. This is effected by the following identity: Z ∞ Pr(X, Y|I)dY = Pr(X|I) (5)
is an important prerequisite, and the burden is on us to explore the most likely models. 2 Although there is nothing to stop us doing this it is not necessary.
As it turns out, the Bayesian technique of marginalization provides us with a most elegant solution to a problem that has plagued motion algorithms for decades, namely the correspondence problem.
3
First Stage|preprocessing
The input to the algorithm is a sequence of images. This is the (raw) data D. The first stage of the algorithm uses a coarse to fine algorithm to obtain initial disparity estimates for each pixel [2]. Then, calibration and camera matrices are recovered [7]. Each image is then transformed in such a way that the plane at infinity is stabilized. In other words the images are rectified to the first one by transforming under H1j ∞ the homography of the plane at infinity between image 1 and the jth image to remove the affects of rotation. Registering each image to the plane at infinity has the affect that the disparity (motion) of each pixel now depends purely on depth. Here, the disparity δ(x, y) at pixel (x, y) in image 1 is is taken to mean the motion along the epipolar line between image 1 and image 2. Because the images are rectified to the plane at infinity, it is a bijective function of the depth of that pixel, δ(x, y) = ρ (Z(x, y)). The transformation ρ is purely a function of the calibration and camera matrices. It is useful later when we wish to transform error distributions in the image to error distributions in 3D. The notation Z is adopted for the set of depths, and Z(x, y) for the depth of a pixel (x, y) in the first image.
4
Parametric Formulation of Problem
The set of input images is denoted by D (the data), the model M consists of a set of m planes with parameters θj , j = 1 . . . m, and a set L of per pixel labels
l(x, y) for the first image. Nothing is known about the number of layers m – this must also be recovered. One image (image 1) is used to initialize the segmentation and from hereon the segmentation and labeling is done in the coordinate system of image 1. Because inter image motions are small it is more natural to do the segmentation in the image rather than in some 3D based coordinate system. Hence the aim is simply to extract M from D. The prior information I includes the camera pose for each image, the camera calibration, and our assumptions about the underlying noise distributions. The parameters of each plane are θ = (a, b, c) such that aX + bY + cZ = 1, where X, Y, Z are the Euclidean coordinates. This parametrization is chosen as it excludes all planes passing through the origin of the coordinate system (the optic centre of the first camera) i.e. planes of the form aX + bY + cZ = 0. These project to a line in the first image (and subsequent images if the baseline is small) and thus correspondence cannot be recovered for them. Note that θ = (a, b, c) lies along the normal of the plane. The coordinate system is chosen such that the origin is at the first camera’s optic centre. In image 1, x = X/Z and y = Y /Z, leading to ax + by + c = 1/Z. Thus, given the plane and the (x, y) coordinate of any pixel, its depth may be found (and hence its corresponding pixel in any other image). For the case when the direction of motion along the optic access is small relative to the distance to the 3D point, 1/Z is roughly proportional to the disparity between images. a and b give the disparity gradients in the x, y directions and c, the inverse depth of the plane at the principal point One plane is privileged in that it is always represented by a layer and has fixed parameters θ ∞ = (a, b, c) = (0, 0, 0): this is the plane at infinity. Although this ideal cannot truly exist in a Euclidean representation, it serves a useful purpose. All pixels that are so distant that their disparity is swamped by noise (e.g. sky) have very ill conditioned depths, and cannot be easily segmented. These are all grouped together into the plane at infinity.
5
Probabilistic Formulation
This section introduces the mixture model used to describe the layers. Although some will consider this standard fare, we consider it worth looking under the bonnet3 to show the logical implications of our formulation. We will show how Bayesian reasoning can be used to describe two vision heuristics of long standing: the disparity gradient limit and plane plus parallax. We will also show how the layers can be recovered without estimating correspondence. It transpires that 3 hood
this is very useful for segmentation, as it finesses the problem of mismatches. Posterior Probability of the Model The model parameters m, , L are chosen so as to maximize the posterior probability: Pr (D|mLI) Pr (mL|I) . Pr (D|I) (6) The denominator can be discounted for the purposes of parameter estimation, (but not for the purposes of model comparison as will be seen later), as it is constant for all values of the parameters. So far, the estimation of depth (or disparity) has not been mentioned, although it would apparently have a direct bearing on the likelihood. max Pr (mL|DI) = mL
Recovering the plane parameters without correspondence We can use the Bayesian method of marginalization to remove the depth parameter from the posterior probability of the plane Z Pr (mL|DI) = (mLZ|DI) dZ (7) Z Later it will be seen that this is most convenient when trying to determine what label a pixel should have, or when re-estimating the planes using ECM, described below. The advantage of marginalization is that it allows us to use a plane to capture the motion of a region of an image, but also allows for relief (or parallax) out of that plane. By marginalization of the depths rather than MAP estimation, we avoid a strong commitment to depth estimation. Typically, too early a commitment to a depth estimate in convergence to a local (rather than global) maximum of the posterior likelihood (especially in homogeneous regions of the image). By marginalization, we are in effect “hedging our bets” and not committing to a single depth estimate. Rather, the distribution of depth at a pixel is specified by the mixture model. Next the posterior likelihood will be decomposed into its component parts and it will be explained how it can be optimized using the ECM algorithm. Decomposition. Assuming that the number of layers m has been determined (techniques to do this are set out below) and the noise across the image is not spatially correlated, this can be evaluated as the product of the MAP likelihoods at each individual pixel. Z
j
Pr (ZL DI) dZ Z Z Y Z xy
j
/
j
Pr (D z(x; y)l(x; y)I) Pr (LZ I) dZ
Considering each pixel individually, dropping the (x, y) index, adopting the notation lj (x, y) for l(x, y) = ˜ be the set of labels excluding the label for j and let L pixel (x, y). Then
the scenes that we are dealing with are from video sequences, the inter-frame motion is 0-4 pixels, thus 20 disparity hypotheses increasing in steps of 0.2 can be used to sample the 0-4 pixel disparity range. Next, the form of the priors are explained.
Pr (D|lzI) Pr (LZ|I) = j=m X
³ ´ ˜ Pr (D|zI) Pr (lj |I) Pr (z|θj I) Pr (θj |I) Pr lj |LI
The priors. Using the product rule, the prior can be decomposed as follows,
j=1
Pr (ZL|I) = Pr (Z|LI) (L|I) . which is a mixture model [4] between the layers, with spatial correlation between the label parameters. The Likelihood. The term Pr (D|zθ j I) is the likelihood of the pixel having a particular depth (or disparity) hypothesis z. It can be evaluated from the cross correlation between the pixel in question and its correspondences in each other image of the sequence. As such, it only depends directly on the depth and can be written (D|θ j zI) = (D|zI) (This is logically correct; the likelihood purely depends on the estimated disparity, it cannot depend on anything else. How z is influenced by θ j is explained below). Suppose that the variation in intensity between images can be modeled as Gaussian with mean µi and standard deviation σi . Let ∆ij (x, y) be the difference in (colour) intensity between the pixel in image 1 and its corresponding pixel in image j. Then Y
j
Pr (D zI ) =
6
((1
po
j
)Φ(∆ij (x; y) ¡i ¦i ) + po )
(8)
j =1
j
where Φ(∆ij (x; y) ¡i ¦i ) is the Gaussian likelihood
j
Φ(∆ij (x; y) ¡i ¦i ) =
µ
p1
2¤¦i
exp
∆ j2( 2 i
)
x; y
¦i
;
(9)
po is the probability of occlusion, or that the pixel is in some other way radically different (for instance due to the interpolation error when working out the cross correlation), and α is a constant being the probability of the intensity difference given an occlusion (uniform over the range of intensity). Equation 8 is a form of contaminated Gaussian with parameters µi , σi , α, po and distribution denoted by Υ(∆ij |µi , σi , α, po ). It provides a robust error metric, in that the effect of any one observation is bounded. In our work po = 0.05 (although there is a switch in the code to switch this up between 0.05−0.1 depending on how far away the pixel is, encoding the fact that more distant pixels tend to be occluded more), and α = (1/256)3 the range of pixel intensities for RGB. As mentioned earlier, the depth is integrated out. To do this, the likelihood must be discretized and convolved with the prior. To discretize the likelihood given for each pixel the likelihood Equation (8) is estimated over a set of disparity hypotheses. Typically
(10)
There is no reason to assume a prior correlation between the parameters and shape of the projection of a plane4 thus Pr (L|I) = Pr (L|I) Pr (|I) . The prior Pr (θ |I) on a given plane’s parameters is assumed to be Gaussian on the parameters a, b, c with zero mean and standard deviations σa , σb and σc . This has a very interesting physical interpretation. If a and b represent the disparity gradients, σa , σb can be chosen to favour fronto-parallel planes, and to control the disparity gradient limit of the plane. This elegantly combines Bayesian reasoning with an old vision heuristic. The parameter σ is a weak prior favouring more distant planes, and penalizes ones that are too close to the camera. These are weak priors and will be overruled by observed data. They serve as a regularization that helps finesses the effects of outliers and ambiguity. The prior Pr (Z|LI) controls the amount of parallax favoured. In real situations points will not always lie exactly on a plane. Yet many surfaces can be modeled as a plane together with some relief leading to the much vaunted plane plus parallax algorithms. However, this idea is typically used as a heuristic without concrete definition. Bayesian methods allow the idea to be made concrete, by defining the distribution of Pr (Z|LI) in terms of a distribution of the parallax from the plane. This allows the plane to be recovered without knowing the disparities. The distribution Pr (Z|LI) is specified in terms of the amount of parallax, as a mean zero Gaussian with σp = 0.5. This may then be convolved with the discretized likelihood specified above. To recover the likelihood that any given pixel belongs to a given layer j, given the plane parameters θj , the integrated likelihood may be used:
j
Pr (D lj I) =
Z
j
j
j
j
Pr (D zI ) Pr (lj I) Pr (z θj I) Pr (θj I) Pr
(11)
¡
lj
¢
˜ jLI
dz
(12)
z
A uniform prior distribution on is taken on z. This is easier than it looks to evaluate, since the integration merely involves 20 multiplications, one for each putative disparity. The prior Pr (L I) represents our belief about the likelihood of the spatial disposition of the world. In the general
j
4 This is not entirely true as one would expect distant objects to be smaller in extent, but we do not consider that here.
case, it is not known how to evaluate this. However, what can be evaluated is the probability that pixel (x; y) has a label k given L. Let lk (x; y) be an indicator variable such that lk (x; y) = 1 if pixel(x; y) is in the k layer, or 0 otherwise. Then
¡
¢ ˜ jlk (x; y)I Pr (lk (x; y)jI) ¡ ¢ Pr L ˜ ¡ ¢ Pr lk (x; y)jLI =
j
˜I Pr L
(13)
the normalizing constant is just
¡
j
¢
X
¡
j=m
˜I = Pr L
¢
j
j
˜ lj (x; y)I Pr (lj (x; y) I) Pr L
:
(14)
j=1
j
The prior Pr (lk (x; y) I) is simply the probability that a given pixel lies in a given layer. In the absence of other information, it seems reasonable that this should be uniform, except however for layer of the plane at infinity l , which is deemed more likely a priori. Given points with low disparity (and hence high variance in Z ) it is reasonable to assignin them to the plane at infinity rather than some arbitrary and ill conditioned plane. Using a factored approximation
1
¡
¢
j
˜ lk (x; y)I Pr L
¤
Y
j
Pr (l(u; v) lk (x; y)I)
:
(15)
uv
As l(u; v) is not known, only its distribution, the above quantity is replaced by its expectation when using EM:
¡
¢
j
˜ lk (x; y)I Pr L
¤
Y j=m X
j
j
Pr (lj (u; v) lk (x; y)I) Pr (lj (u; v) I)
uv j=1
(16) The question then is how to evaluate pjk = Pr (lj (u; v) lk (x; y)I) . What information do we have that might affect this distribution? All that we have a prior is the distance between the points ∆d, and the difference in their colour values ∆c. We would like the following properties for this distribution. If l(u; v) = k, we would pk to be high. If the two pixels are close and or of the similar colour, they are more likely to have the same label, falling off to a probability 1=m (where m is the number of layers), if the pixels are far apart or dissimilar in colour. We would like the converse to also be true: if l(u; v) = k, we would like pk to be low if the pixels have the same colour or are near, rising to m 1=m if they are distant. There is not a clear answer for what this distribution should be. In the future, we hope to try and learn it from the data. In the results section, we shall try several forms for the distribution. Here is one suggestion: the probability that the two pixels belong to the same layer pjk ; j = k could be modeled by a contaminated Gaussian (defined above) Υ(∆c ¡c ; ¦c ; c ; pc ) where pc = 1=m. The mixing parameter c controls the amount of homogeneity expected in the layer, the mean ¡c = 0 and the standard deviation is set to be a function of the distance ¦c = c =∆x. This function satisfies all the desiderata given above, as well as possessing some interesting properties. Consider
j
6
j
the log probability that a given pixel has label log Pr
¡
(
j
¢
˜ = ) LI
lk x; y
X
k
j
log(m Pr (l(u; v) lk (x; y)I) )+ (17)
uv
j
log Pr (lk (x; y) I) + constant: (18) For each pixel nearby that is expected to have label k there will be a positive addition to this log likelihood proportionate to the colour similarity and inverse distance of that pixel. In addition, if neighbouring pixels have a similar colour but are likely to have a label other than k, there is a negative contribution to the log likelihood. Thus if a pixel takes on a particular interpretation it not only excites its neighbours to have a similar interpretation, it also inhibits its neighbours of a similar colour from having a different interpretation.
6
Generalized EM
With the priors specified, the next problem is how to optimize the posterior likelihood of the interpretation. One method of estimation that has been used successfully for estimation of mixtures is the EM algorithm [3] in which the labels are treated as missing data. It is a useful procedure to find the mode of a posterior distribution Pr( D) in which it is hard to maximize Pr( D) directly but easy to work with Pr( LD) and Pr(L D). The EM algorithm proceeds as follows: (1) Estimate the number of layers m, and the parameters of their associated planes using the algorithm described in Section 7. (2) Replace missing data values L by their expectations given the parameters (3). Estimate parameters assuming the missing data are given by their expected values, (3) re-estimate the missing values assuming the new parameters are correct, (4) re-estimate the parameters, and so forth, iterating until convergence. The EM algorithm has the very desirable property that of its cycles will increase the posterior likelihood.
j
j
j
j
E-Step The expectation step proceeds as follows: For a given label lk (x; y), dropping terms that are independent, ¡
j
¡
j
¢
j
˜ lk I Pr (lk I) ¢ Pr (D lk I) Pr L ˜ = P Dθ k LI ; ¡ ¢ j=k ˜ lj I Pr (lj I) Pr (D lj I) Pr L j=1 (19) where the quantities on the right hand side are those estimated at the previous iteration, and ˆ lk is to be estimated. This can be evaluated using equation 12 and 14. Pr ˆ lk
j
j
j
j
M-Step The maximization step involves finding the set of plane parameters that maximize (6). This is computationally difficult if all of the plane parameters are to be maximized simultaneously as in traditional EM, as there are 3m parameters to be determined, where m is the number of layers. Fortunately we can use the ECM algorithm [4], one of the generalized EM algorithms, in which the posterior likelihood still increases at each iteration. Rather than maximize all the parameters simultaneously each plane is maximized in turn using a gradient descent technique whilst the others are held constant. The covariance matrix of each plane is approximated by the Hessian of the error function at the minimum.
Extension The parameters of the noise may also be estimated if desired using the ECM algorithm. This is not done here however.
7
Initialization
‘One forms provisional theories and waits for time or fuller knowledge to explode them. A bad habit, Mr. Ferguson, but human nature is weak’ 5 . The ECM algorithm described in the last section is provable convergent to a maximum of the posterior distribution, which is all well and good, except that typically it will (a) take a very long time to converge (b) converge to a local maximum. The most important thing in a segmentation algorithm is the initialization. The ECM algorithm is no panacea for poor initialization, and for something as complicated as image segmentation, it will get trapped in local minima unless started with a good solution. Careful examination of Bayesian methods and the effects of data on the cost function lead to a more insightful approach.
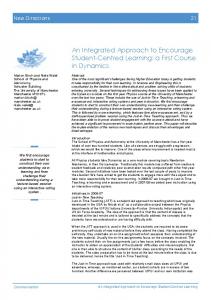
approximately normally distributed around its mode, discounting the effect of spatial correlation (this is not so bad as it sounds, as there is less spatial correlation between a sparse set of features, and this is only an approximation to get a rough idea as to how many layers we should use). The details of this calculation using Laplace’s approximation are not given here due to space consideration and the reader is referred to a detailed explanation given in Sivia [6] page 88. Figure 1 shows the graphs of the approximated unnormalized posterior likelihood given models M comprising different numbers of layers. −800
−1000
−1200 −1200 −1400 −1400 −1600 −1600 −1800
−1800
−2000
Choosing the number of layers to maximize the posterior likelihood. The Bayesian method for model selection is encapsulated by (2) and the evaluation of the evidence for each model (one layer, two layers, three layers etc. ). Evaluation of the evidence involves integrating the posterior probability (6) over the prior range of the parameters. At present, this is simply not computationally feasible, so we must think of a good approximation to the evidence. Examination of the posterior probability (6) reveals that only pixels that have a high P entropy distribution for Pr( p log p, with PD zI ) (entropy is simply normalization p = 1) will affect the posterior distribution of . This is simply the intuition that pixels for which there is great uncertainty about a correspondence (e.g. those within homogeneous regions) contribute little to the accuracy of the estimation of the plane parameters. Thus, computational effort is concentrated on those pixels with high entropy. To detect these, a feature extractor is run on the first image, and features with high entropy used as input to the algorithm. Next, for each model Mi , with i layers, i = 1 : : : k the 3i parameters of the plane i are robustly estimated from the high entropy points. To do the robust estimation, a RANSAC like algorithm is used (which shall be referred to as PILLAGE), but with a vast improvement. Rather than maximize the number of inliers the posterior (6) itself is estimated for each sample. The PILLAGE algorithm proceeds as follows: (1) simultaneously sample 3 spatial close points for each plane, (2) estimate the parameters of each plane θ i , i = 1 : : : k, (3) estimate label probabilities (one step of EM), (4) calculate the posterior for this set of plane parameters. The sampling is repeated a fixed number of times, the best result stored, and then GEM is used to improve the result. In this way we can get initializations of the plane parameters for each Mi . The evidence can then be approximated assuming that each of the estimated plane parameters is
j
5 Sherlock
Holmes, The Adventure of the Sussex Vampire.
−800
−1000
−2000
0
1
2
3
4
(a)
5
6
7
−2200
0
1
2
3
4
5
6
7
(b)
Figure 1: The unnormalized approximation to the posterior likelihood of the number of layers for (a) the garden (b) the Dayton sequences. For the garden sequence it can be seen that after four layers are selected the graph levels off with further layers contributing little. For three layers in the Dayton example. Radial Basis Functions as Model for Shape Once the number of layers has been estimated, the labels can be initialized. One possibility is to set them all equiprobable, but for little computational effort, it is possible to do much better. Suppose that we had some underlying representation of shape in our problem given by a set of shape parameters S. The joint distribution of the shape and label parameters is Pr (L; SjI) = Pr (LjSI) Pr (SjI)
(20)
thus we have now replaced the prior Pr (LjI) with the prior Pr (SjI). If S is chosen judiciously it can have far fewer parameters than L and a much simple prior distribution. The simplifying model we choose is a set of basis points, namely the high entropy points that we have extracted. The key intuition is that rather than attempt to model the complex distribution of the labels, we use a set of basis functions centred on each of the high entropy pixels. The initialization provides us with the set of high entropy points and their distribution over labels. Using Equation (18) we can update the log likelihood of all the pixels within a neighbourhood by a simple additive term. Using (12) and (19) the conditional probability of each label l(x; y) calculated. This procedure provides a very good first estimate of the labelings. In fact, the initialization is so good that it seems that it would be better to do the GEM algorithm treating the S (the locations of the basis points) as missing parameters. We are currently investigating this possibility.
(a)
(e)
(i)
(m)
(q)
(t)
(b)
(f)
(j)
(n)
(r)
(u)
(c)
(g)
(k)
(o)
(s)
(v)
(d)
(h)
(l)
(p)
(t)
(w)
Figure 2: (a)-(d) four images of the garden sequence, (e)-(h) four images of the symposium sequence (provided by kind permission of Dayton Taylor) (i)-(k) top three layers with high entropy features superimposed on them. (l) Label image, cyan represents uncertain regions that have low confidence. (m)-(o) top three layers with high entropy features superimposed on them for Dayton Taylor sequence. (p) label image. (q)-(w) top four layers for each example sequence.
(a)
(b)
(c)
(d)
Figure 3: (a)-(c) Effects of changing the prior by large amounts: (a) increased smoothness prior, (b) fronto parallel, (c) decreased smoothness prior (note that the twigs and branches are detected as seperate from the background) (d) Ambiguous piece of sky in the Dayton Taylor sequence.
8
Results
Figure 2 shows results on two sequences of six images: the MPEG garden sequence, and the Dayton Taylor symposium sequence. As the amount of support for the plane gets smaller, the parameters of the plane normal become increasing ill conditioned. Note for instance that the layer in 2 (o) is largely determined by the white haired fellow in the red shirt, and was fairly ill conditioned. It can be likened to a door on a hinge looking for something to latch on to–in this case it latched onto the jolly man on the left waving his arms in the air. This has happened for the layer shown in (r) to a lesser extent which is anchored by the large lady and the tree. In the garden sequence (v) it is very difficult to segment the sky from the trees, as in this sequence the sky provides very little motion information being largely homogeneous, unless the prior on continuity for colour is turned up. But there is always a danger in choosing our prior that we see what we want to see. The effects of changing the prior on the Garden sequence segmentation are shown in 3 (a) for a prior with the smoothness turned up, (b) for a prior favouring fronto-parallel planes, and (c) with smoothness turned down. In keeping with the Bayesian approach one should not only report the mode of the posterior but also solutions that might be “nearly as good”. In Figure 3 (d) show another possible layer for the Dayton Taylor sequence that could also be part of any of the other layers with little change in the posterior likelihood as it is contains relatively little information (low entropy).
9
Summary and Conclusions
In this paper, we have developed a novel Bayesian framework for segmenting a 3D scene into threedimensional layers. Several pieces of evidence are aggeragated within an Expectation Maximization algorithm: the original votes from the image data as to the likelihood of a given disparity; the deviation from the plane equation of a particular layer; and the spatial and colour support of nearby pixels lying on the same layer. Because we use a Bayesian formulation, we can integrate all of the evidence for a particular layer (e.g., using an integral over all disparities weighted by the distance of a disparity to the plane), rather than relying on the most likely estimate (mode) provided by a traditional stereo algorithm. To initialize our EM algorithm, we select disparities at
high-confidence locations (corners). We then interpolate these estimates using radial basis functions to obtain an initial segmentation, which can be used to bootstrap the EM algorithm. The radial basis functions are based not only on spatial proximity, but also on similarity in colour space. We believe that the Bayesian framework developed in this paper provides a more principled approach to estimating layers than previous approaches. Instead of relying on heuristic assumptions such as smoothness or planarity, we are able to express our prior assumptions about the scene and the imaging process explicitly. The number of layers as well as the assignment of individual pixels to layers is automatically determined. Within this paper several diverse strands of reasoning have been brought together in a Bayesian framework. The benefit of this framework is that it can readily be expanded to incorporate new sources of information (good or bad) such as occlusion, shadows, reflection, transparency, specularities via the use of generative models. The utility is, that it given your assumptions about the world are reasonable, it provides reasonable solutions.
References
[1] S. Baker, R. Szeliski, and P. Anandan. A layered approach to stereo reconstruction. In IEEE Computer Society Conference on Computer Vision and Pattern Recognition (CVPR’98), pages 434–441, Santa Barbara, June 1998. [2] J. R. Bergen, P. Anandan, K. Hanna, and R. Hingorani. Hierarchical model-based motion estimation. In Proc. 2nd European Conference on Computer Vision, LNCS 588, Santa Margherita Ligure, pages 237–252, 1992. [3] A. P. Dempster, N. M. Laird, and D. B. Rubin. Maximum likelihood from incomplete data via the EM algorithm (with discussion). Journal of the Royal Statistical Society series B, 39:1–38, 1977. [4] A. Gelman, J. B. Carlin, H. S. Stern, and D. B. Rubin. Analysis. Chapman & Hall, New York, 1995.
Bayesian Data
[5] E. T. Jaynes. Probability theory as extended logic. Not yet published a postscript version of this excellent book is available at ftp://bayes.wustl.edu/pub/Jaynes/, 1999. [6] D. S. Sivia. Data Analysis, A Bayesian Tutorial. Clarendon, Clarendon, Oxford, 1996. [7] R. Szeliski. A multi-view approach to motion and stereo. In IEEE Computer Society Conference on Computer Vision and Pattern Recognition (CVPR’99), Fort Collins, June 1999. [8] J. Y. A. Wang and E. H. Adelson. Layered representation for motion analysis. In IEEE Computer Society Conference on Computer Vision and Pattern Recognition (CVPR’93), pages 361–366, New York, New York, June 1993.