CBCL-278. June 20, 2009. An integrated model of visual attention using shape-based features. Sharat Chikkerur, Cheston Tan, Thomas Serre, and. Tomaso ...
Computer Science and Artificial Intelligence Laboratory Technical Report MIT-CSAIL-TR-2009-029 CBCL-278
June 20, 2009
An integrated model of visual attention using shape-based features Sharat Chikkerur, Cheston Tan, Thomas Serre, and Tomaso Poggio
m a ss a c h u se t t s i n st i t u t e o f t e c h n o l o g y, c a m b ri d g e , m a 02139 u s a — w w w. c s a il . mi t . e d u
An integrated model of visual attention using shape-based features Sharat Chikkerur
Cheston Tan Thomas Serre Tomaso Poggio Center for Biological and Computational Learning, MIT
—————————————————————-
Abstract Apart from helping shed some light on human perceptual mechanisms, modeling visual attention has important applications in computer vision. It has been shown to be useful in priming object detection [16, 29], pruning interest points [26], quantifying visual clutter [23] as well as predicting human eye movements [17]. Prior work has either relied on purely bottom-up approaches [11] or top-down schemes using simple low-level features [16, 19]. In this paper, we outline a top-down visual attention model based on shape-based features. The same shape-based representation is used to represent both the objects and the scenes that contain them. The spatial priors imposed by the scene and the feature priors imposed by the target object are combined in a Bayesian framework to generate a task-dependent saliency map. We show that our approach can predict the location of objects as well as match eye movements (92% overlap with human observers). We also show that the proposed approach performs better than existing bottom-up and top-down computational models.
‘Count cars’
‘Count pedestrians’
Figure 1: Human eye movements are heavily influenced by the search task. Eye-tracking data from human subjects (red circles) show that the same image can elicit different eye movements based on the search task [36]. The goal of our computational model is to predict the regions of the image (green) that will attract human eye movements as well as the true object locations.
[26], quantifying visual clutter [23] and predicting human eye movements [17]. Human and animal studies (see [34] for a recent review) have isolated at least three main components used to guide the deployment of an attentional spotlight: (1) Studies have shown that image-based bottom-up cues can capture attention, particularly during free viewing conditions. A measure that has been shown to be particularly relevant is the local image salience (i.e., the local feature contrast), which corresponds to the degree of conspicuity between that location and its surround [11]. (2) Task dependence also plays a significant role in visual search [34]. Evidence for top-down feature-based attention comes from both imaging studies in humans [13] as well as monkey electrophysiology studies [14]. (3) Structural associations between objects and their locations within a scene or contextual cues, have been shown to play a significant role in visual search and object recognition [30].
1. Introduction The recognition of multiple objects in cluttered visual scenes is a difficult problem for biological as well as machine vision systems. Computer vision techniques typically rely upon scanning the entire image to detect multiple objects within the scene. However, the human visual system prefers two stages of visual processing: a pre-attentive parallel processing stage, in which the entire visual field is processed at once and a slow serial attentive processing stage, in which a region of interest in an input image is selected for “specialized” analysis by an attentional spotlight. Understanding how human observers attend to objects in complex natural images is an important part of understanding how the visual cortex processes visual information. In addition, modeling visual attention has important applications in computer vision. It has been shown to be useful in priming object detection [16, 29], pruning interest points
How the visual system combines these cues and what the underlying neural circuits are, remain however largely unknown. In this paper, we explore the role of the individual cues and show that a Bayesian combination of all the cues can predict very well, human eye movements in a search task. 1
1.1. Prior related work Our work builds on a number of computational [32, 11, 21, 31, 33] and conceptual proposals [34] that have been suggested over the years to explain visual search tasks (see [33] for a recent review). Work on modeling visual attention most related to our approach can be characterized based on the type of cues that are used and how they are combined (summarized in Table 1). Models that rely exclusively on bottom-up cues [11, 37, 33] cannot account for top-down task dependent eye movements exhibited by human subjects [36]. Depending on the search tasks, human eye movements may differ substantially even when the stimuli are identical (see Fig.1). In this work, we consider bottom-up cues in conjunction with other cues and not in isolation. Computational models that use feature-based cues have relied upon low-level features such as color, contrast, orientation [19, 16] that are too simple for real-world object-based visual searches. In this work, we utilize biologically inspired shape-based features [28] that are better suited for object-based searches. With the exception of [30], contextual cues have not been used to model visual attention in real-world images. In reality, the visual scene (context) imposes a strong constraint on the location, size and identity of the objects. In this work, we propose a shape-based representation for scene context that is highly predictive of eye movements. Recently, Ehinger et al. [12] used a combination of feature, gist and bottom-up saliency to predict human eye-movements. The cues are combined using a weighted summation, with the weights designed to maximize human agreement over a cross-validation set. In this report, we describe an integrated approach that optimally1 combines bottom-up as well as top-down (feature-based and context-based) cues within a probabilistic Bayesian framework.
2. Our approach We present a computational model of spatial and featurebased attention that is consistent with recent physiological evidence. It is inspired by a Bayesian model of spatial attention proposed by Rao [22]. We extend the model to include top-down feature-based attention and incorporate it within a biologically plausible model of the ventral stream [28]. The main addition to the model is the inclusion of cortical feedback within ventral stream (providing feature-based attention) and areas from parietal cortex (providing spatial attention). We also introduce feed-forward connections to the parietal cortex that serves as a ’saliency map’ that encodes the visual relevance of individual locations. 1 In the sense that a Bayesian approach maximizes the likelihood of the observed data.
PFC
O
IT
Fi
LIP (FEF)
L
V4 Spatial attention Feature attention Feed forward Saliency
F li N
V2
I
Figure 2: Left: A model illustrating the interaction between the parietal and ventral streams through feed forward and feedback connections. Right: The proposed Bayes network that attempts to explicitly model these interactions.
2.1. Computational model The model takes as input gray-value images. The first stage consists of arrays of shape-based feature detectors (n ∼ 1000) at all positions and scales (see Fig. 2 and [27, 28] for details). These feature maps, which mimic visual processing in areas V4 and PIT, are denoted with the variable Fil , , which encodes the presence of feature Fi at location l. The next stage corresponds to cells in IT (Fi units) with larger receptive fields, which have been shown to be selective to shape features and object parts while being invariant to position and scale (see [27] for details). Each Fi unit pools over afferent Fil units at all locations and
Fukushima et al. [8] Itti et al. [11] Cottrell et al. [37] Gao and Vascancelos [10] Hou and Zhang [35] Navalpakkam and Itti [16] Gao and Vascancelos [9] Torralba et al. [30] Walther et al. [33] Proposed
BU No Yes Yes Yes Yes No No Yes Yes Yes
Loc No No No No No No No Yes Yes Yes
Sc No No No No No No No Yes No Yes
Feat Yes No No No No Yes Yes No Yes Yes
R-W No Yes Yes Yes Yes Yes Yes Yes Yes Yes
Comb N/A N/A Bayes N/A N/A Lin N/A Bayes N/A Bayes
Table 1: A summary of the differences between different approaches to model attention and eye movements. The various approaches are compared based on the type of cues that are used to derive a saliency map, how those cues are combined and whether the work was evaluated on realworld images. ’BU’ column indicates if bottom-up cues are used, ’Loc’ (location) and ’Sc’ (scale) columns indicate if contextual cues are used to predict object location and scale respectively. The ’Feat’ (feature) column indicates if the model relies on top-down feature cues. ’RW’ (real-world) shows if the model has been evaluated on real world images. In cases where multiple cues are combined, ’Comb’ (combination) indicates if the combination is Bayesian (’Bayes’) or linear (’Lin’).
scales. In this work, we assume that the receptive field of the feature (F i ) units includes the entire image. Fi units, in turn, project to object-selective O units at the next stage (in higher areas of the ventral stream and/or the prefrontal cortex (PFC) [7]). Finally, the model includes a saliency map (location-selective L units), which, consistent with physiology data [4, 2], is assumed to be in the parietal cortex. L units form a multi-scale feature-invariant saliency map that represents how behaviorally relevant each image location is. Each L unit pools over all Fjl units (j = 1 . . . n) at a particular location l. The model contains two main components: (i) A topdown feature-based modulation from object selective O units onto Fil units via a cascade of back-projections within the ventral stream. The arrays of feature detectors Fil in intermediate areas of the ventral stream are assumed to be modulated according to how diagnostic they are for the specific categorization task at hand [34, 14]. For instance, if the task is to find a pedestrian, the pedestrian-selective O units at the top will modulate units in lower areas that are important to discriminate between pedestrians vs. the background. The main effect of this feature-based modulation is a suppression of the response of task-irrelevant but otherwise “salient” units so as to bias the saliency map towards task-relevant locations. (ii) Spatial attention implemented as location/scale prior effectively shrinks the receptive fields of the Fi units around the attended region [5]. The location to be attended may be specified explicitly using a visual cue or may be indirectly guided by visual context(similar to [31]). The relative dynamics between these two components is governed by a series of messages passed within the ventral stream and between the ventral stream and the parietal cortex, which we describe in the appendix. In the following, we describe feature-based and spatial attention in further detail.
2.2. Feature-based attention The model presented here relies on a dictionary of shapebased features of intermediate complexity as found in biological visual systems [28], rather than low-level features (orientation, color, contrast, etc.) as in previous work [11, 21, 31]. The proposed shape-based representation is better suited to represent high-level objects (e.g., cars and pedestrians) than simple oriented features. In [33], a single most discriminative shape feature feature is used to guide attention. Here instead we turn to a probabilistic Bayesian framework to learn priors from a training set of images, which can then be used to modulate the activity of an entire population of shape features during a search task and bias the saliency map towards locations that are behaviorally relevant. We show that the same basic dictionary of features can be shared between different objects (here, cars and pedestrians) to guide attention.
In this work, we make the assumption that the distribution of local features is independent of the context. Further, we assume that the distribution of features is affected only by the identity of the object and not by its scale or position. The feature are scale invariant by construction [28]. Finally we assume that features are binary (indicating the presence or absence of a particular shape at any given location). Training: To train the model, we used part of the CBCL Street scene database [1] and part of LabelMe [25]. We used about 32000 training examples (crops) total that included pedestrians and cars (around 3000 positive examples each). The negative examples were randomly extracted from the database, and then pruned to exclude regions that overlapped with cars or pedestrians. To train the model, we started by extracting 1000 shape prototypes randomly from training data as in [28]. Using this data, 200 features were selected using a feature selection process based on mutual information [6]. Probabilities P (Fi |O) were obtained via maximum-likelihood estimation.
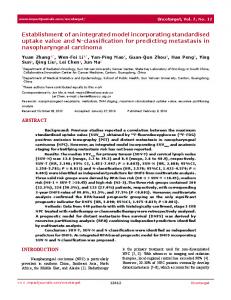
2.3. Context guided spatial attention The spatial prior on object location P (L) may be provided explicitly (e.g. using a visual cue to specify where attention is to be directed) or may be derived indirectly based on the search task and scene context. Torralba et al. [31] showed that a holistic representation of the scene (i.e., gist) can be used to predict the location and scale priors of objects in a scene. In their approach, each scene was represented using spatial and amplitude distributions of oriented filter responses. In this work, we estimate the spatial prior P (L) based the visual context provided by the scene and constraints imposed by the search task. Training: Here, we consider ∼ 500 shape-based units to represent the “shape” of the scene. These units have a larger receptive field compared to the ones used for representing objects, but are derived using the same computation [28]. The responses are pooled in a 3 × 3 overlapping grid (each grid corresponding half the width of the original image) using a max operation. This permits the detection of local image configurations in a translation invariant manner [28]. The resulting 4500 dimensional vector is further reduced to 32 dimensions using PCA. This 32 dimensional vector represents the “context” of the objects in the scene that can be used to determine likely locations of objects in the scene. We use a mixture-of-regressors as in [15] to learn the mapping between the context features and location/scale priors for each object. Fig. 3 shows the result of a manifold-learning analysis [24] directly on the output of the |K| = 5 experts trained on the street scenes (each image point is assigned to an expert – one color for each expert
1
0.5
0
−0.5 −0.6
−0.4
−0.2
0
0.2
0.4
0.6
0.8
1
Figure 3: Visual inspection suggests that centers in the mixture of experts correspond to canonical street scenes (see text for details)
– by soft-assignment on the corresponding probability distributions). Visual inspection suggests that the mixture of experts learned canonical views of the street scenes (e.g. dark blue centers being “side views with building” while light blue centers represent far views). Overall the analysis reveals that the shape-based features are able to capture the smooth variations going from one canonical view to another, thus providing a good representation for the scene.
3. Experimental results 3.1. Predicting human eye movements As assumed in several previous psychophysical studies [11, 21, 31], we treat eye movements as a proxy for shifts of attention. Stimuli: We manually selected 100 images (containing cars and pedestrians) from the CBCL Street-scene database [1], while an additional 20 images that did not contain cars or pedestrians, were selected from LabelMe [25]. These 120 images were excluded from the training set of the model. On average, images contained 4.6 ± 3.8 cars and 2.1 ± 2.2 pedestrians. Images (640 × 480 pixels) were presented at a distance of about 70 cm, roughly corresponding to 16◦ × 12◦ of visual angle. Task: We recruited 8 human subjects (age 18 − 35) with normal or corrected-to-normal vision. Subjects were paid and gave informed consent. Using a block design (120 trials per block), participants were asked to either count the number of cars or the number of pedestrians. Task and presentation order were randomized for each subject. Every image
was presented twice: once for pedestrians and once for cars. No instructions regarding eye movements were given, except to maintain fixation on a central cross in order to start each trial. Each image was then presented for a maximum of 5 seconds, and within this time observers had to count the number of targets (cars or pedestrians) and press a key to indicate completion. Subjects then verbally reported the number of targets present, and this was recorded by the experimenter. We verified that reported counts agreed well with the actual number of targets. We used an ETL 400 ISCAN table-mounted, video-based eye tracking system to record eye position during the course of the experiment. Eye position was sampled at a rate of 240 Hz with an accuracy of about 0.5◦ of visual angle. Quantitative results: There are at least two measures that have been used to compare models of attention to human fixations: normalized scan path saliency (NSS) from [19] and fixations in the most salient region (FMSR) from [31]. For brevity, we only report results using the FMSR measure, but qualitatively similar results were obtained for NSS. For each stimulus and task, we calculated an FMSR value by first thresholding the computed saliency map, retaining only the most salient pixels. The FMSR index corresponds to the percentage of human fixations that fall within this most salient A higher value indicates better agreement with human fixations. To calculate inter-subject consistency, we generated a saliency map by pooling fixations from all but one subject in a manner similar to [31], and then tested the left-out subject on this map. Thus, inter-subject consistency measures performance by a model constructed from human fixations, which is in some sense
Bottom up [11] Bottom up (proposed) Context [31] Context (proposed) Feature-based (proposed) Full model (proposed) Humans
1 0.443 ± 0.025 0.694 ± 0.017 0.802 ± 0.044 0.821 ± 0.045 0.755 ± 0.023 0.831 ± 0.026 0.828 ± 0.060
Car Fixations 2 0.432 ± 0.025 0.683 ± 0.014 0.797 ± 0.045 0.805 ± 0.045 0.738 ± 0.025 0.814 ± 0.027 0.877 ± 0.041
3 0.423 ± 0.023 0.677 ± 0.013 0.789 ± 0.045 0.795 ± 0.044 0.730 ± 0.027 0.804 ± 0.027 0.878 ± 0.033
1 0.441 ± 0.027 0.701 ± 0.016 0.779 ± 0.074 0.799 ± 0.077 0.714 ± 0.019 0.820 ± 0.050 0.847 ± 0.077
Pedestrian Fixations 2 0.423 ± 0.029 0.705 ± 0.016 0.788 ± 0.072 0.787 ± 0.075 0.706 ± 0.018 0.810 ± 0.051 0.847 ± 0.077
3 0.423 ± 0.021 0.698 ± 0.013 0.771 ± 0.071 0.780 ± 0.074 0.694 ± 0.020 0.801 ± 0.050 0.874 ± 0.034
Table 2: Here we compare the individual cues in its ability to predict human eye movements. The values indicate the area under the ROC. For each object, the ability of the models to predict the first three fixations are indicated.
an “ideal model”. We generated an ROC curve by continuously varying the threshold. The area under the ROC curve provides an effective measure of agreement to human observers. Table 2 compares the contribution of different cues in predicting eye movements. Comparisons with existing methods are also shown. We considered several models that rely on different types of visual cues, and compared these against inter-subject consistency (denoted as Humans): Bottom-up corresponds to the saliency model by Itti & Koch [11] using the implementation available at (http://saliencytoolbox.net). Features and Context correspond to the Bayesian model as described above, which rely on either feature-based or context-based cues only. Finally, Full-Model corresponds to the full Bayesian model that relies on bottom-up, feature-based and context-based cues. The results in Table 2 suggest that the Full Model accounts for the very first fixations well (especially for cars). Beyond the first saccade, the agreement between model and human fixations decreases while those between human subjects increases. The higher relative contribution of the gist to the overall prediction is not surprising, since street scenes have strong spatial constraints regarding the locations of cars and pedestrians. It would be interesting to test the models on stimuli without context e.g., isolated objects on a plain background. Overall, the Bottom-up model [11] does the worst. Both the proposed features only and the context only models perform significantly better than Bottomup. In addition, a model combining all cues does better than either in isolation. Overall, the proposed model (combining feature-based and contextual cues) achieves 92% of human performance on both pedestrian and car search tasks (measured in terms of the overlapping ROC area for the first three fixations). The discrepancy between human subjects and the model may be attributed to information available to humans but not to the model. Humans routinely utilize higher level visual cues (e.g., location of ground-plane) as well non-visual information (e.g., pedestrians are found on pavements and cross walks) while examining a visual scene. We speculate that the performance gap between the model
and human subjects could be further reduced by utilizing such higher-level information and will be pursued in our future work.
3.2. Predicting location of objects Attention-based systems can be used to prime object detectors [31]. Here, we present quantitative results showing the ability of the model to predict the location of objects. Table 3 shows that the percentage of object locations that are correctly predicted using different cues and models. An object was said to be correctly detected if its center lied in the thresholded saliency map. An ROC curve can be obtained by varying the threshold on the saliency measure. The area under the ROC curve provides an effective measure for predictive ability of the individual models. The context (gist) representation derived from shape-based units performs better than the representation based on simple oriented features [31]. Also, bottom-up cues derived using the proposed shape-based features performs better than bottomup saliency obtained using simple oriented features [11].
4. Conclusion We described a Bayesian model of attention that integrates bottom-up, feature-based and context-based attentional mechanisms. Testing the model against human eye movements, we found that either feature or contextual cues in isolation predicted eye movements much better than bottom-up saliency cues, and a model combining all of
Bottom up (proposed) Bottom up [11] Context [31] Context (proposed) Features (proposed) Full model (proposed)
Car 0.667 0.437 0.800 0.813 0.688 0.818
Pedestrian 0.689 0.390 0.763 0.793 0.753 0.807
Table 3: Here we compare the individual cues on their ability to predict object locations. The values indicate the area under the ROC.
these cues performs better than either component in isolation. The performance gap between the model and human subjects may be attributed to visual cues and non-visual information available to humans but not the model. In addition to explaining human eye movements, the proposed model also accurately predicts the location of objects within the scene and can therefore be used to prime object detectors in computer vision applications.
[14] J. H. Maunsell and S. Treue. Feature-based attention in visual cortex. Trends in Neuroscience, 29(6):317–22, 2006.
5. Acknowledgements
[17] A. Oliva, A. Torralba, M. S. Castelhano, and J. M. Henderson. Top-down control of visual attention in object detection. In International Conference on Image Processing, 2003.
The authors wish to thank Aude Oliva and Barbara Hidalgo-Sotelo for the use of, as well as help with, the eyetracker.
References [1] S.M. Bileschi. StreetScenes: Towards scene understanding in still images. PhD thesis, MIT, 2006. [2] T.J. Buschman and E.K. Miller. Top-Down Versus BottomUp Control of Attention in the Prefrontal and Posterior Parietal Cortices. Science, 315(5820):1860, 2007. [3] M. Carandini, D.J. Heeger, and J.A. Movshon. Linearity and normalization in simple cells of the macaque primary visual cortex. Journal of Neuroscience, 17(21):8621–8644, 1997. [4] C. Constantinidis and M. A. Steinmetz. Posterior parietal cortex automatically encodes the location of salient stimuli. J Neurosci, 25(1):233–8, 2005. [5] R. Desimone and J. Duncan. Neural mechanism of selective visual attention. Annual Review of Neuroscience, 18:193– 222, 1995. [6] F. Fleuret. Fast binary feature selection with conditional mutual information. The Journal of Machine Learning Research, 5:1531–1555, 2004.
[15] K. Murphy, A. Torralba, and W.T. Freeman. Using the forest to see the trees: a graphical model relating features, objects and scenes. Advances in Neural Information Processing Systems, 16, 2003. [16] V. Navalpakkam and L. Itti. An integrated model of top-down and bottom-up attention for optimizing detection speed. In Computer Vision and Pattern Recognition, 2006.
[18] J. Pearl. Probabilistic Reasoning in Intelligent Systems: Networks of Plausible Inference. Morgan Kaufmann Publishers, 1988. [19] R. J. Peters and L. Itti. Beyond bottom-up: Incorporating task-dependent influences into a computational model of spatial attention. In Computer Vision and Pattern Recognition, Minneapolis, MN, 2007. [20] M.I. Posner and Y. Cohen. Components of visual orienting. Attention and performance, pages 531–556, 1984. [21] R. P. N. Rao, G. J. Zelinsky, M. M. Hayhoe, and D. H. Ballard. Eye movements in iconic visual search. Vision Research, 42(11):1447–1463, 2002. [22] R.P.N. Rao. Bayesian inference and attentional modulation in the visual cortex. Neuroreport, 16(16):1843–1848, 2005. [23] R. Rosenholtz and J. Mansfield. Feature congestion: a measure of display clutter. In Proceedings of the SIGCHI conference on Human factors in computing systems, pages 761– 770. ACM New York, NY, USA, 2005. [24] S.T. Roweis and L.K. Saul. Nonlinear dimensionality reduction by locally linear embedding. Science, 290(5500):2323– 2326, 2000.
[7] D. J. Freedman, M. Riesenhuber, T. Poggio, and E. K. Miller. Categorical representation of visual stimuli in the primate prefrontal cortex. Science, 291(5502):312–6, 2001.
[25] B.C. Russell, A. Torralba, K.P. Murphy, and W.T. Freeman. LabelMe: A Database and Web-Based Tool for Image Annotation. International Journal of Computer Vision, 77(1):157– 173, 2008.
[8] K. Fukushima. A neural network model for selective attention in visual pattern recognition. Biological Cybernetics, 55(1):5–15, 1986.
[26] U. Rutishauser, D. Walther, C. Koch, and P. Perona. Is bottom-up attention useful for object recognition? In Computer Vision and Pattern Recognition, volume 2, 2004.
[9] D. Gao and N. Vasconcelos. Integrated learning of saliency, complex features, and object detectors from cluttered scenes. In Computer Vision and Pattern Recognition, 2005.
[27] T. Serre, M. Kouh, C. Cadieu, U. Knoblich, G. Kreiman, and T. Poggio. A theory of object recognition: computations and circuits in the feedforward path of the ventral stream in primate visual cortex. AI Memo 2005-036 / CBCL Memo 259, MIT, 2005.
[10] D. Gao and N. Vasconcelos. Bottom-up saliency is a discriminant process. In International Conference on Computer Vision, 2007. [11] L. Itti and C. Koch. Computational modelling of visual attention. Nature Reviews, Neuroscience, 2(3):194–203, 2001. [12] Ehinger K., Hidalgo-Sotelo B., Torralba A., and Oliva A. Modeling search for people in 900 scenes: Close but not there yet. Visual Cognition, 2009. [13] N. Kanwisher and E. Wojciulik. Visual attention: insights from brain imaging. Nature Reviews, Neuroscience, 1(2):91– 100., 2000.
[28] T. Serre, Wolf L., S. Bileschi, M. Reisenhuber, and T. Poggio. Robust object recognition with cortex-like mechanisms. IEEE Transactions on Pattern Analysis and Machine Intelligence, 2007. [29] A. Torralba. Contextual Priming for Object Detection. International Journal of Computer Vision, 53(2):169–191, 2003. [30] A. Torralba. Modeling global scene factors in attention. Journal of Optical Society of America, 20(7):1407–1418, 2003.
Figure 4: Sample images overlaid with most salient (top 20%) regions predicted by the model (green) along with human eye movements (yellow: agree with prediction, red: not predicted by model). Only the first fixation from all the subjects are shown. (a,b,c) The model prediction agrees well with human eye movements.(d) context and bottom-up cues predict human eye movements even in the absence of the targets. (e) The model prediction disagrees with some of the human eye movements.
[31] A. Torralba, A. Oliva, M. S. Castelhano, and J. M. Henderson. Contextual guidance of eye movements and attention in real-world scenes: the role of global features in object search. Psychological Review, 113(4):766–86, 2006. [32] J. K. Tsotsos, S. M. Culhane, W. Y. K. Wai, Y. H. Lai, N. Davis, and F. Nuflo. Modeling visual-attention via selective tuning, 1995. [33] D.B Walther and C. Koch. Computational Neuroscience: Theoretical insights into brain function, Progress in Brain Research, chapter Attention in Hierarchical Models of Object Recognition. 2007. [34] Jeremy M. Wolfe. Guided search 4.0: Current progress with a model of visual search. Integrated Models of Cognitive System, pages 99–119, 2007. [35] Hou X. and Zhang L. Saliency detection: A spectrial residual approach. In Computer Vision and Pattern Recognition, 2007. [36] A. Yarbus. Eye movements and vision, 1967. [37] L. Zhang, M. H Tong, T. K Marks, H. Shan, and G. W Cottrell. Sun: A bayesian framework for saliency using natural statistics. Journal of Vision, 8(7):1–20, 2008.
APPENDIX
A. Computational Model We implemented the Bayesian network using Kevin Murphy’s Bayesian toolbox available at http://bnt.sourceforge.net. The Bayesian model consists of a location encoding unit (L), object encoding units O, non-retinotopic feature encoding units F i and combination units Fli , that encode position-feature combinations. These units receive input I from lower areas in the ventral stream. L models LIP area in the parietal cortex and encodes position and scale independently of features. F i units model non-retinotopic, spatial and scale invariant cells found in higher layers of the ventral stream. More details about the model units are provided in Table 4 and Table 4. The relative dynamics between these three main components is governed by a series of messages passed within the ventral stream and between the ventral stream and the parietal cortex, which we describe below.
A.1. Message passing in the model Within the Bayesian framework, feed forward signals are interpreted as bottom-up evidence and top down feedback are modeled as priors. Given the input image, the posterior probability over location corresponds to the saliency map. In order to understand the model, we examine the messages passed between units in the system under a single feature . We adopt the notation proposed in [22], where the top-down messages, π() and bottom-up messages λ() are replaced by a uniform m() term.
mO→F i
=
mF i →F i
=
l
P (O) X P (F i |O)P (O)
(1) (2)
O
mL→F i l
mI→F i l
mF i →F i l
=
P (L)
(3)
=
P (I|Fli )
(4)
=
XX
l
L
mF i →L l
=
P (Fli |F i , L)(mL→F i )(mI→F i ) (5) l
Fli
XX
P (Fli |F i , L)(mF i →F i )(mI→F i )(6) l
Fi
l
Fli
The first three messages correspond to the priors imposed by the task. The rest correspond to bottom-up evidence propagated upwards within the model. The posterior probability of location (saliency map) is given by P (L|I) ∝ P (L)(mFli →L )
(7)
The constant of proportionality can be resolved after computing marginals over all values of the random variable. Thus, the saliency map is influenced by task dependent prior on location P (L), prior on features P (F i |O) as well as the evidence from the ventral stream mFli →L . Multiple features: Under multiple features, the Bayesian inference proceeds as in a general polytree [18]. Most messages remain identical. However, the bottom-up evidence for location is influenced by the presence of other features and is now given by, mL→Fli
= P (L)
Y
mF j →L
(8)
mFli →L
(9)
l
j6=i
P (L|I) ∝ P (L)
Y i
A.2. Model properties A.2.1
Translation invariance
The F i units encode the presence or absence of individual features in a translation/scale invariant manner. The invariance is achieved by pooling responses from all location. The posterior probability of the feature F i is given by P (F i |I) ∝ (mF i →Fli )(mFli →F i ) (10) XX mFli →F i = P (Fli |F i , L)P (L)P (I|Fli )(11) L
Fli
Spatial invariance is achieved by marginalizing (summing over) the L variable. Thus, F i behaves similarly to nonretinotopic feature units found in the ventral stream [27].
A.2.2
Spatial attention
Generating an attentional spotlight for spatial attention corresponds to concentrating the prior P(L) around the location/scale of interest. (2) This change in prior is propagated from L to Fil (through messages in the Bayesian network). This results in a selective enhancement of all feature maps Fil for i = 1 . . . n at locations l1 . . . lm where the attentional spotlight P(L) is placed and suppression at other locations, (3) effectively shrinking the receptive field of the non-retinotopic Fi units at the next stage. The message passing is initiated in the L units (assumed to be in parietal cortex) and manifests itself after a short delay in the Fi units (found in the ventral stream), in agreement with physiological data [2]. Thus, spatial attention results in a sequence of messages L → Fil → Fi → O. A.2.3
Feature-based attention.
During an object search task, the exact opposite sequence of messages is initiated. (1) Priors on the object are changed based on the task so as to be concentrated on the target of interest (e.g., cars vs. pedestrians). Spatial priors can still be imposed (based on the gist of the scene) independently of the object priors. (2) The change in object prior is propagated to the feature units, through the message O → Fi . This results in a selective enhancement of the features that are present in the target object and suppression of others. This preference propagates to all featuremap locations through message Fi → Fil . (3) The L unit pools across all features Fjl for j = 1 . . . n at a specific location l. However, because of the feature-based modulation, locations that have features associated with the object are selectively enhanced. Thus, priors of the objects in the ventral stream generate an attentional spotlight in the parietal cortex that corresponds to locations most likely to contain the object of interest. The message passing is thus initiated in the ventral stream first and is manifested in the parietal cortex (L units) only after a delay, in agreement with the recent data by Buschman & Miller [2]. In summary, feature based attention results in a sequence of messages O → Fi → Fil → L. A.2.4
Feature pop-out
Since of Fli are mutually exclusive P the states i i (∀i, F i P (Fl |F , L) = 1), increasing the activity at l one location (through mI→Fli ), has the effect of effect of inhibiting the likelihood of the stimuli being present at other locations. This reproduces the well known effect of lateral inhibition observed in real neurons [3]. Further, these changes are propagated to the location unit via the messages mFli →L . As a result, feature dimensions that have fewer active stimuli induce a higher likelihood
for individual locations (through mFli →L ) than feature dimensions with more active stimuli. This results in a feature ’pop-out’ effect, where the saliency map is biased towards locations of ’surprising’ stimuli. A.2.5
Object recognition under clutter
During a visual search for a specific feature or object, the top-down feature-based attention is first used to bias the locations that share the features with the target. The sequence of messages are identical with feature-based attention (O → Fi → Fil → L). The saliency map (P (L|I)), provides the most likely location containing the target. The search now proceeds with the deployment of the spotlight of attention by LIP around the most silent image region by silencing unattended regions. The direct effect of this spatial attention is a shrinking of the receptive fields in the ventral stream around the attended region. The sequence of messages are identical with that of spatial attention (L → Fil → Fi → O). Thus object recognition under clutter involves the sequential application of feature-based attention and spatial attention. To locate subsequent objects, the attentional spotlight is then shifted (possibly via the PFC and/or FEF onto LIP) to the next location [20].
Model unit L
Brain area LIP/FEF
O
PFC
Fi
IT
Fli
V4
I
V2
Representation/Model This variable encodes the location and scale of the target object. It is modeled as a discrete multinomial variable with |L| distinct values. This variable encodes the identity of the object. It is modeled as a discrete multinomial variable that can take |O| distinct values. Each feature variable F i encodes the presence of a simple shape feature. Each such unit is modeled as a discrete binary variable that can be either on or off. It is to be noted that presence or absence is indicated in a position/scale invariant manner. In practice 10 ∼ 100 such features are used. This variable can be thought of as a feature map that encodes the joint occurrence of the feature (F i ) at location L = l. It is modeled as a discrete multinomial variable with |L|+1 distinct values (0, 1 · · · L). Values (1 · · · L) correspond to valid locations. Value Fli = 0 indicates that the feature is completely absent from the input. This is the feed-forward evidence obtained from the lower areas of ventral stream model. Table 4: Bayesian model units and tentative mapping to brain areas.
Conditional Probability P (L)
P (F i |O) P (Fli |F i , L)
P (I|Fli )
Modeling Each scene or view-point places constraints on the location and sizes of objects that can be encountered in the image. Such constraints can be specified explicitly (e.g. during spatial attention) or learned using a set of training examples [30]. The probability of each feature being present or absent given the object and is directly learned from the training data. When the feature F i is present and location L = l∗ is active, the Fli units that are nearby unit L = l∗ are most likely to be activated. When the feature F i is absent, only the Fli = 0 location in the feature map is activated. This conditional probability can be captured succinctly by the following table F i = 1, L = l F i = 0, L = l i i i Fl = 0 P (Fl |F , L) = δ1 P (Fli |F i , L) = 1 − δ2 δ1 and δ2 are small i i i Fl 6= 0 P (Fl |F , L) ∼ Gaussian P (Fli |F i , L) = δ2 centered around L = l P values. They are chosen to ensure that P (Fli |F i , L) = 1. For each location within the feature map, P (I|Fli ) provides the likelihood that Fli is active. In the model, this bottom-up evidence or likelihood is set proportional to the activations of the shape-based units (see [28]). Table 5: Conditional probabilities.