Pelman et al.
Interactive Mapping for Rapid Evacuation Planning
An Interactive Mapping Application for Rapid Evacuation Planning Kenneth S. Pelman GeoVISTA Center Department of Geography Pennsylvania State University
[email protected]
Anthony C. Robinson GeoVISTA Center Department of Geography Pennsylvania State University
[email protected]
ABSTRACT
Current GIS solutions for evacuation planning are frequently based on expensive and difficult to use commercial software solutions. These tools require a GIS analyst to generate and interpret results for decision makers. This paper introduces a web-based interactive mapping tool called EvacSpace that can provide emergency managers with actionable spatial information to develop plans for potential citizen evacuations in common emergency situations. Easy-to-use web mapping software and services are blended together with cloud computing methods to support interactive, visually-enabled evacuation planning and scenario evaluation. Here we show our current progress through a case study application to characterize the usefulness and utility of EvacSpace for the rapid, interactive development and assessment of evacuation plans. Keywords
Interactive mapping, evacuation, planning, mashups. INTRODUCTION
Geographic Information Systems (GIS) have become integral tools for disaster management, and are currently utilized in all four phases of a disaster: mitigation, preparedness, response, and recovery (Cutter, 2003). Arguably, the most visible use of GIS has been in the response and recovery phases, in such disasters as the Haiti Earthquake. However, GIS applications in the mitigation and preparedness phases may prove to be more cost-effective for saving both lives and property. One example of how the mitigation and preparedness stages have been actively addressed is in the area of evacuation planning, or evacuation vulnerability mapping. Recent research on evacuation planning for hurricanes (Pal, Graettinger, and Triche, 2003), flooding (Mioc, Anton, and Liang, 2008), earthquakes (Naghdi, Mansourian, Valadanzoej, and Saadatseresht, 2008), and wildfires (Cova, Dennison, and Kim, 2005) has increased our understanding of what needs to be done in an actual disaster. However, these studies have used either commercial software or custom solutions that are not widely available or accessible by non-expert users (de Silva and Eglese, 2000; Andrienko, Andrienko, and Bartling, 2008). These solutions are powerful because they incorporate road networks and offer sophisticated modeling capabilities, such as shortest distance, shortest time, and re-routing based upon a road blockage. However, development costs and the need for substantial training in order for users to effectively apply custom applications remain significant shortfalls in current progress toward efficient and effective map-oriented evacuation planning tools. The primary aim of our current research is to develop an interactive mapping tool called EvacSpace that enables rapid map-oriented evacuation planning. Our intention is to support non-expert users who need to quickly assemble evacuation plans to identify the number of impacted persons, possible routes to evacuation shelters, and the time it will take for evacuees to reach evacuation shelters. Many current tools support detailed evacuation planning and scenario generation in complex desktop systems, but to our knowledge very little has been done to create interactive, web-based evacuation planning tools that are easy enough for non-expert users (part time or volunteer emergency managers in smaller communities, for example) to apply in the midst of a real Reviewing Statement:
This short paper has been fully double-blind peer reviewed for clarity, relevance and
significance. Proceedings of the 8th International ISCRAM Conference – Lisbon, Portugal, May 2011
1
Pelman et al.
Interactive Mapping for Rapid Evacuation Planning
emergency situation where time is critical and resources are constrained. In contrast, there are several good examples of user-friendly, map-oriented emergency management tools for situational awareness, such as Ushahidi (ushahidi.com) and Sahana (sahanafoundation.org). The following sections outline the design of EvacSpace, our efforts to incorporate users into the design and development process, a case study example highlighting our current progress on developing EvacSpace, and conclusions covering the significance and limitations of our work and future research opportunities. TECHNICAL DESIGN AND USER WORKFLOW
One promising technological avenue for the development of new map-oriented evacuation planning tools is the geospatial mashup. A geospatial mashup is a web application that provides a base map and simple map interaction controls and tools to support the overlay of external spatial data sources through the use of a dedicated Application Programming Interface (API). Geospatial mashups have received recent attention as tools that can be used and designed for disaster mitigation and response (Liu and Palen, 2010). Gupta and Knoblock (2010), for example, develop a complex interactive GUI that serves as the conduit between the user and the map API in order to access data of various formats. Xin and Hu (2008) use geospatial mashups for livestock evacuations in the state of Florida in a toolkit that employs pre-defined evacuation centers and straight-line distance evacuation algorithms. A variety of web mapping resources can be used as the basis to design new mashup tools. One of the most popular resources is the Google Maps API (www.code.google.com/apis/maps). Google has made their maps, geocoding features, and routing tools available to the general public through this API. The Google Maps API offers developers the opportunity to produce custom applications using Google cloud computing technology. Cloud computing refers to the ability to purchase server time and storage on an as-needed basis (Hayes, 2008). Google APIs are request-reply based, limiting the amount of CPU time per request. The most recent version of the Google Maps API also allows developers to store spatial data in the cloud. Many in the GIS domain have already begun producing mashups that take advantage of cloud-based processing (Tanasescu, Gugliotta, Domingue, Davies, Gutierrez-Villarias, Rowlatt, Richardson, and Stincic, 2006) and cloud computing has emerged as a new research area in GIScience. To develop EvacSpace, we are using Javascript to interact with Google APIs to generate our functionality. Google has developed a Javascript API for Maps, Charts, and Directions, which allows us to make user-defined calls to the functions that produce the markers, polygons, and route lines that are needed for our display. We have designed EvacSpace to support a simple, common workflow that was identified through informal interviews with several emergency management experts at federal and local emergency management agencies. The basic EvacSpace workflow begins by specifying an area to evacuate by using the mouse to click and create a polygon with as many vertices as desired. Next, the user is asked to specify the locations and capacities of available evacuation shelters. This is done by clicking on the map and entering capacity details for each shelter. When a shelter is added, an interactive bar graph shows the number of people that can be housed in shelters as a percentage of the total number of people in the evacuation area. After shelters have been designated, users can choose the factor by which overall evacuation times are reduced to simulate the flow of evacuees (indicated as a percentage). To support this workflow, EvacSpace does the following operations on the client and server-sides:
Define Evacuation Area and Estimate Population: Users generate a polygon by clicking to add vertices on the map and a Google Maps marker is created at these locations. Each of these markers is saved in a Javascript array. When the user has finished adding vertices, they can click a button to complete the evacuation polygon. An interactive pie chart is also created using the Google Charts API to show the total number of people in the evacuation area based on gridded LandScan population data (Bhaduri, Bright, Coleman, and Dobson, 2002).
Define Evacuation Shelters: Evacuation centers are chosen by the user in the same way as the evacuation polygon was defined through the creation of new markers. After the user clicks on the location of a shelter, query boxes open to specify the name and capacity of the shelter. Once this number is entered, the interactive bar graph updates to show the total number of people in the evacuation area, and how many of those people are served by existing shelters.
Identify Routes and Calculate Evacuation Times: Routes are generated and displayed from each LandScan grid point (approximately every 1 km) to the shelters using the Google Directions API. Starting and ending addresses, distance, and time for each route can be displayed. The total time to evacuate is calculated and displayed for two evacuation scenarios; if everyone in the area leaves at once, and if each
Proceedings of the 8th International ISCRAM Conference – Lisbon, Portugal, May 2011
2
Pelman et al.
Interactive Mapping for Rapid Evacuation Planning
grid cell group from the LandScan data evacuates one at a time. Total evacuation times incorporate the user-determined percentage delay factor intended to simulate the slower than normal speeds that are typically associated with evacuees. CASE STUDY APPLICATION
To demonstrate our progress toward a fully-functional EvacSpace tool, here we present a case study application of the current prototype. This example focuses on evaluating an evacuation scenario for a suburban community in the Washington, D.C. area in the United States. In the last several years, the Washington area has experienced numerous natural hazards, from major blizzards, severe wind storms, flooding, and even a minor earthquake. In addition, the DC area contains many important historical locations, government assets, and has been a target in the past for man-made emergencies like terrorist attacks.
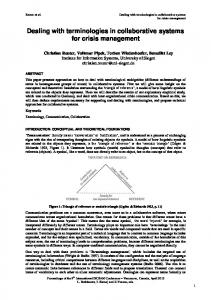
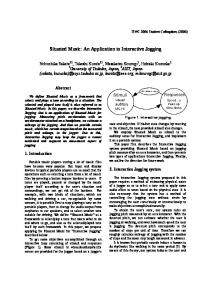
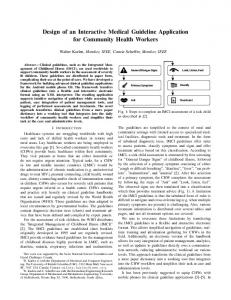
Figure 1: The current EvacSpace prototype allows users to create an evacuation area, specify shelter locations, and identify possible routes to those shelter locations along with estimated driving times.
EvacSpace lets the user begin evacuation planning by clicking on the map to create a polygon. In this case study, we assume that the area around FedEx field to the east of downtown DC must be evacuated due to a chemical spill. Field reports suggest that the spill may impact residents in a 1-mile radius from the stadium. To select this area, the user can click to create a polygon that encapsulates this area (Figure 1 – top left).
Proceedings of the 8th International ISCRAM Conference – Lisbon, Portugal, May 2011
3
Pelman et al.
Interactive Mapping for Rapid Evacuation Planning
Next, the user specifies which shelters are available for evacuation by clicking on the map to add a new shelter and typing in a name and a value for how many people they can each hold. During this process, each time a shelter is added, the interface updates to show how many people remaining must be accounted for in order to evacuate the population identified inside the polygon based on the LandScan population dataset (Figure 1 – top right). Once shelter locations have been identified (in this case, a shelter in Greenbelt Park and another at Andrews Air Force Base), the user is provided with the option to include a percentage factor by which the total evacuation time is delayed, as well as the option to choose how the routes are calculated (favoring shortest time or shortest distance). Finally, the user can submit these settings to calculate evacuation routes, present those routes on the map, and list route details in a separate window. The user can show routes to each shelter by selecting checkboxes. Figure 1 – middle shows routes from each LandScan grid cell that were allocated to the Greenbelt shelter, and Figure 1 – bottom shows routes from each grid cell that were allocated to the Andrews Air Force Base shelter, along with details from one of the specific routes (details appear in a pop-up window each time a user clicks on a departure point in the evacuation area polygon). USER-CENTERED DESIGN AND EVALUATION
Technical solutions for developing interactive and highly flexible mapping applications are now quite mature, but to design the key functions and interface controls a user-centered design and evaluation process must be employed for the duration of application design and development to ensure the tool is useful and usable (Haklay, 2010). As mentioned above, the first phase of our user-centered design activities with EvacSpace was to solicit input from several emergency management stakeholders to help develop the workflow that we used to provide structure for EvacSpace. These individuals were asked open-ended questions designed to elicit the processes they complete when conducting evacuation planning tasks. Based on the workflow we derived from this activity, a rapid prototype development (Whitten and Bentley, 2007) method was adopted to begin coding a functional prototype. Currently we have completed the first functional prototype, and we plan to evaluate this prototype with local and federal emergency managers. Our approach for this evaluation phase will be to have emergency managers complete several rapid evacuation plans for at least three different types of disaster scenarios in multiple geographic locations. We will ask these participants to complete similar tasks using offthe-shelf network analysis tools provided in ArcGIS desktop GIS software (a common off-the-shelf solution for analyzing spatial networks). To compare both approaches, we will ask users to rate the usability and utility of both methods using modified versions of common usability heuristics developed by Nielsen (1993). Our modifications of both scales will focus on how each tool supports or does not support tasks associated with evacuation planning and understanding the results from evacuation planning tools. Responses to these metrics can then be tabulated to directly compare EvacSpace to ArcGIS Network Analyst. In addition to a comparative usability study, we intend to conduct task analysis studies with other emergency manager user groups to identify additional features to add to these tools (or which features should be removed) and to better understand how a diverse range of managers (from small to large response organizations) make use (or may make use in the future) of planning tools like EvacSpace in decision making situations. CONCLUSIONS AND FUTURE RESEARCH
In this paper we have presented our progress toward the development of EvacSpace, which is a simple, visuallyenabled tool for rapid development and evaluation of vehicle evacuation plans. EvacSpace uses a customized mashup framework to provide a map-oriented approach for evacuation planning. We believe that our progress begins to fill a pressing need for lightweight tools like EvacSpace that provide quick answers for basic questions that arise during an emergency situation where an evacuation may become necessary. Current approaches rely on sophisticated (but quite accurate and detailed) tools that are expensive and must be applied by a subjectmatter expert. EvacSpace provides a web-based, interactive approach that would be reasonable for a non-expert to apply with minimal training. While the results provided by EvacSpace rely on traffic routing algorithms that are no doubt less accurate than those provided by advanced planning tools, users have the ability to quickly modify the evacuation time by a percentage delay factor to identify the possible range of evacuation times, and then they can modify routes based on visual inspection of LandScan population data. EvacSpace provides at minimum a “best case scenario” for how long evacuations might take, which is more useful in an emergency than to have no estimate at all. In future iterations a key goal for us is to connect more sophisticated computational methods for simulating the time it takes for an evacuation to occur so that users can choose between multiple options for calculating the
Proceedings of the 8th International ISCRAM Conference – Lisbon, Portugal, May 2011
4
Pelman et al.
Interactive Mapping for Rapid Evacuation Planning
total evacuation time. This will also allow us to directly compare the results generated by the Google Directions API to those generated by more sophisticated evacuation-specific route-time estimation methods. We also anticipate that EvacSpace will have the capability to do heads-up modification of a polygon imported from a KML file, allowing for the flexible, adaptable analysis of scenarios in real-time, such as damage to a levee that has increased the area of flooding predicted by SLOSH model results (Jelesnianski, Chen, and Shaffer, 1992). A wide range of potential additional datasets may be brought to bear in future iterations of EvacSpace. Importing additional population information from Census datasets would allow us to estimate the demographic profile of an evacuation area, and this information can in turn be used to help shape evacuation routing time results. We will also look for opportunities to import road network data from other sources, such as OpenStreetMap, to support the use of EvacSpace in areas beyond where Google Maps has road coverage. Finally, as mentioned above, we have developed a plan for carefully evaluating EvacSpace with representative end-users. To meet our goal of developing a useful, map-oriented rapid evacuation planning tool, we must make sure that EvacSpace satisfies the basic needs of our target user population of emergency managers. REFERENCES
1.
Andrienko, G., Andrienko, N. and Bartling, U. (2008) Interactive visual interfaces for evacuation planning, in: The working conference on Advanced Visual Interfaces, Napoli, Italy, pp. 472-473.
2.
Bhaduri, B., Bright, E., Coleman, P. and Dobson, J. (2002) LandScan: Locating people is what matters, Geoinformatics, 5, 34-37.
3.
Cova, T.J., Dennison, P.E. and Kim, T.H. (2005) Setting wildfire evacuation trigger points using fire spread modeling and GIS, Transactions in GIS, 9, 603-617.
4.
Cutter, S.L. (2003) GI Science, Disasters, and Emergency Management Transactions in GIS, 7, 439-446.
5.
de Silva, F.N. and Eglese, R.W. (2000) Integrating simulation modeling and GIS: spatial decision support systems for evacuation planning, The Journal of the Operational Research Society, 51, 423-430.
6.
Gupta, S. and Knoblock, C. (2010) Building geospatial mashups to visualize information for crisis management, in: 7th International conference on Information Systems for Crisis Response and Management, Seattle, WA.
7.
Haklay, M. (2010) Interacting with geospatial technologies, in, John Wiley & Sons, Chichester, United Kingdom, pp. 310.
8.
Hayes, B. (2008) Cloud computing, Communications of the ACM, 51, 9-10.
9.
Jelesnianski, C.P., Chen, J. and Shaffer, W.H. (1992) SLOSH: Sea, lake and overland surges from hurricanes, in: NOAA Technical Report Miami, FL, pp. 71.
10. Nielsen, J. (1993) Usability Engineering, Academic Press, Inc., Boston, Massachusetts. 11. Liu, S.B. and Palen, L. (2010) The new cartographers: crisis map mashups and the emergence of neogeographic practice, Cartography and Geographic Information Science. 37(1): pp. 69-90. 12. Mioc, D., Anton, F. and Liang, G. (2008) On-line street network analysis for flood evacuation planning, in: S. Nayak, S. Zlatanova (Eds.) Remote sensing and GIS technologies for monitoring and prediction of disasters, Springer-Verlag, Berlin, Germany, pp. 219-242. 13. Naghdi, K., Mansourian, A., Valadanzoej, M.J. and Saadatseresht, M. (2008) Evacuation planning in earthquake disasters, using RS & GIS, in: International Society for Photogrammetry and Remote Sensing Congress, Beijing, China, pp. 1671-1676. 14. Pal, A., Graettinger, A.J. and Triche, M.H. (2003) Emergency evacuation modeling based on geographical information system data, in: 82nd annual meeting of the Transportation Research Board, Washington, DC. 15. Tanasescu, V., Gugliotta, A., Domingue, J., Davies, R., Gutierrez-Villarias, L., Rowlatt, M., Richardson, M. and Stincic, S. (2006) A semantic web services GIS based emergency management application, Lecture Notes in Computer Science, 4273/2006 959-966. 16. Whitten, J.L. and Bentley, L.D. (2007) Systems analysis and design methods, 7th ed., McGraw-Hill/Irwin, New York. 17. Xin, J and, Hu, P. (2008) Managing agricultural emergency resources through information mashups, Journal of Information Technology in Agriculture, 3, 37-45.
Proceedings of the 8th International ISCRAM Conference – Lisbon, Portugal, May 2011
5