Tutorials!in!Quantitative!Methods!for!Psychology! 2007,!Vol.3!(2),!p.!63"69.!
!"#$%&t("#)"*!&t(t)&t)+(,!-./$%!0&)"*!"."+$"t%(,!-%.1(1),)t2! #)&t%)10t)."&3!45)"&60(%$#7!8"&60(%$#7!("#!9:;1(&t)$"!?>,)$! Rensselaer!Polytechnic!Institute! !
This! paper! presents!a! graphical! way! of! interpreting! effect! sizes!when! more! than! two! groups!are!involved!in!a!statistical!analysis.!This!method!uses!noncentral!distributions! to! specify! the! alternative! hypothesis,! and! the! statistical! power! can! thus! be! directly! computed.! This! principle! is! illustrated! using! the! chi"squared! distribution! and! the! F! distribution.! Examples! of! chi"squared! and! ANOVA! statistical! tests! are! provided! to! further!illustrate!the!point.!It!is!concluded!that!power!analyses!are!an!essential!part!of! statistical! analysis,! and! that! using! noncentral! distributions! provides! an! argument! in! favour!of!using!a!factorial!ANOVA!over!multiple!t!tests.! ! ! !
Statistics!occupy!a!large!portion!of!psychological!papers.! While! this! increase! in! the! space! allowed! to! describe! the! analyses! used! in! psychological! experiments! allows! for! a! more! thorough! understanding! of! the! data,! it! was! not! accompanied! by! a! corresponding! boost! in! the! formation! of! psychologists! (Giguère,! Hélie,! &! Cousineau,! 2004).! In! particular,! a! substantial! amount! of! class! time! is! usually! devoted! to! the! explanation! of! type! I! error! (wrongfully! rejecting!the!null!hypothesis),!but!type!II!error!is!usually!not! worth! more! than! a! mere! mention! in! undergraduate! classes! (failing! to! reject! the! null! hypothesis! when! it! is! false).! This! latter! type! of! error! is! very! important,! because! it! complements! the! notion! of! statistical! power.! Statistical! power,! also! referred! to! as! sensitivity,! is! the! probability! of! !!!!!!!!!!!!!!!!!!!!!!!!!!!!!!!!!!!!!!!! !!!!!!!!!!!!!!!!!!!!!!!!! ! ! This! research! was! supported! by! a! postdoctoral! fellowship!from!Le!fonds!québecois!de!la!recherche!sur!la!nature! et! les! technologies.! The! author! would! like! to! thank! Dr.! Jean! Descôteaux! and! an! anonymous! reviewer! for! their! useful! comments! on! a! previous! version! of! this! manuscript.! Requests! for! reprints! should! be! addressed! to! Sébastien! Hélie,! Rensselaer! Polytechnic! Institute,! Cognitive! Science! Department,! 110! Eighth! Street,! Carnegie! 108,! Troy! (NY),! 12180"3590!(USA)!,!or!using!e"
[email protected]!
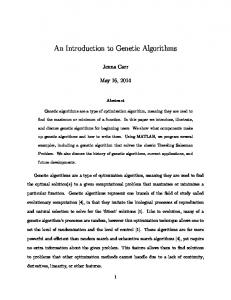
correctly! rejecting! the! null! hypothesis.! Figure! 1! illustrates! statistical!power!in!the!case!of!a!chi"squared!distribution.!As! in! all! statistical! tests,! the! aim! is! to! choose! which! of! two! hypotheses! (distributions)! is! correct.! When! the! test! statistic! is! higher! than! a! predefined! threshold! f("),! the! alternative! hypothesis! is! chosen! (full! line);! otherwise,! the! null! hypothesis!is!chosen!(dashed!line).!Because!statistical!power! is! the! probability! to! correctly! choose! the! alternative! hypothesis,! it! is! illustrated! by! the! portion! of! the! former! distribution!to!the!right!of!the!threshold!(gray!part).! Statistical! power! is! a! function! of! three! parameters:! the! probability! of! committing! type! I! error,! the! reliability! of! the! sample,! and! the! effect! size! (Cohen,! 1988).! The! first! parameter,!probability!of!type!I!error,!is!positively!related!to! statistical! power:! when! the! probability! of! wrongfully! rejecting!the!null!hypothesis!is!increased,!statistical!power!is! also!increased.!This!can!be!easily!seen!in!Figure!1:!when!the! probability! of! type! I! error! is! increased! (by! moving! the! threshold!to!the!left),!the!area!of!the!grey!portion!is!bigger.! Likewise,!the!statistical!power!can!be!decreased!by!moving! the! threshold! to! the! right! (diminishing! the! probability! of! type!I!error).!! Sample!reliability!is!usually!controlled!in!psychology!by! randomly! selecting! participants.! Hence,! by! the! law! of! large! numbers,! bigger! samples! are! more! reliable! than! smaller! ones.! Operationally,! the! reliability! of! a! sample! is! usually!
! !
63!
! !
!
ANOVAs)! or! entire! distributions! (e.g.,! chi"squared,! G" squared).!For!instance,!the!null!hypothesis!when!performing! an!ANOVA!is!that!the!variance!of!the!groups’!mean!is!zero.! Likewise,! the! null! hypothesis! when! performing! a! chi" squared! or! G"squared! test! is! that! the! variance! of! the! proportions!is!zero.!In!both!cases,!this!can!only!be!achieved! if!all!the!means!or!all!the!proportions!are!the!same,!and!the! effect!size!can!be!best!understood!using!the!noncentral!chi" squared! (chi"squared,! G"squared)! or! noncentral! F! distributions! (ANOVA).! These! two! cases! are! now! illustrated.!
! Figure! 1.! Chi"squared! and! noncentral! chi"squared! distributions.!The!former!represents!the!null!hypothesis!and is! illustrated! using! the! dashed! line! (#! =! 5),! while! the! latter represents!the!alternative!hypothesis!and!is!illustrated!using the! full! line! (#! =! 5,! $! =! 5).! The! grey! portion! represents statistical!power.!
45)"&60(%$#7!8"&60(%$#7!! ("#!t5$!"."+$"t%(,!+5)"&60(%$#!#)&t%)10t)."! As!argued!earlier!and!shown!in!Figure!1,!hypotheses!in! statistical! tests! are! usually! represented! using! distributions:! the! test! statistics! measures! how! much! they! differ.! When! performing! statistical! tests! using! the! chi"squared! distribution,! the! alternative! hypothesis! is! not! usually! represented;! only! the! null! hypothesis! is! (the! usual! chi" squared! distribution),! and! the! threshold! found! in! a! statistical! table! is! used! to! either! accept! or! reject! the! null! hypothesis.! However,! when! performing! a! power! analysis,! the!alternative!hypothesis!has!to!be!specified.!In!the!case!of! the! chi"squared! and! the! G"squared! statistical! tests,! the! alternative! hypothesis! is! a! noncentral! chi"squared! distribution! (as! shown! in! Figure! 1).! This! distribution! is! described!by:!
measured!using!the!standard!error!of!the!sample!mean:! !
SEX "
s2 ! n
64!
(1)!
where! s2! is! the! unbiased! estimate! of! the! population’s! variance,!and!n!is!the!sample!size.!It!is!easy!to!see!that!Eq.!1! diminishes! when! the! sample! size! is! increased.! Because! test! statistics! are! usually! scaled! using! standard! errors,! decreasing!this!measure!increases!the!test!statistics,!and!thus! the!statistical!power!of!the!test.! The! last! parameter! that! affects! statistical! power! is! effect! size,!which!directly!refers!to!the!proportion!of!the!change!in! the! dependant! variable! that! can! be! attributed! to! the! controlled!factor.!While!this!parameter!is!easy!to!interpret!in! the!context!of!tests!that!compare!two!means!(e.g.,!the!scaled! difference!between!the!means!in!a!t!test),!it!is!more!difficult! to!understand!in!cases!involving!more!than!two!groups!(e.g.,!
p( x | 0 , 1 ) " !
e
'
( x (1 ) 2
0
x2
'1
0
2
2
#1x $k
&
% k "0
0+ . 2 2 k k! /, k ( ) ! 2* -
(2)!
with! #! >! 0! degrees! of! freedom,! $! #! 0! is! the! noncentrality! & parameter,! and! / # x $ " 20 t x '1e 't dt ! is! the! Gamma! function.! When!$!=!0,!Eq.!2!can!be!simplified!to:! p( x |0 ,0) " p( x |0 ) 0
!!!!!!!!!!!!!!!! "
'1 '
x2 e
x 2
0
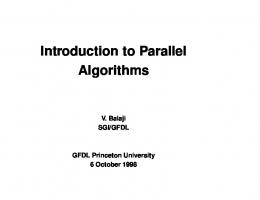
0 (3)! / ., +) 2 2 ! -2* which! is! the! usual! chi"squared! distribution! with! #! >! 0! degrees! of! freedom.! The! smaller! the! value! given! to! $,! the! bigger! the! overlap! between! the! null! and! alternative! hypotheses.!On!the!other!hand,!the!bigger!the!value!given!to! $! ,! the! smaller! the! overlap! and,! as! a! result,! the! higher! the! statistical! power.! Figure! 2! illustrates! several! examples! of! noncentral!chi"squared!distributions.! Because! the! alternative! hypothesis! necessarily! has! the! same!number!of!degrees!of!freedom!as!the!null!hypothesis,!
!
Figure! 2.! Noncentral! chi"squared! distributions! ($ =! 5)! with! varying! %s.! The! filled! distribution! represents! a! null hypothesis.! As! %! increases,! the! overlap! of! the! alternative hypotheses! with! the! null! hypothesis! (grey! region) diminishes.!!
!
! ! 65! ! C5$!9:;