Schjønning, P., Lamandé, M., Lassen, P. 2015. An introduction to Terranimo® (www.terranimo.dk). Unpublished note, Aarhus University, Dept. Agroecology
An introduction to Terranimo® August 2015
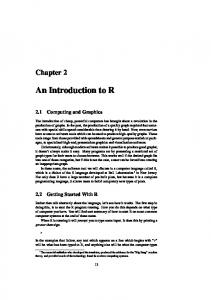
1. How to use this note Sections 2-5 give some general information about the Terranimo® decision support tool. Sections 610 (+ 14) provide a short introduction to the use of the tool. And finally, sections 11-14 give some explanation of the calculations taking place when using Terranimo®. 2. What is Terranimo® and what does it do? Terranimo® (Terramechanical model) is a computer model that predicts the risk of soil compaction by farm machinery. The model estimates the risk of compaction for realistic operating conditions. It is designed to include the most recent knowledge on soil strength and stress from machinery. These stress and strength aspects are interacting in a complicated way. The results may thus be valuable for understanding the dynamics when arable soil is loaded with machinery. The knowledge gained may help identify the most beneficial traffic systems for sustainable farming. Terranimo® is continuously updated with the most recent results in soil compaction research. The tool is thus considered of interest for researchers and extension officers interacting with farmers. However, the simple design with default or easily modified machinery and soil conditions makes the tool useful also for farmers interested in reducing compaction of their soils. Terranimo® may help identify the ‘weakest points’ in some specific management system. The potential benefit of taking into use wider, low pressure tyres or machinery with more axles etc can be quantified. Also, the effect of soil moisture conditions on soil vulnerability to compaction can easily be displayed and may be an eye-opener to a better management of the fields. Terranimo® can be used free of charge. The creators of Terranimo® have no responsibility for potential unforeseen harm that might be caused through the use of Terranimo®. 3. The development of Terranimo® Outcomes from projects funded by the Danish Ministry of Food, Fisheries and Agriculture included a relatively simple simulation model, “Jordværn online” (English: “SoilGuard online”), for soil stress distribution in the tyre-soil contact area (Schjønning et al., 2006). This tool took use of the mathematical model complex for describing the stress distribution along and across the driving direction suggested by Keller (2005). A modified version of the Keller model labelled ‘FRIDA’ – as later described by Schjønning et al. (2008) – was implemented in “Jordværn online”. The model was parameterized by the FRIDA parameter prediction equations provided by Schjønning et al (2006). Later, Thomas Keller from the ART Agricultural Research Station in Reckenholz and Matthias Stettler from the School of Agricultural, Forest and Food Sciences HAFL joined forces with Per Schjønning, Mathieu Lamandé, Poul Lassen and Margit S. Jørgensen from the Department of Agroecology at Aarhus University, Research Centre Foulum to create a decision support tool also including the mechanical strength of the soil. This model was called Terranimo® as described above.
1
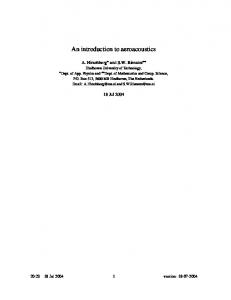
Schjønning, P., Lamandé, M., Lassen, P. 2015. An introduction to Terranimo® (www.terranimo.dk). Unpublished note, Aarhus University, Dept. Agroecology Terranimo® is thus the work of an international team. In 2009-2012 the model development took place in a context of the ICT-AGRI funded project “PredICTor”. In addition to the abovementioned group, the PredICTor project included Laura Alakukku from Helsinki University, Finland, and Harri Lilja from MTT Agrifood Research Finland. Also, Jan van den Akker, The Netherlands, Jan Rücknagel, Germany, and Henrik Breuning-Madsen and Jørgen Pedersen from Denmark were associated to the PredICTor project. 4. Terranimo® International and other versions of the model Terranimo® International is the common label for a range of national versions, including Terranimo® Global. All versions can be run in nine languages based on user’s choice: English, German, French, Dutch, Dutch (Flemish), Norwegian, Swedish, Finnish or Danish. For the time being, five national versions are available: Denmark, Norway, Finland, Switzerland and BelgiumFlanders. Model calculations are identical for all versions. They only deviate with respect to the default soil types, soil moisture conditions, and list of machinery that the user is met with when opening the specific version. In addition, Terranimo® Global offers a number of typical FAO soil types. Terranimo® International can be accessed through the web portal www.terranimo.dk. Technical aspects of the Terranimo® International model is described by Lassen et al. (2013). The Swiss part of the Terranimo® founding group (Matthias Stettler and Thomas Keller) also has created a specific Terranimo® version for official regulation of field traffic by the Swiss authorities. This version deviates from Terranimo® International in miscellaneous ways. 5. The basic characteristics of Terranimo® Terranimo® basically compares vertical stresses from wheels with soil strength. Decision support on the sustainability of intended field traffic is provided based on the comparison of stress and strength, which is done for all the soil profile (to 150 cm depth). Generally, stresses should not exceed soil strength. The present version of Terranimo® does not provide a quantitative estimate of soil deformation taking place when stress exceeds strength. Neither does the model estimate compaction effects on soil functions (including crop yields). The strength of the tool is thus primarily the possibility to assess, whether stresses exceeds the soil mechanical strength – hence likely inducing plastic/permanent deformation of the soil – for a specific traffic event. 6. General aspects of the user interface When starting Terranimo®, the user is met with a screen showing pre-selected machinery, which is a tractor-trailer combination for slurry application (Figure 1). It is possible to do simulations without logging in as a user. However, in case data entered should be re-used after closing down Terranimo®, the user should login by clicking the ‘Login’ tab (Figure 1). By contacting Poul Lassen (
[email protected]), you will be provided a password (no info on user identity will be asked for, and the use of Terranimo® is still free of charge). Terranimo® includes four tabs,- two for inputs (machinery and soil) and two for outputs (stresses in the tyre-soil interface and stresses transmitted to the soil profile)(Figure 1). Terranimo® by default is set up with a version-specific soil type. The default moisture condition is field capacity, corresponding to a matric potential of -100 hPa (pF2). The model also provides default machinery when opening the tool. The user may thus go directly to the output tabs and see the results of the
2
Schjønning, P., Lamandé, M., Lassen, P. 2015. An introduction to Terranimo® (www.terranimo.dk). Unpublished note, Aarhus University, Dept. Agroecology pre-defined combinations of machinery and soil conditions. Afterwards or alternatively as a first step, the user may select other machines or change tyres on the machine axles. The wheel loads and tyre inflation pressures may be changed as well. Also, alternative soil types and moisture conditions can be chosen by selecting the ‘Describe site’ tab. The user then typically (re-)opens the results tabs for evaluation of the effects of the modifications.
Report facility Input tabs
Login option Output tabs
Figure 1. The opening window when starting up Terranimo®. The report facility is described in section 14.
7. Input: Select machine The ‘Select machine’ tab provides a list of machinery that can be selected (Figure 1). Differently sized tractors can be merged with miscellaneous implements (slurry trailers, potato and beet harvesters, big baler etc). Terranimo® automatically takes care of the load transfer from trailers to the tractor axles. Alternatively, self-propelled machines like combine, beet harvester, forage harvester, pesticide sprayer and slurry spreader may be chosen.
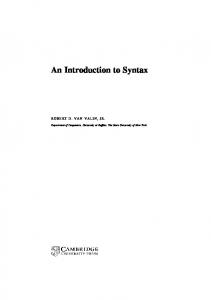
Figure 2. Tyre type, wheel load and tyre inflation pressure is shown for wheels on the machinery if placing the cursor on top of the tyre icons (left). If clicking the icons, a menu opens, enabling change of tyre and modifications in wheel load and inflation pressure for the selected tyre (right).
3
Schjønning, P., Lamandé, M., Lassen, P. 2015. An introduction to Terranimo® (www.terranimo.dk). Unpublished note, Aarhus University, Dept. Agroecology Pop-up boxes with info on tyre type, wheel load and inflation pressure appears when holding the cursor above the tyre icons (Figure 2, left). By clicking the tyre icon, a sub-menu allows for changing tyres, and for modifying wheel loads and inflation pressures (Figure 2, right). Clicking the ‘Results: Soil stress for standard soil’ button on the menu in Figure 2 (right) opens up graphics showing the periphery of the tyre soil contact area, the stress distribution in the contact area, and the stress distribution in the soil profile if the specific tyre in question would traffic a sandy soil at a water content of field capacity (in a Terranimo® context, the ‘standard’ soil)(Figure 3). Thus, please note that this facility is unaffected by the selection of soil texture and water conditions in the ‘Describe site’ tab (as explained below).
Figure 3. A special facility allows for studying the performance of a selected tyre at the selected wheel load and inflation pressure. Importantly, this specific graphics relate to ‘standard’ soil conditions, which in Terranimo ® is defined as a sandy soil at field capacity water conditions.
8. Input: Describe site The ‘Describe site’ tab allows for choosing soil type and soil moisture conditions. The left-hand part entitled ‘Soil texture’ presents the default soil type for the given version (country) in question. The textural composition of that soil is listed,- based on users choice either for all 15 layers of 10 cm increment or only for each horizon with identical texture (Figure 4). A drop-down menu ‘Select soil type’ allows for choosing among a range of soils typical for the specific country. The user may also manually type in the textural composition of his/her own soil (‘Manual texture’, Figure 4). The ‘Texture from soil database’ is an option until further only active for Denmark. If ticking this facility, the window will be modified with options for first selecting location (by GoogleMaps) and later reading the soil data for that location in the Danish soil data base. Actually, an interpolation procedure is performed between observed soil values close to the selected location. This is to provide the best possible estimate of local texture. The right-hand part of the ‘Describe site’ window is used for selecting the soil water conditions at which the simulation should be carried out. Soil strength and also stress transmission is dependent on the soil moisture conditions (see later sections for explanation of calculations). The user may
4
Schjønning, P., Lamandé, M., Lassen, P. 2015. An introduction to Terranimo® (www.terranimo.dk). Unpublished note, Aarhus University, Dept. Agroecology choose among pre-defined moisture conditions (‘Automatic by wetness’), Figure 4. ‘Moist’ corresponds to field capacity as found for example in the spring. In contrast, ‘Wet’ and ‘Dry’ should be selected in case traffic on winter-wet or medium dry summer situation should be simulated, respectively. Based on user’s choice, the matric potentials of the 15 10 cm increment layers of the soil profile are displayed below the selection table (Figure 4). As for soil texture, users may manually input matric potentials in case these are known,- f.ex. from tensiometer readings (‘Manual matric potential’, Figure 4).
Only available in DK version
Only available in DK version
Figure 4. The user interface for input of soil texture and moisture conditions (tab ‘Describe site’).
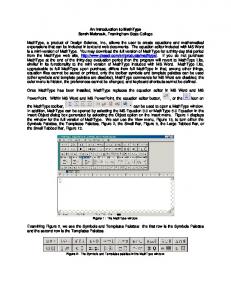
The ‘DAISY matric potential’ option is only active for Denmark. If activating this facility, again new options appear on the window. If location has not been chosen for soil texture input, the ‘Select location’ procedure should now be performed prior to activating the ‘Calculate DAISY matric potential’ button. Also the crop and the date for simulation should be chosen. After this, weather data are automatically read at weather stations close to the location selected, and estimates for the specific location obtained through interpolation as for soil data mentioned above. The soil matric potential is then calculated by the DAISY Soil-Plant-Atmosphere-Continuum model (Abrahamsen and Hansen, 2000). 9. Results: Contact stress The ‘Results: Contact stress’ tab provides a graph of the stresses in the contact area for all tyres on the selected machinery. Figure 5 shows the situation for a tractor-trailer combination for slurry application. All trailer tyres are Nokian ELS tyres loaded with each ~60 kN (6 tonnes). Three different combinations of tyre dimension and inflation pressure are used here to indicate the potential in reducing the contact stress (Figure 5).
5
Schjønning, P., Lamandé, M., Lassen, P. 2015. An introduction to Terranimo® (www.terranimo.dk). Unpublished note, Aarhus University, Dept. Agroecology
710/55R34, 2.2 bar 710/55R34, 1.2 bar 800/50R34, 1.0 bar
Figure 5. The contact area stress. Here for a tractor-trailer combination with trailer tyres loaded with each ~60 kN (6 tonnes) and equipped with Nokian ELS 710/55R34 at 2.2 bar (first axle), Nokian ELS 710/55R34 at 1.2 bar (recommended)(middle axle) and Nokian ELS 800/50R34 at 1.0 bar (recommended)(rear axle).
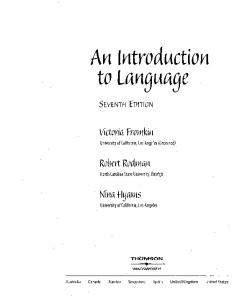
10. Results: Profile soil strength and stress The ‘Results: Profile soil strength and stress’ tab provides graphics comparing stress from the wheels with soil strength. Figure 6 illustrates the possibility of evaluating how stress and strength relate at two different moisture conditions for a forage harvester. The curved line depicts the stress from the wheel, while soil strength can be read as the boundary between the green and yellow areas of the plots. A stress level 150% that of the actual strength estimate is given as the boundary between the yellow and red area. Ideally, the stress line should be found within the green area for all soil depths,- at least for the non-tilled part of the soil profile. Serious compaction may be expected in case the stress line is within the red area. The case shown in Figure 6 indicates the importance of only driving on soils at moisture conditions that provide the necessary strength to carry the machines.
6
Schjønning, P., Lamandé, M., Lassen, P. 2015. An introduction to Terranimo® (www.terranimo.dk). Unpublished note, Aarhus University, Dept. Agroecology Field capacity moisture conditions
Stress seriously exceeding strength to ~0.55 m
Moderately dry soil
No serious exceeding of soil strength in the subsoil
Figure 6. Comparison of stress and strength for the front and rear tyres of a forage harvester driving on a silty loam soil at field capacity moisture conditions (top) or when the soil is moderately dry (bottom).
7
Schjønning, P., Lamandé, M., Lassen, P. 2015. An introduction to Terranimo® (www.terranimo.dk). Unpublished note, Aarhus University, Dept. Agroecology 11. Calculation of soil strength Terranimo® estimation of soil strength is based on the principle behind the precompression stress concept. Soil is assumed to behave elastically with increase in stress up to the precompression stress level. At higher stresses, soil deformation is plastic / permanent (Horn, 1993; Figure 7). Although this concept has proven problematic (e.g., Cavallieri et al., 2008; Keller et al., 2011), it seems to be the best option for quantification of soil strength in a soil compaction context (Schjønning et al., 2015a). There is though a need for scaling the level of stress found from laboratory tests to the stress levels observed to induce plastic deformation in the field. Keller et al. (2012) found that soil from subsoil layers tested in natural field conditions at field capacity moisture content – independent on soil type – were able to withstand a vertical stress of approximately 40 kPa, while precompression stress values determined for the soils as determined in the lab were much higher. Higher precompression stress levels at that moisture condition have also been observed by other researchers (e.g., Fleige et al., 2002). In Figure 7, the precompression stress (soil strength) is given by the breakpoint of the stress-strain plot with stress given in a logarithmic scale. The colours of the log(stress) – strain lines correspond to the colours in Figure 6: Green for stresses smaller than soil strength, yellow for stresses exceeding soil strength to 150% the soil strength, and red for stresses exceeding 150% the strength.
Figure 7. Sketch of the principles in determination of the precompression stress (soil strength) from laboratory tests, and the use of the stress-strength relation in Terranimo®. In real laboratory tests of soil, the transition between the elastic and plastic stress ranges is not as distinct as in the Figure. This is the reason for giving a red alert only when stress exceeds soil strength by 50%. The colours of the log(stress) – strain lines (green, yellow, red) correspond to those used in Figure 6 for advising on the risk of permanent compaction. Thus, for the conditions shown, Pact = 1.5 x Pc.
A data set on precompression stress was collected at Aarhus University (Schjønning and Lamandé, unpublished results). It includes a total of 584 field-sampled, undisturbed soil cores from nine locations (clay content range 4-17%) and four soil depths (0.3, 0.5, 0.8, 1.1 m), which were tested at three matric potentials (-50, -100 and -300 hPa; pF 1.7, 2.0, 2.5). The variation in precompression stress could be described by a combination of the matric water potential and soil content of clay (Figure 8). It appears that precompression stress is independent on soil type (soil content of clay) at a matric potential of -100 hPa (pF2). This is accordance with data of Cavallieri et al. (2008) and also with the field observations of soil strength by Keller et al. (2012). 8
Schjønning, P., Lamandé, M., Lassen, P. 2015. An introduction to Terranimo® (www.terranimo.dk). Unpublished note, Aarhus University, Dept. Agroecology The stress estimates in Figure 8 have been scaled to yield a constant value of approximately 50 kPa at pF2. This is to correspond to the field observed soil strength (Keller et al., 2012). We used 50 kPa rather than the previously mentioned 40 kPa because soil deformation in the field was negligible for small exceedings of the 40 kPa threshold (Keller et al., 2012). 3.0 110 100 90
60 80 70
Matric potential, pF
460 450 440 430 420 410 400 390 380 370 360 350 340 330 320 310 300 290 280 270 260 250 240 230
220 210 200 190 180 170 160 150 140 130 120
110 100 90
2.5
990 980 970 960 950 940 930 920 910 900 890 880 870 860 850 840 830 820 810 800 790 780 770 760 750 740 730 720 710 700 690 680 670 660 650 640 630 620 610 600 590 580 570 560 550 540 530 520 510 500 490 480 470
460 450 440 430 420 410 400 390 380 370 360 350 340 330 320 310 300 290 280 270 260 250 240 230
220 210 200 190 180 170 160 150 140 130 120
220 210 200 190 180 170 160 150 140 130 120
80
60
110 100 90
70 80 70
60
70
60 2.0
110 100 90 60 50
50
50
50
80
40
40 30
40 30
20 1.5
30
40
20 10
5
10
15
20
25
30
35
40
45
-1
Clay content (g 100 g )
Figure 8. Estimates of soil strength (kPa) used in Terranimo® International as influenced by soil content of clay and the matric potential, expressed here as pF (small values: wet soil; high values: dry soil). Note that the strength estimates are regression-predicted based on measured precompression stress values scaled to yield 50 kPa at pF2.
The trend in soil strength reveals a decrease with increasing clay content for wet conditions (pF