Quantile-based approaches to the spectral analysis of time series have recently ..... +plot(..) QuantileSD. +N: numeric. +R: numeric. +type: character. +ts: function.
Quantile-Based Spectral Analysis in an Object-Oriented Framework and a Reference Implementation in R: The quantspec Package Tobias Kley
arXiv:1408.6755v1 [stat.CO] 28 Aug 2014
Ruhr-Universit¨at Bochum
Abstract Quantile-based approaches to the spectral analysis of time series have recently attracted a lot of attention. Despite a growing literature that contains various estimation proposals, no systematic methods for computing the new estimators are available to date. This paper contains two main contributions. First, an extensible framework for quantilebased spectral analysis of time series is developed and documented using object-oriented models. A comprehensive, open source, reference implementation of this framework, the R package quantspec, was recently contributed to CRAN by the author of this paper. The second contribution of the present paper is to provide a detailed tutorial, with worked examples, to this R package. A reader who is already familiar with quantile-based spectral analysis and whose primary interest is not the design of the quantspec package, but how to use it, can read the tutorial and worked examples (Sections 3 and 4) independently.
Keywords: time series, spectral analysis, periodogram, quantile regression, copulas, ranks, R, quantspec, framework, object-oriented design.
1. A short introduction to quantile-based spectral analysis 1.1. Laplace and copula cumulants and their spectral representation Quantification of serial dependence in a stationary process (Xt )t∈Z is traditionally based on its autocovariance and autocorrelation functions, which measure linear dependencies among observations at different times. Periodicities of a time series are then most commonly analyzed by decomposing the autocovariance function, into a sum of sines and cosines. This approach is referred to as (ordinary) spectral analysis of time series and has been known for decades. As a statistical method, it has been investigated many times and is well understood. In the analysis of centered Gaussian time series this approach is particularly attractive, because the autocovariance function completely characterizes the distribution of the underlying process. If that process is not Gaussian, ordinary spectral analysis suffers from typical weaknesses of L2 -methods: it is lacking robustness against outliers and heavy tails, and is unable to capture important dynamic features such as changes in the conditional shape (skewness, kurtosis), time-irreversibility, or dependence in the extremes. In addition to this, only time series with an existing second moment can be analyzed at all. All of this was previously realized by many researchers, and various extensions and modifications of the L2 -periodogram have been
2
quantspec: Quantile-based Spectral Analysis in R
proposed to remedy those drawbacks. Approaches to robustifying the traditional spectral methods against outliers and deviations from the distributional assumptions were taken, among others, by Kleiner, Martin, and Thomson (1979); Kl¨ uppelberg and Mikosch (1994); Mikosch (1998); Katkovnik (1998); Hill and McCloskey (2013). To account for more general dynamic features alternative spectral concepts and tools were recently proposed. A first step in that direction was taken by Hong (1999). In order to obtain a complete description of the two-dimensional distributions at lag k, he introduced a generalized spectrum where covariances Cov(Xt , Xt−k ) are replaced by covariances Cov(eix1 Xt , eix2 Xt−k ) yielding a spectrum closely related to the joint characteristic functions of the pairs (Xt , Xt−k ). In the quantile-based approach to spectral analysis the objects of interest are the Laplace cross-covariance kernel � � ¯ k ∈ Z, γk (q1 , q2 ) := Cov I{Xt ≤ q1 }, I{Xt−k ≤ q2 } , q1 , q2 ∈ R, and the copula cross-covariance kernel � � γkU (τ1 , τ2 ) := I{F (Xt ) ≤ τ1 }, I{F (Xt−k ) ≤ τ2 } ,
τ1 , τ2 ∈ [0, 1], k ∈ Z,
where I{A} denotes the indicator function of the event {A} and F the marginal distribution function (the distribution function of any Xt , due to the assumed stationarity). Obviously these measures exist without the necessity to make assumptions about moments. Also, when the underlying process is not Gaussian, and the quantile-based measures of serial dependence are considered as functions with arguments q1 , q2 , or τ1 , τ2 respectively, they provide a much richer picture about the pairwise dependence than would the autocovariances. As in the approach of Hong (1999), a complete description of the joint distributions (or copulas) of the pairs (Xt , Xt−k ) is available. A particular advantage of the copula cross-covariance kernel is its invariance to monotone transformations. This allows to disentangle the serial features from the marginal features. For a full list of the properties and advantages of those dependence measures the interested reader be refered to Hong (2000); Li (2008, 2012, 2013, 2014); Hagemann (2011); Lee and Rao (2012); Dette, Hallin, Kley, and Volgushev (2014+); Kley, Volgushev, Dette, and Hallin (2014) and Kley (2014b). Under sumability conditions on (γk ) and (γkU ) the representations of (γk ) and (γkU ) in the “frequency domain” take the form of the Laplace spectral density kernel ∞ 1 X fq1 ,q2 (ω) := γk (q1 , q2 )e−ikω , 2π
¯ ω ∈ R, q1 , q2 ∈ R,
(1)
τ1 , τ2 ∈ [0, 1], ω ∈ R,
(2)
k=−∞
and the copula spectral density kernel fqτ1 ,qτ2 (ω) :=
∞ 1 X U γk (q1 , q2 )e−ikω , 2π k=−∞
where qτ := F −1 (τ ). By the relation Z
π
γk (q1 , q2 ) =
eikω fq1 ,q2 (ω)dω,
−π
and a similar representation for γkU (τ1 , τ2 ), the representations in the “frequency domain” are seen to be equivalent to the “time domain” quantities.
Tobias Kley
3
Sometimes considering the cumulated Laplace or copula spectral density kernels, which can be defined as Z ω ¯ ω ∈ [0, 2π], (3) fq1 ,q2 (λ)dλ, q1 , q2 ∈ R, Fq1 ,q2 (ω) := 0
and
Z Fqτ1 ,qτ2 (ω) :=
0
ω
fqτ1 ,qτ2 (λ)dλ,
τ1 , τ2 ∈ [0, 1], ω ∈ [0, 2π],
(4)
is more convenient. Quantities as γk and γkU , and their spectral representations (1)–(4) naturally come into the picture when the clipped processes (I{Xt ≤ q})t∈Z and (I{F (Xt ) ≤ τ })t∈Z are investigated. Such binary processes have been considered earlier in the literature by e. g. Kedem (1980). Observe that the quantile-based spectral quantities can be interpreted in terms of an orthogonal increment process of a spectral representation of the clipped process which exists for every stictly stationary process; no assumptions about moments are necessary. Recently, there has been a surge of interest in that type of concept, with the introduction, under the names of Laplace-, quantile- and copula spectral density and spectral density kernels, of various quantile-related spectral concepts, along with the corresponding sample-based periodograms and smoothed periodograms [cf. Li (2008, 2012, 2013, 2014); Hagemann (2011); Lee and Rao (2012); Dette et al. (2014+); Kley (2014b); Kley et al. (2014)]. Despite the vast amount of theoretical work, a public software solution was so far not available.
1.2. Estimators for the quantile-based spectral analysis of time series In this section of the introduction, various estimators (the so-called quantile periodograms) for the Laplace and copula spectra defined in Section 1.1 are briefly considered. For the upcoming definitions denote by X0 , . . . , Xn−1 an observed time series of the process (Xt )t∈Z , by n−1 X Fˆn (x) := I{Xt ≤ x} t=0
the empirical distribution function of X0 , . . . , Xn−1 , and by help("quantspec") on the R command line. Note that an index of all available functions can be accessed at the very bottom of the page. If for example more information on the constructor of QRegEstimator and on the class itself is desired, then > help("qRegEstimator") > help("QRegEstimator") should be invoked.Using this class to determine the frequency representation bτn,R (ω), for τ ∈ {0.25, 0.5, 0.75} would look as follows. In a toy example, where eight independent random variables X0 , . . . , X7 ∼ N (0, 1) are generated and used to compute bτn,R (ω), call
12
quantspec: Quantile-based Spectral Analysis in R
> Y bn bn QRegEstimator (J=5, K=3, B+1=1) Frequencies: 0 0.7854 1.5708 2.3562 3.1416 Levels : 0.25 0.5 0.75 Values: 0 0.785 1.571 2.356 3.142
tau=0.25 tau=0.5 tau=0.75 2.000+0.000i 4.000+0.00i 6.000+0.000i -0.354+0.354i -0.811-0.25i -0.207+1.207i 2.750+0.250i 0.250+0.75i 0.750-0.250i 0.354-0.439i 1.414+0.00i 1.207+0.207i 1.000+0.000i 1.000+0.00i 0.500+0.000i
Methods other than the constructor are implemented as generic functions. To invoke the method f of an object obj the call therefore is f(obj). In particular all attributes mentioned in the class diagram can be accessed via getter methods. There are no setter methods, because all attributes are completely handled by internal functions. For an example, to retrieve the attributes frequencies and parallel of the object bn, execute the following lines on the R shell > getFrequencies(bn) [1] 0.0000000 0.7853982 1.5707963 2.3561945 3.1415927 > getParallel(bn) [1] FALSE
Tobias Kley
13
To invoke a method f with parameters p1, ..., pk of an object obj the call is f(obj, p1, ..., pk). An example is to invoke the accessor function getValues, which is equipped with parameters to get the values associated with certain frequencies or levels. An exemplary call looks like this: > getValues(bn, levels = c(0.25, 0.5)) , , 1
[1,] [2,] [3,] [4,] [5,] [6,] [7,] [8,]
[,1] [,2] 2.0000000+0.0000000i 4.0000000+0.00i -0.3535534+0.3535534i -0.8106602-0.25i 2.7500000+0.2500000i 0.2500000+0.75i 0.3535534-0.4393398i 1.4142136+0.00i 1.0000000+0.0000000i 1.0000000+0.00i 0.3535534+0.4393398i 1.4142136-0.00i 2.7500000-0.2500000i 0.2500000-0.75i -0.3535534-0.3535534i -0.8106602+0.25i
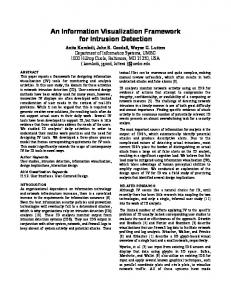
Note that the result is returned as an array of dimension c(J, K, B + 1), where in the present case B = 0 bootstrap replications were performed. For a detailed description on how to use the function getValues in the above mentioned case, access the online help via the command > help("getValues-FreqRep") Note the format method_name-class_name to access the help page of a method and that the attribute values is part of the abstract class FreqRep [cf. Figure 2]. A graphical representation of the data can easily be created by applying the plot command. For example, to compute and plot the frequency representations dτ32,R (ω), from 32 simulated, standard normally distributed random variables execute the following lines on the R shell: > dn plot(dn, frequencies = 2 * pi * (0:64) / 32, levels = c(0.25, 0.5)) The above script will yield the diagrams that are on display in Figure 3. Note that the dτ32,R (ω) were determined for τ ∈ {0.05, 0.1, . . . , 0.9, 0.95} and, by the default setting, for all Fourier frequencies from [0, π]. The plot, however, was parameterized to show only τ ∈ {0.25, 0.5}, but all Fourier frequencies from [0, 4π]; by default all available levels and frequencies would be used. In this example two of the 19 frequencies were selected to yield a plot of a size that is apropriate to fit onto the page. Further more, the plot was parameterized to show dn,R (ω) for all Fourier frequencies from [0, 4π] to illustrate characteristic redundancies in the frequency representation objects, and to point out that the default values are always sufficient. The two relations dτn,R (ω) = dτn,R (2π − ω),
dτn,R (ω) = dτn,R (ω + 2πj),
14
quantspec: Quantile-based Spectral Analysis in R
Imaginary part
1 −3 −1
0 −6
τ=0.25
4
8
3
Real part
0.5
1.0
1.5
2.0
0.0
0.5
1.0
1.5
2.0
0.5
1.0
1.5
2.0
0.0
0.5
1.0
1.5
2.0
4
0.0
0
5
−4
0
τ=0.5
15
0.0
ω 2π
Figure 3: Plot of the FrequencyRepresentation object bn. hold for any ω ∈ R and j ∈ Z, dτn,R (ω). Therefore, without additional calculations, the plot of dτn,R (ω) can be determined for any ω ∈ 2πj/n, j ∈ Z, as long as dτn,R (ω) is known for ω ∈ 2πj/n, j = 0, . . . , bn/2c, which is what is determined by the default setting. Note that all of this happens transparently for the user, as the method getValues takes care of it. Another fact that one can presume by inspecting Figure 3 is that dτn,R (ω) appears to be uncorrelated and centered (for ω 6= 0 mod 2π).
3.3. Additional elements of the package The quantspec package includes three demos that can be accessed via > demo("sp500") > demo("wheatprices") > demo("qar-simulation") Several examples explaining how to use the various functions of the package can be found in the online help files or the folder examples in the directory where the package is installed. The package comes with two data sets sp500 and wheatprices that are used in the demos and in the examples. A package vignette amends the online help files. It contains the text of this paper. Unit tests covering all main functions were implemented using the testthat framework (Wickham 2011).
15
2007
2008
2009 time t
2010
2011
0.8 0.4 0.0
0.0
−0.05
0.4
0.05
0.8
Tobias Kley
0 5
15
25
0 5
lag k
15
25
lag k
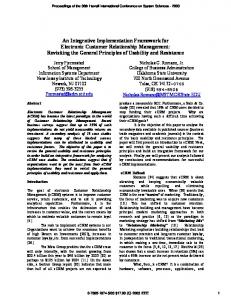
Figure 4: Returns (Yt ) of the S&P 500 returns example data (left), autocovariances 2 , Y 2 ) of the squared reCov(Yt+k , Yt ) of the returns (middle), and autocovariances Cov(Yt+k t turns (right).
4. Two worked examples 4.1. Analysis of the S&P 500 stock index, 2007–2010 In this section the use of the quantspec package from the perspective of a data analysts is explained. To this end an analysis of the returns of the S&P 500 stock index is performed. Note that a similar analysis and the data set used are available in the package. Calling demo("sp500") will start the computations and by sp500 the data set can be referenced to do additional analysis. For the example the years 2007 through to 2010 were selected to have a time series that, at least to some degree, can be considered stationary. Aside from this more technical consideration, employing the new statistical toolbox will reveal interesting features in the returns collected in the financial crisis that completely escape the analysis with the traditional tools blindly applied. For a start, use the following R script to plot the data, the autocovariances of the returns and the autocovariances of the squared returns. > > > >
library("zoo") plot(sp500, xlab = "time t", ylab = "", main = "") acf(coredata(sp500), xlab = "lag k", ylab = "", main = "") acf(coredata(sp500)^2, xlab = "lag k", ylab = "", main = "")
The three plots are displayed in Figure 4. Inspecting them, it is important to observe that the returns themselves appear to be almost uncorrelated. Therefore, not much insight into the serial dependency structure of the data can be expected from traditional spectral analysis. The squared returns on the other hand are significantly correlated. This observation, typically taken as an argument to fit an ARCH or GARCH model, clearly proves that serial dependency exists. In what follows the copula spectral density will be estimated from the data, using quantile periodograms and smoothing them. It will be seen that using the quantspec package this can be done with only a few lines of code necessary.
16
quantspec: Quantile-based Spectral Analysis in R
τ1 ,τ2 First, take a look at the CR periodogram In,R (ω). In the quantspec package it is represented as a QuantilePG object and can be computed calling the constructor function quantilePG with the parameter type = "clipped". To do the calculation for τ1 , τ2 ∈ {0.05, 0.5, 0.95}, all Fourier frequencies ω and with 250 bootstrap replications determined from a moving blocks bootstrap with block length ` = 32, it suffices to execute the first command of the following script:
> CR freq plot(CR, levels = c(0.05, 0.5, 0.95), + frequencies = freq[freq > 0 & freq plot(CR, levels = c(0.05, 0.5, 0.95), + frequencies = freq[freq > 0 & freq help("kernels")
Tobias Kley
17
To compute the smoothed CR periodogram from CR using the Epanechnikov kernel and bandwidth bw = 0.07 the first of the following two commands need to be executed. > sPG plot(sPG, levels = c(0.05, 0.5, 0.95), type.scaling = "individual", + frequencies = freq[freq > 0 & freq plot(sPG, levels = c(0.05, 0.5, 0.95), type.scaling = "real-imaginary", + ptw.CIs = 0.1, type.CIs = "boot.full", + frequencies = freq[freq > 0 & freq help("plot-SmoothedPG") Inspecting the plots in Figures 7 and 8 reveals that serial dependency in the events {Yt ≤ q0.05 } and {Yt ≤ q0.95 } is present in the data. This concludes the introduction of the quantspec package for data analysts and we can continue with the presentation of how it can also make the work of a probability theorist easier.
0.0 0.1 0.2 0.3 0.4 0.5
0.04 −0.04 0.08
0.0 0.1 0.2 0.3 0.4 0.5
0.00
−0.10
0.0 0.1 0.2 0.3 0.4 0.5
0.0 0.1 0.2 0.3 0.4 0.5
−0.04 0.02
0.00
0.0 0.1 0.2 0.3 0.4 0.5
τ1=0.95
0.02 0.0 0.1 0.2 0.3 0.4 0.5
0.00 0.10 0.20
0.02 −0.04
τ1=0.5
τ ,τ
In,1 R2(ω)
0.0 0.1 0.2 0.3 0.4 0.5
−0.01
0.00
−0.04
0.08
0.04
quantspec: Quantile-based Spectral Analysis in R
τ1=0.05
18
0.0 0.1 0.2 0.3 0.4 0.5
τ2=0.05
0.0 0.1 0.2 0.3 0.4 0.5
τ2=0.5
τ2=0.95
ω 2π
0.08
0.00
0.04
0.08
0.00
0.04
0.08
0.00 0.04
0.08
0.00
0.04
0.08
0.00
0.04
0.08
0.04
0.08
0.00
0.04
0.08
0.00
0.04
0.08
−0.04 0.00
0.08
−0.02 0.01 τ2=0.05
0.00
0.04
0.10
0.00
0.00
−0.02 −0.10
τ1=0.95
0.03
0.04 −0.04
0.08 0.00
0.04
0.04
0.00
0.00
τ1=0.5
τ ,τ
In,1 R2(ω)
τ1=0.05
Figure 5: Plot of the QuantilePG object CR, computed from the sp500 time series; ω ∈ (0, π].
τ2=0.5
τ2=0.95
ω 2π
Figure 6: Plot of the QuantilePG object CR, computed from the sp500 time series; ω ∈ (0, π/5].
−0.004
−0.004
0.02 0.0 0.1 0.2 0.3 0.4 0.5
0.0 0.1 0.2 0.3 0.4 0.5 0.020
0.010
0.0 0.1 0.2 0.3 0.4 0.5
0.005
−0.005
0.000 −0.020
τ1=0.95
0.0 0.1 0.2 0.3 0.4 0.5
0.0 0.1 0.2 0.3 0.4 0.5 0.004
0.06
0.0 0.1 0.2 0.3 0.4 0.5
0.04
0.010 0.000
τ1=0.5
^ Gn, R(τ1, τ2, ω)
0.0 0.1 0.2 0.3 0.4 0.5
19
−0.002 0.002
0.002
0.025 0.005
τ1=0.05
Tobias Kley
0.0 0.1 0.2 0.3 0.4 0.5
τ2=0.05
0.0 0.1 0.2 0.3 0.4 0.5
τ2=0.5
τ2=0.95
ω 2π
0.0 0.1 0.2 0.3 0.4 0.5 τ2=0.05
0.002 −0.006 0.04
0.0 0.1 0.2 0.3 0.4 0.5
−0.02
0.04
0.0 0.1 0.2 0.3 0.4 0.5
−0.02
0.04 −0.02
τ1=0.95
0.0 0.1 0.2 0.3 0.4 0.5
0.0 0.1 0.2 0.3 0.4 0.5 0.002
0.04
0.0 0.1 0.2 0.3 0.4 0.5
−0.02
0.04 −0.02
τ1=0.5
^ Gn, R(τ1, τ2, ω)
0.0 0.1 0.2 0.3 0.4 0.5
−0.006
−0.006
0.002
0.04 −0.02
τ1=0.05
Figure 7: Plot of the SmoothedPG object sCR, computed from the sp500 time series; type.scaling = "individual", ptw.CIs = 0.1.
0.0 0.1 0.2 0.3 0.4 0.5 τ2=0.5
0.0 0.1 0.2 0.3 0.4 0.5 τ2=0.95
ω 2π
Figure 8: Plot of the SmoothedPG object sCR, computed from the sp500 time series; type.scaling = "real-imaginary", ptw.CIs = 0.1, type.CIs = "boot.full".
20
quantspec: Quantile-based Spectral Analysis in R
4.2. A simulation study: Analysing a quantile autoregressive process In this section using the quantspec package from the perspective of a probability theorist is explained. The aim is twofold. On the one hand, further insight into a stochastic process shall be gained. Any process for which a function to simulate finite stretches of is available can be studied. On the other hand, the finite sample performance of the new spectral methods are to be evaluated. Note that the example discussed in this section and the functions to simulate QAR(1) processes are available inside the package, by calling demo("qar-simulation") and by referring to the function ts1, which implements the QAR(1) process that was discussed in Dette et al. (2014+) and Kley et al. (2014). Recall that a QAR(1) process is a sequence (Xt ) of random variables that fulfills Xt = θ1 (Ut )Xt−1 + θ0 (Ut ), where Ut is independent white noise with Ut ∼ U[0, 1], and θ1 , θ0 : [0, 1] → R are model parameters (Koenker and Xiao 2006). The function ts1 implements the model, where θ1 (u) = 1.9(u − 0.5), u ∈ [0, 1] and θ0 = Φ−1 , which was discussed in Dette et al. (2014+) and Kley et al. (2014). A complete list of models included in the package can be seen in the online documentation of the package by calling > help("ts-models") The following, two-line script can be used to generate the graphical representation of the copula spectral density that is on display in Figure 9 > csd plot(csd, ylab = expression(f[list(q[tau[1]], q[tau[2]])](omega))) When analysing a time series model the recommended practice is to compute the quantile spectral density once with high precision, store it to the hard drive, and load it later whenever it is needed. The following two lines of code can be used to do this: > csd save(csd, file="csd-qar1.rdata") With the first configuration (N = 29 and R = 100) the computation time was only around three seconds. To compute the second csd object (with N = 212 and R = 50000) the same machine needed roughly 2.5 hours. Storing the object in a file takes about 1MB of hard disk space. Not only values and stdErrors are stored within the QuantileSD object; also the final state of the pseudo random number generator is stored and the method increasePrecision can be used to add more simulation runs at any time to yield a better approximation to the true quantile spectrum. More information on this method can be found in the online help, which is accessible via > help("increasePrecision-QuantileSD")
Tobias Kley
21
Once the computation is finished the diagram on display in Figure 10 can be created using the following two lines of code: > load("csd-qar1.rdata") > plot(csd, frequencies = 2 * pi * (1:2^8) / 2^9, + ylab = expression(f[list(q[tau[1]], q[tau[2]])](omega))) The parameter frequencies was used when plotting the copula spectral density to create a plot that can be compared to the one in Figure 9. Note that by default the plot would have been created using all available frequencies which yields a grid of 8 times as many points on the x-axis (N = 212 vs. N = 29 ). Now, to get a first idea of how well the estimator performs, plot the smoothed CR periodogram computed from one simulated QAR(1) time series of length 512: > sCR plot(sCR, qsd = csd, + ylab = bquote(paste(hat(G)[list(n, R)](list(tau[1], tau[2], omega)), + " and ", f[list(q[tau[1]], q[tau[2]])](omega)))) The generated plot is on display in Figure 11. It is worth pointing out that in this example (N = 512) the estimator performs already quite well. Note that a different version of the constructor smoothedPG was used here than in Section 4.1. When computing a smoothed quantile periodogram straight from a time series, the syntax is the same as for quantilePG, but with the additional parameter weight. Finally, for the simulation study, a number of R = 5000 independent QAR(1) time series are generated. Before the actual simulations, some variables that determine what is to be simulated are defined: > > > > > > > > > >
set.seed(2581) ts