ing predictive model of user's behavior from the sensed data ... realizes flexible analysis of behavior history using visual language. We also introduce several visualizations on the ... a visual programming interface, so that users can develop.
mPATH: An Interactive Visualization Framework for Behavior History Masaki Ito 1 1
Jin Nakazawa 1
Hideyuki Tokuda 1 2
Graduate School of Media and Governance, Keio University 2 Faculty of Environmental Information, Keio University niya, jin, hxt�@ht.sfc.keio.ac.jp
Abstract This paper presents an interactive analysis and visualization framework for behavior histories, called mPATH framework. In ubiquitous computing environment, it is possible to infer human activities through various sensors and accumulation of their data. Visualization of such human activities is one of the key issues in terms of memory and sharing our experiences, since it acts as a memory assist when we recall, talk about, and report what we did in the past. However, current approaches for analysis and visualization are designed for a specific use, and therefore can not be applied to diverse use. Our approach provides users with programmability by a visual language interface for analyzing and visualizing the behavior histories. The framework includes icons representing data sources of behavior histories, analysis filters, and viewers. By composing them, users can create their own analysis method of behavior histories. We also demonstrate several visualizations on the framework. The visualizations show the flexibility of creating behavior history viewers on the mPATH framework.
1. Introduction In ubiquitous computing environment where computers and sensors are embedded in our surroundings and assist our life, cognition of human behavior will be possible. Today, sensing technology is one of the hottest topics for ubiquitous computing researchers. Various technologies for generating a sensor network have developed[11][18]. By sensor networks, acquisition of information in a certain place like temperature, humidity, noise level and light level is realized. In addition, tracking an object are also enabled by the coordination of sensors. Technologies for mobile computing[5][1][6] are also useful to sense our activities and environmental information. Sensors equipped with a mobile device acquire various information of the user such as a location, movement orientation and a physiological status by alone or coordination with infrastructures in surroundings[21][16]. Inferring highly abstracted behavior of a user and creating predictive model of user’s behavior from the sensed data are also hot challenges in ubiquitous computing research. There are many researches which aim to guess user’s con-
text and provide adaptive services. Several context processing technologies are proposed for the purpose[23][22]. In addition to processing sensor data in a certain time, storing and utilizing an accumulation of behavior data brings us a possibility to develop new applications[2]. A well presented behavior history helps human activities in terms of memory and sharing our experiences since it acts as a memory assist when we recall, talk about, and report what we did in the past[17][13]. For example, displaying user’s shopping log reminds him or her of goods which he or she intended to buy, and helps explanation of his or her intention of shopping to his or her company. Analysis techniques of behavior history are important to find useful information from it. There are already various proposed methods for analyzing accumulated behavior history. However these methods are designed for a specific use, and hence users may not acquire applicable information. The analysis method of behavior history, therefore, should be flexible enough to find various information from behavior history. In this paper, we presents a programmable analysis and visualization framework for behavior histories, called mPATH framework. In the mPATH framework, analysis methods are modularized and we can create various analysis methods using visual programming language. The framework allow every developers and users to mine behavior history intuitively and flexibly. This paper is organized as follows. In the next section, we argue problems of visualization of behavior history. In section 3, we introduce mPATH framework which realizes flexible analysis of behavior history using visual language. We also introduce several visualizations on the mPATH framework in section 4. We evaluate the framework in section 5 and introduce related works in section 6. In the final session, we conclude this paper.
2. Visualization of Behavior History In this paper, behavior history is an aggregated form of information which contains location, date and description of behavior about a certain person. Location track data obtained by a GPS receiver is an example of the behavior history. A digital photo image is also behavior history if it contains a time stamp and a location information as its
Proceedings of the 19th International Conference on Advanced Information Networking and Applications (AINA’05) 1550-445X/05 $20.00 © 2005 IEEE
meta-data. Well presented behavior histories help our memory and communication. We often remember our past behavior in daily life. For example, we often plan what we will do for the weekend remembering stores and places which attracted us in the past. Also, we often talk with people remembering our past experiences. There are several researches to assist memory and communication by visualizing past behaviors[19][17][13]. When we remember our past behaviors, we do not merely remember them chronologically, but remember them selecting and organizing the informations that we need then. For instance, when you tell about the travel that you had, you will tell the places and foods that you were interested in. Also, you might focus on the places where you visited with the listener. Thus, which information you need in your past behavior varies depending on the situation. Behavior history also useful in modeling user’s activity and predicting next action. In many context-aware application, researchers uses behavior history for adaptive behavior of the systems. Such applications infer user’s interest and purpose by analyzing behavior histories. While developing a context-aware application, developer need to select and organize for a certain application.
2.1. Behavior History Analysis for Visualization We focus on the analysis process of behavior histories to find interesting data and organize them when we develop memory assist applications and context-aware applications. Following functions are required for analysis system of behavior history. Support of Temporal and Spatial Analysis. Since behavior histories are characterized as their location and time parameter, supporting temporal and spatial analysis is required in addition to generic numeric analysis. Selection of data within a certain location or period is one example. Joining multiple data using a certain time or location as a key is another example. These analysis assist in finding characteristics in behavior histories. Support of Trial and Error Analysis. The diversity and irregularity of captured data from sensors require heuristic development of analysis method. Users who analyze behavior history need to adjust algorism and parameters for a certain history data. Thus, the system should be programmable to support such trial and error development of analysis method. Reusability of Analysis Method. Since there are various behavior histories, developed analysis method specialized to a certain behavior history should be reused to other histories. For example, analysis method for finding interesting points from a shopping history should be applied to photography history. Analysis methods, therefore, are independent of a certain history format.
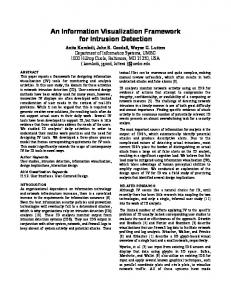
3. An Interactive Behavior History Mining Framework In this paper, we propose an interactive behavior history analysis framework called mPATH framework. We can input various behavior histories to the framework and analyze in various ways on it. The mPATH framework provides a visual programming interface, so that users can develop various analysis method intuitively through GUI. Figure 1 shows the screen shot of the system.
Figure 1. mPATH Framework
3.1. Features of the mPATH Framework The following are features of the mPATH framework. Component-based Architecture. For supporting programmability and reusability, we divided the method into several components and realize development of an analysis method by combining several components like filtering data, counting data and classifying data. Interactive Visual Programming. We provide data flow style of visual programming interface to combine multiple analysis components. Structure of analysis method is shown visually and users can modify it by simple mouse operation. User’s operation is immediately reflected to the system. Therefore users can easily develop original analysis method for a certain visualization. Unified Behavior History Format. We defined unified internal data format of behavior history and geographic information. Since all internal data can be accessed by the unified way, we can easily reuse analysis method to various behavior history.
3.2. Input of Behavior History By utilizing icons of behavior history and geographic information, we can input data to mPATH framework. Various ways to acquire data are shown equally as icons such
Proceedings of the 19th International Conference on Advanced Information Networking and Applications (AINA’05) 1550-445X/05 $20.00 © 2005 IEEE
as acquisition of data from files, through a network, or from a equipped device. Following data can be input in current implementation. GPS Location Track Data. We implemented an input function of location track data acquired by GPS. With this function, we can input track data files of handy GPS, Garmin eTrex[12]. We can also input real time location data from the handy GPS through RS-232C port with NMEA0183 format. Digital Photo. We implemented input function of digital photo data. The function generates behavior history of “taking pictures” by reading time stamps and location in EXIF[15] information. In addition, by matching timestamps of photos with location track data, it estimates location where the photos were taken without location information.
3.4. Output Result of Analysis Result of analysis is connected to an icon of output function, and utilized by various applications. Visualization application and context-aware application are examples of such applications. Applications can run not only within the framework, but also as a distributed application by transporting the result through a network. We currently focus on developing visualization application as follows, and planning to develop distributed contextaware application using mPATH framework by developing output function through a network. Normal Map Viewer. To visualize spatial aspect of behavior history, we developed normal map viewer. In this viewer, every input is ordered by the geographic coordinates, so that generic map-like visualization is realized. This viewer accepts multiple data and overlays them. Figure 2 shows an example of a normal map viewer.
Vector Map. We implemented an input function of map data in a vector format. There are many map data for GIS like Shape format[10] for ArcGIS[9] and the format of the Geographical Survey Institute of Japan. These map contains points of station, lines of road and polygons of buildings. Users can infer detail of behavior in a certain position, and use the map as a background of visualization.
3.3. Analysis of Behavior History We can analyze behavior history using icons of analysis components. All analysis components are designed as filters with input and output connector, we can combine several filters. Following filters are currently implemented. Time Filter. Time filter extracts behavior histories during a specified term. Speed Filter. Speed filter filters data by its speed. It is useful especially to infer transportation means from location track data.
Figure 2. Normal Map Viewer
Table Viewer. We developed table viewer to show details of data by characters and figures. This viewer lists every input data, so that it is useful especially for developing analysis method. Figure 3 shows an example of the viewer.
Way point Filter. Way point filter classifies GPS point data into movements and stops. Users can change threshold of time to detect the user’s stop. Matching Filter. Matching filter joins two input data according to location. When we input one from the map data and the other from way points data, this filter adds name of places to each way point. Count Filter. Inside the count filter, geographical regions are divided into a grid. The filter counts input data in every grid. Users can learn how many times he or she visited a certain point, i.e. a weight of the point, in behavior history.
Figure 3. Table Viewer
Weight Map Viewer. Weight Map Viewer shows weights of each geographical region visually in addition to normal map. There are several ways to visualize weights of regions such as colors of a map, scale of a map, or distortion of
Proceedings of the 19th International Conference on Advanced Information Networking and Applications (AINA’05) 1550-445X/05 $20.00 © 2005 IEEE
a map. In current implementation, we use scale of each regions to show weights. Figure 4 shows an example of a weight map viewer, which is used to emphasize the places where user passed by or took pictures.
observation of GPS data which belong in a specific time period.
Figure 5. A Program of Visualization Behavior History on a Map
4.2. Listing Stay Point
Figure 4. Weight Map Viewer
3.5. Development of mPATH Filter
We developed an application which lists name of points where a user stayed. We extracted the stay points by a formalize filter and matched them with a map by a matching filter. We displayed them as a list using table viewer. Figure 6 shows the program, and Figure 3 is the output of the application. We can regard places where a user stayed for a long time as places he or she made some behavior. In this example, user’s home and university are extracted.
In addition to combining existing filters, users can develop original filters. Following methods are prepared for developers of filters.
¯ getBehaviorElement(GeoShape area): This method was called when analysis result is required by lower filters. The filter returns all analyzed result in the given region as a unified format. ¯ afterConnectFrom(BehaviorFilter fromFilter): This method is called when other filter is connected to input. A connected filter is noticed as an argument. ¯ afterDisconnectFrom(BehaviorFilter fromFilter): This method is called when connected upper filter is disconnected. ¯ preNotification(BehaviorFilter fromFilter): This method is called when the state of upper filter is changed. The filter should analyze again the output of the upper filter.
4. Examples of Visualization On the mPATH framework, we developed three visualization applications of behavior histories.
4.1. Visualization of Behavior History on a Map We developed visualization application of behavior history using a map as a background. The application displays not only track data as lines, but also places where he or she stayed for more than threshold time as point. Figure 5 shows the program. We applied a time filter and a formalize filter to GPS data and displayed it with a vector map on a normal map viewer. Changing parameters of the time filter enables
Figure 6. A Program of Listing Stay Point
4.3. Weight Visualization of Travel Log We developed a visualization application of travel log by emphasizing regions where traveler passed through or took pictures. We developed an algorism which calculate weights of each regions by counting times the traveler passed through and took pictures. Figure 4 shows the usage of the application to show sightseeing log, and the application weights especially places where user took pictures. The application can display photo images, so that users can use it as a photo browser. Figure 7 shows the program of the application. Location tracking data, stay point data and photo data are counted by count filters, and used to visualize map and photo as weight. Users can learn how many times he or she visited a certain point, i.e. a weight of the point, in behavior history.
5. Evaluation In this section we evaluate the performance of the mPATH system. It shows if the response of the system is enough to develop analysis and visualization methods interactively. It can also be used to find functions which should be improved. For measuring the performance, we used the environment shown in table 1 and used data shown in table
Proceedings of the 19th International Conference on Advanced Information Networking and Applications (AINA’05) 1550-445X/05 $20.00 © 2005 IEEE
Figure 7. A Program of Weight Visualization of Travel Log Figure 8. Measurement of the Overhead 2. These data are collected from the experiment of Ito, who has been carrying handy GPS since June 2003. Table 1. Evaluation Environment CPU memory OS JDK
Pentium4 2.53GHz 1024MB Linux 2.4.22 J2SDK 1.4.2 03
Figure 9. Application Performance Table 2. Data for Evaluation Type description size
GPS location tracking Jun. 2003 – Nov. 2003 1,956,381 byte
Map Data Fujisawa city 9,261,000 byte
6. Related Works We introduce several researches and products as related work of mPATH framework in points of view of an analysis of behavior history and a visual programming language.
5.1. Overhead of Component Architecture
6.1. Analyzing Behavior History
We measured the performance of the component architecture, therefore the architecture seemed to be an overhead compared to a hard-coding implementation. We measured simple visualization method with several time filters, in which we changed the number of the time filter. Figure 8 shows the result of the measurement. While we increased time filter from zero to 15, the growth of the time is small. This result shows that the overhead of connecting analysis components is small.
There are already many researches which aim to acquire and utilize behavior history. PEPYS[19] is one of the earliest fruits of such researches on the ubiquitous computing research area. PEPYS uses Active Badge[27] to acquire location information of each users, and generate text-based behavior logs like diaries. Cyberguide[1] also accumulate location history to inform tourist attractions which a traveler prefers. This system uses GPS to acquire location information, however the system uses names of tourist attractions which already prepared with geographic coordination. Analyzing location information described as geographic coordination is tough problem since the cost of calculation and creating users’ activity model increases. [20] and [4] is trying to infer user’s behavior and transportation means from location track data of GPS and creating user’s activity model to predict future behavior. In the research area of the transportation planning, many researchers are trying to use GPS receivers to acquire a movement of a crowd instead of counting passers in several places of a city. They argue mainly on the accuracy and correction of raw GPS data[28][26].
5.2. Performance of the Visualization We measured the performance of a visualization system constructed on the mPATH system. We used simple visualization application in which location track data and map data are rendered on a same window, and measured the time required for rendering. Figure 9 shows the result. It also shows the result of rendering single location or map. Lowest case of rendering time is about 800ms, and in the case of small scale maps, it takes more than 1500ms. In the overlaid case, the rendering time of the map are two times the single rendering of the map, and can be reduced.
Proceedings of the 19th International Conference on Advanced Information Networking and Applications (AINA’05) 1550-445X/05 $20.00 © 2005 IEEE
6.2. Visual Programming We introduce several visual programming system which provides users with programmability for data analysis. These systems do not focus on behavior history, but provide flexibility of data analysis and representation by visual language manner. Many data flow visual languages are proposed[14] for music[7], image processing, scientific visualization[8][3] and creating user interface. As business applications, data mining application such as Intelligent Miner of IBM, Enterprise Miner[24] of SAS and Clementine[25] of SPSS provide visual programming language to develop analysis method.
7. Conclusion In this paper, we presented an interactive analysis and visualization framework for behavior histories, called mPATH framework. The mPATH framework provides data flow visual language, and enable flexible and interactive analysis by connecting analysis components through mouse operation. By component architecture, the framework enable providing various analysis result for various applications. We implemented mPATqH framework with Java language, and demonstrate constructing various viewer applications. We also evaluated performance of the framework, and proved its interactivity.
References [1] G. Abowd, C. Atkeson, J. Hong, S. Long, R. Kooper, and M. Pinkerton. Cyberguide: A mobile context-aware tour guide, 1997. [2] G. D. Abowd. Software Engineering Issues for Ubiquitous Computing. In proceedings of ICSE’99, pages 13–19, April 1999. [3] Advanced Visual Systems. http://www.avs.com. [4] D. Ashbrook and T. Starner. Learning Significant Locations and Predicting User Movement with GPS. In Sixth International Symposium on Wearable Computers(ISWC 2002), pages 101–108, October 2002. [5] G. Chen and D. Kotz. A survey of context-aware mobile computing research. Technical Report TR2000-381, Dept. of Computer Science, Dartmouth College, November 2000. [6] K. Cheverst, N. Davies, K. Mitchell, and A. Friday. Experiences of developing and deploying a context-aware tourist guide: the GUIDE project. In Proc. of the Sixth Annual ACM International Conference on Mobile Computing and Networking (MobiCom2000), pages 20–31, 2000. [7] Cycling’74. Max/MSP. http://www.cycling74.com/products/maxmsp.html. [8] S. Dogru, V. Rajan, K. Rieck, J. R. Slagle, B. S. Tjan, and Y. Wang. A Graphical Data Flow Language for Retrieval, Analysis, and Visualization of a Scientific Database. Journal of Visual Languages & Computing, 7(3):247–265, 1996. [9] Environmental Systems Research Institute Inc. ArcGIS. http://www.esri.com/software/arcgis/index.html.
[10] Environmental Systems Research Institute Inc. ESRI Shapefile Technical Description. An ESRI White Paper. July 1998. [11] D. Estrin, R. Govindan, J. Heidemann, and S. Kumar. Next Century Challenges: Scalable Coordination in Sensor Networks. In Proceedings of the ACM/IEEE International Conference on Mobile Computing and Networking, pages 263– 270, Seattle, Washington, USA, August 1999. ACM. [12] Garmin Ltd. Garmin eTrex Legend, 2001. http://www.garmin.com/products/etrexLegend/. [13] J. Gemmell, G. Bell, R. Lueder, S. Drucker, and C. Wong. MyLifeBits: Fulfilling the Memex Vision. In ACM Multimedia ’02, pages 235–238, 2002. [14] D. D. Hils. Visual Languages and Computing Survey: Data Flow Visual Programming Languages. Journal of Visual Languages and Computing, 3(1):69–101, March 1992. [15] JEIDA. Digital Still Camera Image File Format Standard (Exchangeable image file format for Digital Still Cameras: Exif) Version 2.1. 1998. [16] C. Jiang and P. Steenkiste. A Hybrid Location Model with a Computable Location Identifier for Ubiquitous Computing. In Proceedings of the 4th international conference on Ubiquitous Computing, pages 246–263. Springer-Verlag, 2002. [17] M. G. Lamming and W. M. Newman. Activity-based Information Retrieval: Technology in Support of Personal Memory. Information Processing, III:68–81, 1992. [18] lan F. Akyildiz, W. Su, Y. Sankarasubramaniam, and E. Cayirci. A Survey on Sensor Networks. IEEE Communications Magazine, pages 102–114, August 2002. [19] W. M. Newman, M. A. Eldridge, and M. G. Lamming. PEPYS: Generating Autobiographies by Automatic Tracking. In Proceedings of ECSCW ’91, pages 175–188, September 1991. [20] D. J. Patterson, L. Liao, D. Fox, and H. Kautz. Inferring High-Level Behavior from Low-Level Sensors. In Proceedings of The Fifth International Conference on Ubiquitous Computing (UBICOMP2003), pages 73–89, 2003. [21] N. B. Priyantha, A. Chakraborty, and H. Balakrishnan. The Cricket Location-Support System. In Proc. of the Seventh Annual ACM International Conference on Mobile Computing and Networking (MobiCom2001), pages 32–43, August 2000. [22] M. Roman, C. K. Hess, R. Cerqueira, A. Ranganathan, R. H. Campbell, and K. Nahrstedt. Gaia: A Middleware Infrastructure to Enable Active Spaces. In IEEE Pervasive Computing, pages 74–83, 2002. [23] D. Salber, A. K. Dey, and G. D. Abowd. The Context Toolkit: Aiding the Development of Context-Enabled Applications. In CHI, pages 434–441, 1999. [24] SAS Institute Inc. SAS Enterprise Miner. http://www.sas.com/technologies/analytics/datamining/miner/. [25] SPSS Inc. SPSS Clementine. http://www.spss.com/clementine/. [26] P. Stopher, P. Bullock, and Q. Jiang. GPS, GIS and personal travel surveys: an exercise in visualisation. 25th Australasian Transport Research Forum Incorporating the BTRE Transport Policy Colloquium, October 2002. [27] R. Want, A. Hopper, V. Falcao, and J. Gibbons. The active badge location system. In ACM Transactions on Information Systems, vol 10, pages 91–102, January 1992. [28] J. Wolf, R. Guensler, and W. Bachman. Elimination of the travel diary: An experiment to derive trip purpose from GPS travel data. Notes from Transportation Research Board, 80th annual meeting, January 2001.
Proceedings of the 19th International Conference on Advanced Information Networking and Applications (AINA’05) 1550-445X/05 $20.00 © 2005 IEEE