oriented programming modules embedded in the GIS and simulation software ... waterway with the capability to input real-time or custom- ized data, based on ...
Proceedings of the 2008 Winter Simulation Conference S. J. Mason, R. R. Hill, L. Mönch, O. Rose, T. Jefferson, J. W. Fowler eds.
AN OBJECT-ORIENTED PROGRAMMING APPROACH FOR A GIS DATA-DRIVEN SIMULATION MODEL OF TRAFFIC ON AN INLAND WATERWAY Daniel Sasso William E. Biles Department of Industrial Engineering University of Louisville Louisville, KY 40292, USA fluencing world trade patterns and economic expansion in many remote areas of the world. There are three main tools that were key to this implementation: GIS, object-oriented programming, and Arena-based simulation.
ABSTRACT This research proposes the integration of a Geographic Information System (GIS) with the Arena Simulation software to model the transit of ocean-going vessels through the Panama Canal. The purpose of this integration is to initialize the simulation model with the vessels that are currently transiting the system and the ones ready to begin their transit taking into account waiting time in queue, booking status, navigation restrictions and their times through the locks. The interface process consists of gathering vessel location and attribute data, which is loaded in database format in the GIS where it is analyzed and displayed in a map containing the location of the locks, anchorage areas, tie-up stations and the transit route. Once analyzed, Arena reads the GIS data from the database and proceeds with the simulation considering navigation transit time, locks transit and lockage times.
2 METHODOLOGY 2.1
The methodology involved with the GIS consisted of a series of steps that provided an accurate representation of the Panama Canal by capturing geographic data (coordinates), storing it in a database, querying specific features based on location or attribute values to analyze and manage it, displaying the vessels on the map and providing an interface for the simulation model. The mapping scheme that the software uses consists of organizing spatial data as a collection of thematic layers linked by geography (Murad-alshaikh et al. 2003). The initial set of layers focused on the political data layer, which contains the country’s shape and boundaries and on top of the political data layer came the lakes and rivers layers that constitute Panama’s hydrography. The next components of the map were the navigation channels and the Canal locks. There are five navigation channels that were modeled with the East and West lanes. The channels are the following: Pacific Entrance, Miraflores Lake, Gaillard Cut, Gatun Lake, and the Atlantic Entrance. There are three sets of locks: Miraflores Locks, Pedro Miguel Locks, and Gatun Lock, and these were also modeled with the East and West lanes and their corresponding chambers. The coordinates for the navigation channels were gathered using a Garmin GPS (Global Positioning System) in a transit throughout the Canal.
1 INTRODUCTION Geographic Information Systems (GIS) have become a worldwide application that can integrate and relate any data with a spatial component in order to support the decision making criteria in many organizations. This research demonstrates how the GIS technology can be integrated with a simulation software as an interface to model the transit of ocean-going vessels through the Panama Canal. The data analysis and integration is accomplished through objectoriented programming modules embedded in the GIS and simulation software utilized for the implementation. The Panama Canal provides an ideal opportunity to demonstrate the potential of such application in an inland waterway with the capability to input real-time or customized data, based on critical information from the Canal. The Panama Canal is a 50-mile long waterway that joins the Atlantic and Pacific Oceans through the Isthmus of Panama with an average of 12,000 vessel transits per year in-
978-1-4244-2708-6/08/$25.00 ©2008 IEEE
Geographic Information Systems (GIS)
2.2
Object-oriented Programming
A valuable advantage of the GIS software utilized (ArcGIS Desktop 9.0) is that both applications come with Visual Basic for Applications (VBA) embedded. This option pro-
2590
Sasso and Biles vides an integrated programming environment. These applications have Visual Basic Editor (VBE) which enables an interface to write a Visual Basic (VB) macro and integrate VB's functionality with the extensive object library embedded in the software. Object-oriented programming is a structure or design for computer programming languages in which the user works with objects that have properties and behaviors that can carry out specific instructions (Burke 2003). ArcObjects is the object-oriented programming development platform for the ArcGIS applications used in this research. It provides the framework that enables data management and map presentation functions common to GIS applications. The object models implemented in this model are the following: 1. ArcMap Object Model 2. Map Layer Object Model 3. Geometry Object Model 4. GeoDatabase Object Model 1 The vessels currently in the system are generated by randomly sampling coordinates in the transit route layers. The first step into generating these vessels is initiating the programming sequence with the ArcMap Object Model by defining the current document which is the working map. The object navigation continues until accessing the Map Layer Object Model which contains the East and West lane transit route layers. Once the layers were selected, since the vessels in the system are represented by points in the map, it was necessary to navigate towards the Geometry Object Model. The logic behind this sequence is to define a geometry element which is going to be part of the map, and the type of element, in this case a point. The number of points is selected through a graphical user interface (GUI) which allows the definition of other vessel attributes such as: direction (North or South), and vessel mix based on vessel types. At the time the number of vessels in the system is entered, a random coordinate sampling algorithm is executed generating coordinate locations along the East and West lanes inside the Canal. As the algorithm runs through the iterations, the generated data is placed in a geodatabase which stores spatial features (points, line and area data) and their attributes in a relational database management system (RDBMS) table (Access, Oracle, DB2, and SQL Server), it is a native data format for all ArcGIS applications (Murad-al-shaikh et al. 2003). The geodatabase is in Microsoft Access database format which will be the interface between ArcGIS and Arena.. As all the vessel location points are generated, the next phase was to calculate the remaining transit distance in the waterway subject to the direction, whether it is North or South. This is accomplished through the Map Layer Object Model. The navigation segments are separated by points which will be the location reference to calculate the distance. The distance matrix k × m was developed for this purpose. The last step into finalizing the GIS module was defining two more attributes for the vessels in the sys-
tem, identifying in which navigation channel (Pacific Entrance, Miraflores Lake, Gaillard Cut, Gatun Lake or Atlantic Entrance) the vessel is in and the remaining transit distance to the next point where an activity takes place based on the distance matrix and vessel direction. This was accomplished through other set of algorithms working with the distance matrix structure and logic. 2.3
Simulation Model
The software that provides the flexibility and the tools to interact with the GIS module in order to perform the data analysis is Arena. The capability of Arena is demonstrated with the integration Microsoft Access, Microsoft Excel, VBA, and SIMAN blocks through object-oriented programming triggered by the GIS application. “For specialized needs, like complex decision algorithms or accessing data from an external application, you can write pieces of your model in a procedural language like Visual Basic or C/C++.” (Kelton, Sadowski, and Sturrock 2004). There are three components to the simulation model: 1. Model initialization 2. Navigation channels 3. Canal Locks 2.3.1
Model Initialization
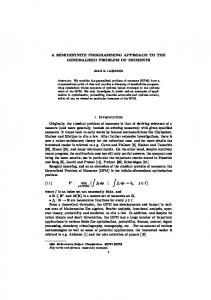
Arena has VBA built-in events which center around the simulation run as shown in Figure 1 from Kelton, Sadowski, and Sturrock (2004).
Figure 1: Arena Simulation-run VBA Events The RunBeginReplication event is where the simulation initialization takes place. From the GIS module previously described, the geodatabase contains two tables, one with the vessels in the system on the East lane and another table with the vessels in the system on the West lane. One of the many attributes in the table was a replication number. As the simulation run begins, the coding on this event generates a replication table through SQL (Structured Query Language) instructions. The replication table contains only those vessels and corresponding attributes for
2591
Sasso and Biles and non-initialized system and it was demonstrated how the non-initialized system would require a warm-up period in order to gather un-biased statistical data versus the initialized system which allows collecting statistical data without a warm-up period.
the specific replication. The SQL instruction validates the replication number through a SIMAN variable that contains this data and is updated on every replication. In the same manner the replication table is updated with the corresponding data. Since the number of vessels vary based on the GIS GUI input, it not possible to have an Arena create module with a set number of entities. Within this event there is also a coding scheme that counts the number of records in the replication table and assigns it to a variable called VesselCount. This variable was introduced into the create module through object-oriented programming in the entities per arrival field along with a batch number of one in max arrivals. This implies that all vessels will arrive at the same time, which is at time equal zero. The logic behind this decision is that the vessels are already in the system and do not require any arrival distribution. When the simulation run begins, vessels in the system are generated in the create module at time equal zero and proceed through a series of decide modules which will redirect them to the corresponding navigation channel based on the navigation channel attribute created in the GIS model. As the navigation channels are selected, an assign module calculates the remaining travel time dividing the remaining navigation channel travel distance by the allowed travel speed and adds a time travel attribute to the vessel entity. The vessel is then connected to the navigation channel through a route module. The Panama Canal has three scenarios that can be modeled: 1. Traffic heading northbound and southbound simultaneously in both transit lanes. 2. Traffic heading northbound in both transit lanes 3. Traffic heading southbound in both transit lanes The scope of this research focuses on the simulation model initialization. Banks et al. (2001), suggest several methods of reducing the initialization bias in a steady-state simulation in order to avoid any artificial and unrealistic initial conditions in this type of simulation. If it is an existing system, the approach would be to collect data and use it to specify more typical initial conditions. “It is recommended that simulation analysts use any available data on existing systems to help initialize the simulation, as this will usually be better than assuming the system is to be completely stocked, empty and idle, or brand new at time 0” (Banks et al. 2001). In order to proceed with this method, vessel data was generated based on existing historical mix. Moving forward, it was necessary to establish a single overall output performance measure that was entered into the statistic module of Arena in order to compute the total work in process (WIP) of all vessels combined. The history of this variable was tracked by plotting the curve versus time during the simulation in order to have a visual approximation on when the curve appears to have stabilized in order to specify a reasonable warm-up period. On all three scenarios the curve was plotted for the initialized
2.3.2
Navigation Channels
As previously mentioned, there are five navigation channels: Pacific Entrance, Miraflores Lake, Gaillard Cut, Gatun Lake, and Atlantic Entrance. The entrances need to be modeled differently from the others because these need to have a module to create vessels transiting northbound or southbound. The entrance starts with a create module to generate vessels followed by an assign module which will give the originating vessel the same attributes as described for the initialization vessels except for the distance. This attribute is not needed because these are starting from the beginning and will transit all the navigation channels in the waterway. As there are two transit lanes the channels need to take into consideration the East and West lane as well as the direction which could be northbound or southbound. There are two decide modules which will direct the vessel based on its attributes. If the vessel is traveling northbound from the Pacific Ocean, the module will direct the vessel towards the Miraflores Locks, and if the vessel is traveling southbound, it will direct the vessel towards the Pacific Ocean. The other navigation channels are basically the same except for the module to generate the vessels and modeling an exit to any of the two Oceans. 2.3.3
Canal Locks
The locks’ modules vary in modeling complexity based on the number of chambers. The Pedro Miguel locks only have one chamber on each side, one for the East lane and one for the West lane, therefore, it only needs a process module per chamber. Following the same logic as the navigation channels it needs to consider the vessel direction, in this case if the vessel is heading northbound the next modeling section will be the Gaillard Cut, and if it is traveling southbound the next modeling section will be the Miraflores Lake. The highest complexity increases when modeling the Gatun Locks. These locks have three chambers per lane and determining the modeling logic for vessels heading northbound or southbound is more challenging. Every chamber requires a decide module because from each module there are two options based the heading attribute. A vessel in chamber 1 can be directed to chamber 2 or to the Gatun Lake, consequently, a vessel in chamber 2 can be directed to chamber 1 or chamber 3, and finally a vessel in chamber 3 can be directed to chamber 2 or to the Atlantic entrance.
2592
Sasso and Biles From the results of the non-initialized system, it can be inferred that 15 vessels in the system utilized for the initialized system might not have been the correct number of vessels to have at time equal zero. A number closer to 18.950 based on the simulation results may have been a better approach. The number of 15 vessels was more to emulate choosing vessels at a real-time scenario of the Canal, which could still be the case. The results presented in this paper demonstrate the logic behind the GIS/Arena integration and how the results are gathered in order to demonstrate its functionality. The initialized and non-initialized work in process graphs demonstrate the effect of starting the simulation empty and idle versus starting the simulation with vessels already in the system. It is obvious from the graphs, that the noninitialized system will require a warm-up period in order to have the capability to gather statistics within a certain confidence level without being biased. The modeling approach developed by Franzese et al. (2004), consisted of three inputs components: vessel arrival mix, traffic rules, and vessel pre-sequencing. The time between arrivals was based on historical or forecasted demand assigning the vessel type attributes to establish the transit rules. The model developed in this research incorporates vessel arrival mix based on historical data taking into account vessel types as attributes in order to establish the navigation rules. The input consists of an initialization interface that allows the placement of vessels currently in the system at the beginning of the simulation. This application provides the flexibility to model different scenarios inside the Canal. It is a new method for generating replications based on a simulation map.
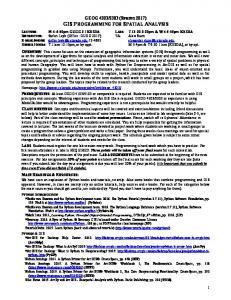
All the processing times in the locks were determined by distribution utilizing the Input Analyzer from Arena. Processing times are based on vessel categories and historical times gathered from the Panama Canal Authority (2003). 3 RESULTS In this paper, the results for scenario 1 will be demonstrated. Figure 2 shows a graph with the behavior of the WIP curve with 5 replications superimposed on the graph. Warm up - Scenario 1 Non-Initialized
Vessels in the system
40 35 30
Rep 1 Rep 2
25 20
Rep 3 Rep 4 Rep 5
15 10 5 164
152
141
130
120
112
102
88.4
77.3
67.5
57.4
35
45.1
25.9
0
14.2
0
Time (hours)
Figure 2: Scenario 1 Non-Initialized The system starts stabilizing between 14 and 15 hours, a reasonable warm-up period would be at about twenty four hours before gathering statistical data. With this setting, the average WIP was of 18.950 at a 95% confidence interval with 60 replications. Figure 3 is a graph of the WIP curve with 5 replications superimposed, demonstrating the system being initialized with 15 vessels at time equal zero.
4 SUMMARY In summary, the modeling approach implemented in this research demonstrated how to integrate a GIS with Arena in order to initialize a steady-state simulation. Figure 4 represents a flow of this process driven by object-oriented programming. It also introduces two new techniques in simulation: 1. Model initialization. It introduces vessels in the system at the start of the simulation rather than having to warm-up the model in order to gather un-biased statistical data. It provides the flexibility to model different scenarios inside the Canal by varying the vessel mix based on historical data or real-time vessel selection. 2. Simulation replications. It introduces a new method for generating replications in simulation runs. As the vessels are initially placed in the system at the start of simulation based on specific coordinate locations, these same types of vessels are randomly relocated at different coordinate lo-
35 30
Rep 1
25
Rep 2
20
Rep 3
15
Rep 4
10
Rep 5
5 167
157
146
139
131
119
109
96.8
87.4
77.2
66.1
55.3
46.3
34.8
22.7
0
0 10.8
Vessels in the system
Warm up - Scenario 1 Initialized
Time (hours)
Figure 3: Scenario 1 Initialized There were no warm-up period considerations for this simulation run. The warm-up period at Arena’s replication parameters was set to 0. With this approach, the average WIP was of 19.316 at a 95% confidence interval with 60 replications.
2593
Sasso and Biles cations at the beginning of each simulation replication for the length of the simulation run.
REFERENCES Banks, J., J. S. Carson, B. L. Nelson, and D. M. Nicol. 2001. Discrete-event system simulation. 3rd ed. Upper Saddle River, New Jersey: Prentice-Hall, Inc. Burke, R., 2003. Getting to Know ArcObjects: Programming ArcGIS with VBA.. Redlands, CA: ESRI Press. Franzese, L. A .G., L. O. Abdenur, D. Starks, R. C. Botter, and A. Cano. 2004. Simulating the Panama Canal: Present and Future. Proceedings of the 2004 Winter Simulation Conference, 1835-1838. Kelton, W. D., R. P. Sadowski., and D. T. Sturrock. 2004. Simulation With Arena. 3rd ed., Boston, MA: McGraw-Hill. Murad-al-shaikh, M., K. Page, M. Stewart, and M. Taggart. 2003. Introduction to ArcGIS I (for ArcView 8, ArcEditor 8, and ArcInfo 8) Course Lectures and Exercises. Redlands, CA: ESRI Press. Panama Canal Authority. 2003. Simulation Model of Panama Canal Transit Operations - Request for Proposals No. CDO–150552. Panama: Panama Canal Authority.
GIS Enter vessels in the system (random coordinate generation)
Perform navigation channel location analysis
Determine remaining transit distance
Populate database with vessel data
Plot vessels in map
Execute Simulation
AUTHOR BIOGRAPHIES DANIEL SASSO is a Sr. Operations Engineer at Yum Brands Inc. involved in developing simulation analysis for production lines and labor deployments among other tasks. He spent eight years working in the transportation industry as a contractor for the U.S. Air Force in Panama and is currently involved in Geographic Information Systems implementation and inland waterway simulation analysis at the University of Louisville where he earned his Ph.D. in Industrial Engineering.
ARENA Open Arena
Start Simulation
WILLIAM E. BILES is the Clark Chair of Computer Aided Engineering in the Department of Industrial Engineering of the University of Louisville. He spent two years in the US Army and seven years in industrial R&D before undertaking an academic career. He has held academic appointments at the University of Notre Dame, Penn State, Louisiana State University, and the University of Louisville. Dr. Biles received the Distinguished Engineering Alumnus award from the University of Alabama in Huntsville in 2004. His most recent publication is “Environmentally Benign Manufacturing,” Chapter 1 in the 2007 John Wiley handbook Environmentally Conscious Manufacturing.
Start replication
Read vessel attributes from database t=0
Assign vessels to navigation channels t=0
Run Simulation
End Replication
End Simulation
Figure 4: GIS/Arena Process Flow 2594