An Open Source Spreadsheet Solver for Vehicle Routing Problems G¨ une¸s Erdo˘gan School of Management, University of Bath, BA2 7AY, Bath, UK
Abstract The Vehicle Routing Problem (VRP) is one of the most frequently encountered optimization problems in logistics, which aims to minimize the cost of transportation operations by a fleet of vehicles operating out of a base. This paper introduces VRP Spreadsheet Solver, an open source Excel based tool for solving many variants of the Vehicle Routing Problem (VRP). Case studies of two realworld applications of the solver from the healthcare and tourism sectors that demonstrate its use are presented. The solution algorithm for the solver, and computational results on benchmark instances from the literature are provided. The solver is found to be capable of solving Capacitated VRP and DistanceConstrained VRP instances with up to 200 customers within 1 hour of CPU time. Keywords: Vehicle Routing Problem, Metaheuristics, Spreadsheets, Open Source Software
1. Introduction The Vehicle Routing Problem (VRP) is one of the most frequently encountered optimization problems in logistics, which aims to minimize the cost of transportation operations by a fleet of vehicles operating out of a base called depot. It arises in many industries and contexts at tactical and operational levels. The VRP has been introduced more than 50 years ago by Danztig [8], Email address:
[email protected] (G¨ une¸s Erdo˘ gan)
Preprint submitted to Computers & Operations Research
February 16, 2017
and many variants of the VRP that incorporate additional features such as time windows (intervals in which the customers may be visited) and fleet composition [22] have been studied. Despite its operational nature, the VRP is considered to be in the academic domain of Operations Research rather than Operations Management. This is due to the inherent difficulty of solving a VRP, not only due to the complexity of the associated solution algorithms but also practical considerations regarding the implementation of the solution. From a practitioner’s perspective, there exist a number of barriers to develop an in-house VRP solver. Developing a solution algorithm for VRP is a daunting task, and even if an open-source academic code is to be used as the solution algorithm, most academics develop algorithms in C++ and the resulting codes are not designed for the faint-hearted. The travel distance and duration data have to be repeatedly retrieved from a GIS, due to their dynamic nature, which introduces either a recurring cost of acquisition or the requirement for in-house specialist knowledge. It is not straightforward to manually compute the existing cost of the vehicle routes, much less so to visualize and compare the existing and optimized solutions, which is important to demonstrate the benefit of an optimization tool. Although there exist many commercial software packages to solve VRPs, any package must be integrated with the existing software infrastructure of the company, and needs to be learned by the planning managers. Most commercial VRP software packages have a black-box component, the algorithm determining the vehicle routes, since the developers will want to protect their intellectual property. Finally, every real-world application of the VRP has specific needs to which the software should be custom-tailored, which requires a constant link with the company that developed it. In case the company ceases to exist, the software faces the risk to become obsolete in a few years. In this study, we introduce VRP Spreadsheet Solver that overcomes the problems stated above through the familiarity of its interface, ease of use, flexibility, and accessibility. Microsoft Excel is arguably the standard software for small to medium scale quantitative analysis for businesses, and is being used in almost 2
every corner of the world, in both academia and industry alike [19]. Many software packages have built-in functionality to exchange information with Excel, which eases the integration of the solver. The code for the solver, developed using Visual Basic for Applications (VBA), is open-source and can be understood and modified by medium-level programmers. VRP Spreadsheet Solver has built-in functions to query a GIS web service, from which the distances, driving times, and maps can be retrieved. The solver is available for download on an academic website at no cost [12], and has been downloaded over 2000 times. VRP Spreadsheet Solver has been used in practice by multiple organizations in diverse sectors and countries. The organizations that provided feedback include two US companies in the oil industry, an Argentinian company in the agriculture industry, a Finnish company in the tourism sector, and two chains of chilled food delivery in Taiwan and Turkey, all of which report significant savings. We believe that VRP Spreadsheet Solver has the potential to be used throughout the world and achieve savings for many Small and Medium-sized Enterprises (SMEs), and consequently reduce CO2 emissions. Furthermore, new VRP variants have emerged through our interaction with the users that are relevant to other sectors, and they are our contribution to the literature. The rest of this paper is organized as follows. In Section 2, we provide a brief list of applications of the VRP. In Section 3, we present two case studies of the application of VRP Spreadsheet Solver, and a resulting new VRP variant. We provide a brief overview of how to use VRP Spreadsheet Solver in Section 4. In Section 5, we present a unified formulation that encompasses all variants of the VRP that VRP Spreadsheet Solver can handle, a metaheuristic optimization algorithm that VRP Spreadsheet Solver utilizes, and the results of VRP Spreadsheet Solver on a number of benchmark instances. Finally, in Section 6, we give our concluding remarks.
3
2. Applications of the VRP With the progress of computer hardware and optimization software, better algorithms and implementations for the VRP emerge every year. The computational reach of exact algorithms for the VRP is limited to 200 customers for the most studied basic variants of the VRP, e.g. the column-and-cut generation algorithm of [2], and decreases significantly for more realistic variants that include features such as a heterogeneous fleet or distance constraints. On the other hand, state-of-the-art metaheuristic algorithms e.g. Adaptive Large Neighborhood Search [29], Iterated Local Search [31], and Unified Hybrid Genetic Search [34] can handle much larger instances and detailed operational constraints but cannot offer a mathematical guarantee of performance. As stated in the introduction, many commercial and free solvers exist for the VRP. A recent survey [28], based on the answers to a questionnaire by 15 software vendors, have provided a number of characteristics of available VRP software packages. More recent surveys [4, 35] list a number of commercial and free VRP software packages, the latter including VRP Spreadsheet Solver, and provide features required of VRP software packages. We refer the interested reader to the comprehensive book of Toth and Vigo [32] for critical reviews of many variants of the VRP and the associated solution algorithms. In the rest of this section, we provide a brief list of applications of the VRP. The list is by no means complete, but is provided to give an impression of the generality of VRP and the diversity of the industries and contexts it arises in. The most straightforward applications of the VRP are found in the logistics sector. Companies in the small package shipping industry, for example, aim to minimize the routing cost while keeping the routes of the drivers as consistent as possible [16]. A decision support tool utilized by Toyota for selecting third party logistics service providers based on optimized vehicle routes is presented in [30]. The problem of a large Benelux logistics service provider that aims to minimize the total transportation cost in a multi-depot system, which consists of the speed-related, distance-related, and vehicle-related costs of transportation
4
is analyzed in [9]. Some examples of the VRPs arising in urban transportation are the efficient routing of the school buses [3], and the design of tourist tours for visiting multiple points of interest in a city [15]. The joint problem of bin allocation and vehicle routing to optimize solid waste collection is studied in [18]. There is also a growing body of literature on optimizing the rebalancing operations for shared bicycle systems that aim to minimize the total cost and maximize the user satisfaction [14]. The importance of the use of VRP models in humanitarian logistics have been underlined in the survey by Van Wassenhove [33]. Optimizing post-disaster relief operations by minimizing estimated total travel time of vehicles is studied in [27]. The problem of finding the optimal routes for teams that survey a disaster area to assess damage and relief needs is analyzed in [21]. Planning of fuel distribution operations in the case of a domestic disaster is studied in [26], where the authors use VRP Spreadsheet Solver to optimize the routes. With the increasing emphasis on climate change and environmental concerns, a venue of research within the VRP has emerged in the past decade, named as Green Vehicle Routing Problems (G-VRP). The objective function of these problems focus on minimizing CO2 emissions, noise pollution, and accidents, as stated in the recent survey on G-VRP [10]. The problem of minimizing the risk of running out of fuel, which is prominent in the route planning for Alternative Fuel Vehicles, is studied by [13]. The problem of determining the optimal size and mix of a vehicle fleet of electric vehicles is analyzed by [20]. Applications of the VRP are not limited to companies with a sole focus on logistics. Indeed, variants of VRP may arise in any context where a pickup or delivery service is performed. Specifically, examples from the healthcare sector include routing of nurses for home health care [24] and the transportation of blood donations to storage centers [36, 7], and the delivery services for biological samples collected from patients to testing laboratories [1].
5
3. Case studies VRP Spreadsheet Solver can solve more than 64 variants of the VRP, based on features related to selective visits to customers, simultaneous pickups and deliveries, time windows, fleet composition, distance constraint, and the final destination of the vehicles. Some of these variants are relevant in practice but have not been formally studied. VRP Spreadsheet Solver can hence provide a starting point and a benchmark result for future studies on such problems. In the rest of the section we go over two case studies in which VRP Spreadsheet Solver was used, and a new VRP variant that we introduce as a result. 3.1. Healthcare sector A non-profit organization based in Istanbul, Turkey provides a set of healthcare services at home, including visits by medical doctors and nurses providing physiotherapy and psychotherapy, as well as logistic services such as patient transport, domestic cleaning, and personal hygiene. The services are performed at no cost and are provided for the poor, elderly, and disabled citizens. The number of registered patients is over 3000, and an average of 1000 patients in separate locations are served each day. The organization operates out of three bases and owns a fleet of 90 vehicles, each of which can by driven by the health specialists and contains a small medical inventory. The logistics planning manager of the organization intended to use the nurse service as a test case for VRP Spreadsheet Solver and apply it to the planning of other services if the results were successful. This service operates out of one of the bases on the Anatolian side of the city with 20 vehicles and serves 150 patients per day on the average. The visits are planned in advance with no time window specified, and all patients scheduled for a visit on a given day must be visited. The service time per patient, although there are slight variations, was assumed to be constant. The vehicles are refueled during the night and their range is enough to cover a day trip, so the distance limit is not a binding constraint. Even though the vehicles are from different makers and models, they
6
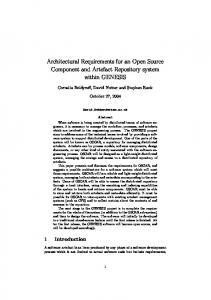
are considered identical in terms of operational parameters. Each nurse has a driving time limit of 8 hours as per the general regulations about driving, and a working time limit of 9 hours including the lunch break. Capacity of the vehicles does not seem to be a binding constraint, since there is no patient transport service involved and the medical supplies in a vehicle can last a day. However, concerns of equal work allocation to the nurses were brought up that were not addressed by the working time limit. Given the size of the city and heavy traffic, a solution may contain routes with long driving times and a small number of patient visits, and other routes with short driving times and a significantly larger number of visits. To prohibit unequal work distribution in terms of patients visited, each vehicle was assigned a capacity that is slightly larger than the ratio of the number of patients to be served to the number of vehicles, and each patient location was assigned a demand value of 1. Initial runs with this setting seemed to satisfy the workload equity concerns. However, problems with the solution were realized upon a detailed analysis of the results. The driving durations retrieved from the GIS web service are based on using the main arteries of the transportation infrastructure (i.e. highways), and although the speed of transportation on the arteries are acceptable, getting into and out of the arteries is time consuming. Hence, a solution that visits multiple districts of the city accumulates a higher driving time than the GIS driving durations provide. To overcome this problem, the users at the organization modified the driving durations by adding a penalty term to the durations between locations in separate districts to prohibit the routes from changing districts multiple times. After a few experiments with this penalty parameter, the users found a setting for which the resulting routes were observed to be more realistic. The visualization of the resulting solution for a day with 150 patient locations is provided in Figure 1. The return arcs to the depot are omitted for a clearer visualization. The organization refrained from providing figures regarding cost savings, but the feedback indicated that the planning process was more transparent to their staff and the use of the tool increased their awareness of the finer 7
Figure 1: Visualization of the result for the case study in the healthcare sector
details of the transportation component of their operation. This case study serves to show that the decision makers often have managerial concerns that are not directly addressed in the routing literature, the GIS data may not give an accurate reflection of the reality, and parameters of VRP Spreadsheet Solver can be used to generate solutions that can address managerial concerns as well as shortcomings of the available data. 3.2. Tourism sector A tourism company based in Finland offers numerous types of travel packages, the main one being a ferry trip between the cities of Helsinki and Tallinn (Estonia). The customers use the ferry for a day trip or an overnight visit to Tallinn, or to other cities in Estonia / Baltic countries for 1-7 days. These routes are operated from 4 to 7 days during the week, depending on the season. The company aims to maximize profitability by planning the travel packages based on demand forecasts and vehicle capacities. A significant portion of their cost is due to the bus service they outsource from subcontractors to pick up customers from their houses on the morning of their trip, and return them back to their houses at the end of their trip. The buses subcontracted by the company are based in 7 depots, one of them 8
in Helsinki. The buses are of different models and make, and can have different carrying capacities. The subcontractors charge a fixed price per day of use, so the problem becomes minimizing the number of buses needed, a problem of packing as well as routing. The customers need to be at the ferry terminal in Helsinki 15 minutes before the ferry departs, and some depots are located quite far away from Helsinki, which pushes the driving time and working time limits to be binding constraints. There are no time windows for the customers, and all locations containing customers must be serviced. The buses based in Helsinki perform closed tours, in which they pick up customers and return to the ferry port. On the other hand, the buses based at the other depots perform “open” tours, i.e. finish their trip in a location that is not their depot. These buses eventually go back to their respective depots using the exact same route traversed in the reverse direction. A sample solution is depicted in Figure 2, where locations that do not contain any customers are not visited.
Figure 2: Visualization of the result for the case study in the tourism sector
The problem at hand is then an instance of the the Close–Open Mixed Vehicle Routing Problem (COMVRP) introduced in [23]. We agree with the authors of this paper that the COMVRP has applications in many sectors in which the
9
transportation service is subcontracted to companies based at multiple cities. An extension of the COMVRP is the Close-Open Mixed Team Orienteering Problem, in which the customers are serviced selectively based on the capacity and the distance limit of the vehicles. A formulation that is capable of solving both these new variants as well as others is presented in Section 5.
4. How to use VRP Spreadsheet Solver In this section, we will briefly describe the structure of the worksheets and the menu of VRP Spreadsheet Solver. We will be focusing on its usability rather than the technical details, for which the interested user can refer to the user’s manual. 4.1. Structure of the spreadsheets VRP Spreadsheet Solver keeps the data about the elements of a VRP in separate worksheets, and adopts an incremental flow of information. Initially, the workbook only contains the worksheet named VRP Solver Console. The remaining worksheets, 1.Locations, 2.Distances, 3.Vehicles, 4.Solution, and 5.Visualization, are generated in the sequence denoted by their indices. Figure 3 depicts the information flow between the spreadsheets, where the arrows signify the dependence of a worksheet on another worksheet.
Figure 3: Spreadsheet structure of VRP Spreadsheet Solver
To guide the user about which cells of a spreadsheet to work on, we have adopted the following color scheme. The cells with a black background are
10
set by the worksheets and should not be modified. The cells with a green background are parameters or decisions to be set by the user. The cells with a yellow background are to be computed by the worksheets, but they can be edited by the user for what-if analysis. The cells with an orange background signal a warning, e.g. a vehicle arriving before the beginning of the time window of a customer. The cells with a red background signal an error, e.g. a vehicle violating the capacity constraint. The worksheets described below utilize this color scheme. 4.1.1. VRP Solver Console This worksheet stores and provides information to the rest of worksheets. It contains various parameters regarding the size of the instance being solved and its characteristics including the number of depots and customers, number of vehicle types, the width of time windows. In addition, the user can set the options about GIS data retrieval, and the time that the user allows the solver to work on the problem. A screenshot of the worksheet is presented in Figure 4.
Figure 4: VRP Solver Console spreadsheet
4.1.2. 1.Locations The details about the locations including their names, addresses, coordinates, time windows, and pickup and delivery service requirements are kept in 11
this worksheet. The coordinates can be input manually, or copied and pasted from an external source, or populated using the GIS web service based on the addresses input by the user. It is good practice to provide a postcode with every address, since vague addresses may correspond to unreachable points e.g. the address of a park being resolved to be in the middle of a lake. It is possible to prohibit the vehicles from visiting certain customers using the options in this worksheet, for quick what-if analysis without data modification. Figure 5 displays a screenshot of the worksheet.
Figure 5: 1.Locations spreadsheet
4.1.3. 2.Distances This worksheet contains the distances and travel durations between every two points that are specified in the 1.Locations worksheet. As of the time of this writing, using the GIS web service to populate the distances and driving distances takes about 5 minutes for 50 locations and 45 minutes for 150 locations. The number of locations for which the distance matrix can be computed is limited by the GIS web service and the type of access the user has to it. VRP Spreadsheet Solver provides an estimate the time requirement for this step by simply multiplying the number of entries in the distance matrix by a factor of 0.1 seconds. The parameter about the type of route (shortest or fastest) is crucial. Choosing the shortest route usually finds routes that go through city centers, which are subject to strict speed limits and heavy traffic. Hence, using the fastest route is usually a better option for large distance delivery operations. On the other hand, fastest routes may end up using peripheral highways of the city too
12
frequently, and consequently the shortest paths may be better suited to companies performing intra-city delivery operations. It is also possible to retrieve real-time driving durations based on the traffic, which is computed and provided by the GIS web service. The user can prohibit the vehicles from traveling between two given locations by manually setting the relevant distance to a high value. A screenshot of the 2.Distances worksheet is depicted in Figure 6.
Figure 6: 2.Distances spreadsheet
4.1.4. 3.Vehicles The data about the vehicle types are kept in this worksheet. The user can set the number of vehicles of each type that are kept at each depot. The data includes cost parameters such as the cost per unit distance and the cost per trip, as well as operational parameters e.g. the depot, capacity, driving time limit, and the distance limit of the vehicle. Only one capacity parameter exists, which may correspond to the weight capacity of trucks in the case of an excavation operation, the volume capacity of tanker trucks in the case of oil transport, or the maximum number of passengers in the case of school bus routing. Figure 7 displays a screenshot of the worksheet.
13
Figure 7: 3.Vehicles spreadsheet
4.1.5. 4.Solution This worksheet is generated to contain the list of stops for each vehicle specified in 3.Vehicles, and it uses the information in 1.Locations to regarding service times and pickup / delivery amounts, as well as the distance and duration in 2.Distances to compute the departure / arrival times the cost of traveling between customers. The worksheet computes the net profit rather than cost, to accommodate variants of the VRP that accumulate profits when customers are selectively visited. This worksheet contains a number of conditional formatting features that are designed to visually identify infeasible solutions and facilitate manual solution construction. For example, a vehicle exceeding its capacity or distance limit, or a customer being visited out of its time window are highlighted in red. It is also possible to copy and paste lists of customers between vehicle routes for the purpose of manual modification of the routes. A screenshot of the 4.Solution worksheet is provided in Figure 8.
Figure 8: 4.Solution spreadsheet
14
4.1.6. 5.Visualization The locations and the routes of the vehicles can be visually inspected by generating this optional worksheet. Options in the VRP Solver Console may be set to display various details about the locations including their pickup / delivery amounts or service times. This worksheet simply contains a scatter graph with the map of the region retrieved from the GIS web service. It can be formatted, e.g. made smaller or larger, or display axes, for the needs of the user as any other graph object of Excel. Figure 9 displays a screenshot of the worksheet.
Figure 9: 5.Visualization spreadsheet
4.2. Structure of the menu of VRP Spreadsheet Solver The menu is located in the “Add-ins” tab of the ribbon, and consists of 5 core and 3 optional commands to set up the worksheets. It also includes the command to engage the solver, as well the optional calls to a feasibility checker for manually modified solutions and an external solver that advanced users may develop and compile into a Dynamically Linked Library (DLL) file. The numerical indices of the commands match the numerical indices of the worksheets for ease of use.
15
Figure 10: VRP Spreadsheet Solver menu
5. A unified formulation for the VRP and the solution algorithm The field of VRP research is mature and many solution algorithms have been developed. The best known heuristic algorithm is arguably the savings algorithm Clarke and Wright [6]. Many metaheuristic algorithms have been proposed in the last decade, the most successful being the Adaptive Large Neighbourhood Search [29], Iterated Local Search [31], and Genetic Algorithms [34]. In the rest of this section we provide a unified formulation for the VRP that encompasses all variants of the VRP that VRP Spreadsheet Solver can handle, the pseudocode of the metaheuristic solution algorithm implemented with VRP Spreadsheet Solver, the details of how the infeasible solutions are handled, and the computational results of our algorithm on benchmark instances. 5.1. A unified formulation for the VRP We first provide the notation that we will use to state the formulation. Let us define the vertex set VD to contain the depots, VC to contain the customers, and V = VD ∪VC . Furthermore, we define VM ⊆ VC as the set of customers that must be visited. Let G = (V, A) be the complete directed network on which we will solve the VRP. We define the profit of servicing a customer i ∈ VC as pi , the pickup service amount for the customer as qi , the delivery service amount as qˆi , and the service time required by the customer as si . Furthermore, we
16
define the time interval for the customer as [ai , bi ]. Note that there is also a time interval for each depot vertex. Let us denote the set of vehicles as K, and define for each vehicle k ∈ K the origin depot of the vehicle as ok ∈ VD , the work start time of the vehicle as τ k , the fixed cost of using the vehicle as f k the capacity of the vehicle as ˆ k , the working time Qk , the distance limit as Dk , the driving time limit as D limit as W k , and the return depot of the vehicle as rk . Associated with each arc (i, j) ∈ A, there is a distance dij and driving duration dˆij . In addition, for each vehicle k ∈ K, there is a travel cost ckij on arc (i, j). Next, we present the parameters related to the operational constraints. Let us define Ω to be equal to 1 if the vehicles have to return to their specified return depots and 0 otherwise. Similarly, let us define β to be 1 if there is a backhaul constraint, and 0 otherwise. In addition, we define Θ to be equal to 1 if the time windows can be violated at the cost of a penalty Π per unit time, and 0 otherwise. We are now ready to define the decision variables. Let xkij be equal to 1 if vehicle k traverses arc (i, j) and 0 otherwise. Furthermore, let yik be equal to 1 if vehicle k visits and serves vertex i, and 0 otherwise. The amount of the pickup commodity and the delivery commodity carried by vehicle k on arc k k (i, j) is defined as wij and zij , respectively. We also define tki as the time at
which vehicle k arrives at vertex i, and vi as the amount of violation of the time window of vertex i. The formulation for the unified VRP is then:
Maximize
X X
pi yik −
i∈VC k∈K
subject to
X
X X
ckij xkij −
X X j∈VC k∈K
(i,j)∈A k∈K
f k xkok ,j − Π
X
vi
(1)
i∈V
yik = 1
∀i ∈ VM ,
(2)
yik ≤ 1
∀i ∈ VC \ VM ,
(3)
k∈K
X
k∈K
X
j∈V \{i}
xkij ≤
X
xkji
∀j ∈ VC , k ∈ K,
j∈V \{i}
17
(4)
X
xkpq ≥ yik
∀i ∈ VC , k ∈ K, S ⊂ V : ok ∈ S, i ∈ V \ S,
p∈S,q∈V \S
(5) X
xkpq ≥ Ωyik
∀i ∈ VC , k ∈ K, S ⊂ V : i ∈ S, rk ∈ V \ S,
p∈S,q∈V \S
(6) X
xkok ,j ≤ 1 ∀k ∈ K,
(7)
xkij ≤ 1 − β
(8)
j∈VC
X
k∈K
X
k wij −
X
k wi,r k =
k wij = qi yik
∀i ∈ VC , k ∈ K,
(9)
qj yjk
∀k ∈ K,
(10)
j∈VC
i∈VC
X
k − zji
X
k = qˆi yik zij
∀i ∈ VC , k ∈ K,
(11)
j∈V \{i}
j∈V \{i}
X
X j∈V \{i}
j∈V \{i}
X
∀(i, j) ∈ A : qi > 0 and qˆj > 0
zokk ,j =
i∈VC
X
qˆi yik
∀k ∈ K,
(12)
i∈VC
tki + (dˆij + si )xkij − W k (1 − xkij ) ≤ tkj
∀(i, j) ∈ A : j ∈ VC , k ∈ K, (13)
ai ≤ tki ≤ bi − si + vi
∀i ∈ VC , k ∈ K,
(14)
vi ≤ M.Θ ∀i ∈ VC ,
(15)
tkok = τ k
(16)
∀k ∈ K,
tki + (si + dˆij )xki,rk ≤ brk + vrk + M (1 − Ω) ∀(i, j) ∈ A : i ∈ VC , k ∈ K, (17) k k wij + zij ≤ Qk ∀(i, j) ∈ A, k ∈ K, X dij xkij ≤ Dk ∀(i, j) ∈ A, k ∈ K,
(18) (19)
(i,j)∈A
X
ˆk dˆij xkij ≤ D
(i,j)∈A
X
i∈VC
si yik +
X
∀(i, j) ∈ A, k ∈ K,
dˆij xkij ≤ W k
(i,j)∈A
18
∀(i, j) ∈ A, k ∈ K,
(20) (21)
xkij ∈ {0, 1} ∀(i, j) ∈ A, k ∈ K,
(22)
yik ∈ {0, 1} ∀i ∈ VC , k ∈ K,
(23)
vi ≥ 0 ∀i ∈ VC ,
(24)
k ≥ 0 ∀(i, j) ∈ A, k ∈ K, wij
(25)
k zij ≥ 0 ∀(i, j) ∈ A, k ∈ K.
(26)
The objective function (1) maximizes the total profit collected minus the travel cost of vehicles, fixed cost of using vehicles, and the penalty for violating time windows. We first state the constraints set the visit rules for the customers by the vehicles. Constraint (3) enforces a visit to the customers that must be visited, and constraint (2) ensures that every customer is visited at most once. Constraint set (4) is a weak form of the well-known flow conservation constraints, which require an inflow if there is an outflow, and accommodates the VRP variants in which the vehicle does not have to return to its depot. Constraints (5) provide the connectivity between the origin depot of vehicle k and the customers visited by this vehicle, and constraints (6) dictate the vehicle to return to its depot if it is required to. Constraints (7) state that each vehicle can be used at most once, whereas the backhaul constraint is enforced by constraint (8). Next, we present the constraints that set the customer requirements. The flow conservation for the pickup commodity is provided by constraints (9) and (10). Similarly, the flow conservation for the delivery commodity is provided by constraints (11) and (12). Constraints (13) are formulated based on the MillerTucker-Zemlin subtour elimination constraints [25] and provide the framework for the time windows. The lower and upper limits of the time window for each customer, and the variable to account for violation are stated in constraints (14) and (15). The final set of constraints state the restrictions related to vehicles. Constraints (16) and (17) set the start of the working time for vehicle k, and ensures that the vehicle returns to its depot on time if it is required to. Constraint (18)
19
prohibit the violation of the vehicle capacities. Constraints (19), (20), and (21) state the distance, driving time, and working time limits for each vehicle, respectively. Finally, constraints (22) – (26) are integrality and nonnegativity constraints. To the best of our knowledge, there has not been any attempts to formulate a VRP with all the constraints stated above. Although the formulation can be solved to optimality only for small instances, it defines the problem precisely, demonstrates its complexity, and will serve as a reference formulation for the future studies on the VRP. Next, we provide our algorithm to solve this formulation. 5.2. Pseudocode of the solution algorithm We have opted to implement a variant of the Adaptive Large Neighbourhood Search of [29] within VRP Spreadsheet Solver, due to its flexibility to accommodate many variants of the VRP. The algorithm diversifies the search by randomly removing customers from the solution at hand, and intensifies through re-insertion of the customers and local search. A high level pseudocode is provided below, named as Algorithm 1. Four local search operators have been utilized in Algorithm 1, namely EXCHANGE, 1-OPT, 2-OPT, and VEHICLE-EXCHANGE. The EXCHANGE operator searches all possible pairs of customers in a given solution and checks if exchanging them would result in a better objective function value. The operator 1-OPT examines the possibility of removing every customer within a given solution and re-inserting it to a different position within the routes to improve the objective value. The 2-OPT operator attempts to remove two arcs from the solution at a time, e.g. the arc from customer a to customer b and the arc from customer c to customer d. To retain feasibility, it then adds the arc from customer a to customer d and the arc from customer c to customer b, and checks if the resulting solution has a better objective value. All three operators described so far have a neighborhood size of O(|V |2 ), and we refer the interested reader to the review by [17] for their details. The operator VEHICLE-EXCHANGE 20
Algorithm 1 LNS algorithm implemented within VRP Spreadsheet Solver 1: procedure LNS(depots, customers, distances, durations, vehicles) 2: Construct an incumbent solution by adding customers to the routes, choosing the customer that results in the maximal profit increase (equivalently, minimal cost increase) at every step 3: Improve the incumbent solution using local search with the EXCHANGE, 1-OPT, 2OPT, and VEHICLE-EXCHANGE operators 4: Record the incumbent solution as the best known solution 5: repeat 6:
Destroy the incumbent solution by randomly removing vertices
7:
Repair the incumbent solution heuristically by adding vertices
8:
Improve the incumbent solution using local search with the EXCHANGE, 1-OPT, 2-OPT, and VEHICLE-EXCHANGE operators
9: 10: 11: 12:
if the incumbent solution is better than the best known solution then Record the incumbent solution as the best known solution else Replace the incumbent solution by the best known solution with probability p
13: until time elapsed is larger than the CPU time allowed 14: return best known solution 15: end LNS
attempts to exchange all the customers in the routes of two vehicles with different types, has a neighborhood size of O(|K|2 ), and is particularly useful for the case of heterogeneous fleets. Two constructive heuristics are employed in step 7 are greedy insertion and max regret. The latter heuristic is based on selecting the customer, for which the difference between the cost of the cheapest insertion and the second cheapest insertion decisions is the largest. Both heuristics are chosen with equal probability at each iteration. Each heuristic finds a number of best candidates (a parameter set by the algorithm) and chooses randomly among them at each step. The probability p of rejecting an incumbent solution is set at 10% in the beginning and decreases linearly with time to reach 0% at the end of the CPU time allowance.
21
5.3. Handling infeasibility Infeasibility of a solution refers to the case when one or more constraints are violated by a solution, whereas infeasibility of an instance refers to the case when it is not possible to find any feasible solution for the instance. Infeasibility is a common occurrence in the field of algorithm development. However, a software package that returns an infeasibility message with no suggestions for remedial action is of little use to a practitioner, and the computer (or real) time spent waiting for the result is perceived as wasted time. Mathematically, a solution is either feasible or infeasible, and there is no comparison between two infeasible solutions. However, many solutions that would be declared infeasible by a computer could be useful in practice. For example, an infeasible solution with a single route exceeding the capacity of the vehicle by a fraction of the vehicle capacity can be converted into a feasible one by renegotiating the delivery amount with a customer on the route. Similarly, a vehicle exceeding the working time limit can be made feasible by paying the driver for the extra time. As a consequence, all solutions may be infeasible but in practice, some are less infeasible. This gives rise to the need of a method of penalizing infeasibility based on its severity. An intuitive way of penalizing infeasibility is to include it into the objective function with a penalty coefficient. Let us denote the capacity of a vehicle in a homogeneous fleet by Q, the capacity required for route to be Q′ , and the penalty coefficient to be a large constant M . We then need to include a penalty term of max{Q′ − Q, 0} × M to the objective function to ensure that violating the capacity constraint will be penalized. However, minimizing this term does not necessarily make the resulting solution useful. Consider the case with k vehicles of capacity Q, and a a number of customers with a total demand of (k + 1) × Q. In this case, the penalty value of a solution with the first vehicle containing 2Q units and the rest of the vehicles containing Q units is equal to the penalty value of a second solution with all vehicles carrying Q + 1 units. However, many practitioners would find the latter solution to be more useful, since there is a smaller degree of modification required on each vehicle route. 22
The only hard constraint within the solution algorithm of VRP Spreadsheet Solver is to visit customers that must be visited, and this constraint is enforced on all solutions throughout the algorithm. The rest of the constraints are all treated as soft constraints, and their violations are penalized. To prioritize infeasible solutions with less severe violations, the solution algorithm uses a quadratic scaling method for the penalty. Following the example in the previous paragraph, the penalty term for a vehicle would be (max{Q′ − Q, 0}/Q)2 × M . As a result, a violation of the capacity constraint by 5% of the capacity would be penalized by 0.0025×M whereas a violation of 10% would be penalized by 0.01×M . Similar formulas apply for the violation of the time windows, distance limit, driving time limit, and working time limit. The solver component of VRP Spreadsheet Solver first performs a feasibility check of the data and searches for possible reasons of infeasibility. The search entails customers that must be visited but cannot be reached or serviced by any vehicle within the given time limit, as well as pickup / delivery amounts that cannot fit in any of the vehicle types. It also compares the overall carrying capacity of the fleet to the total pickup / delivery requirement of the customers. If any of these issues are found, the user is alerted with a message, and given a choice to stop or proceed. If the user decides to proceed, the resulting solution will certainly be infeasible but may still be useful. 5.4. Computational results on benchmark instances Before presenting our computational results on benchmark instances, we would like to make a brief comparison of the computational tests carried out in the routing literature and the use of VRP optimization software in practice. The academic studies are usually run on a state-of-the art computer dedicated to the task, with the algorithms coded in C++. Additionally, the academic studies limit the CPU time by restricting the algorithm a number of iterations, which may result in different CPU times on different computers. On the other hand, a practitioner is more likely to run the VRP optimization algorithm on an ordinary laptop computer, possibly with other programs running in the back23
ground. Furthermore, a practitioner will need a solution in a given amount of time, since the output of the software will be an input of the decision process rather than its result. We also would like to emphasize that the speed of VBA is orders of magnitude lower than that of C++. To the best of our knowledge, there is no academic source that provides a speed comparison, so we have performed the following small experiment. We have created an array of integers with 10000 elements, and we have filled this array with ⌊U [0, 1] ∗ 1000⌋, and repeated this process 10000 times. On the average of 10 runs of this small program, C++ implementation of this small program has taken 1.56 seconds, whereas the VBA implementation has required 4.20 seconds, approximately 2.7 times that of C++. In terms of memory management and pointers, C++ is known to be very efficient, the importance of which is realized for problems with large memory requirements and results in larger performance deviations. Based on the reasons stated above, we have decided to test the solution algorithm using a laptop computer with an Intel i7 CPU running at 2.5 GHz with 8 GB of RAM, a configuration that would reflect the computers used in practice. We have set the CPU time limit for the solution algorithm VRP Spreadsheet Solver to 15 minutes for instances with 50 customers, and increased it linearly with the number of customers for larger instances. We do not claim that a single algorithm can solve all the variants of the VRP to near-optimality, and we believe that a computational experiment to solve all existing variants is beyond the scope of this paper. Hence, we have opted to use the well-known and widely used benchmark data set by [5] that contains two of the main variants of the VRP, the Capacitated VRP and the Distance Constrained VRP. The computational results are provided in Table 1 and show that the algorithm performs very well for up to 100 customers, and returns acceptable results for larger instances. The performance of the algorithm is better for instances with a distance constraint, due to the reduced search space. The performance is slightly degraded for the last four instances, which consist of artificially constructed clusters of customers. We recommend a larger CPU time allowance for 24
Table 1: Computational results on benchmark instances Instance
Number of
Fleet
Vehicle
Distance
Best known
name
customers
size
capacity
limit
solution value
Average
VRP Spreadsheet Solver Average gap
Best
vrpnc1
50
5
160
N/A
524.61
524.61
0.00%
524.61
0.00%
vrpnc2
75
10
140
N/A
835.26
840.67
0.65%
835.26
0.00%
vrpnc3
100
8
200
N/A
826.14
841.05
1.80%
831.28
0.62%
vrpnc4
150
12
200
N/A
1028.42
1052.22
2.31%
1040.81
1.20%
vrpnc5
199
17
200
N/A
1291.29
1341.19
3.86%
1323.08
2.46%
vrpnc6
50
6
160
200
555.43
556.77
0.24%
555.43
0.00%
vrpnc7
75
11
140
160
909.68
913.13
0.38%
909.68
0.00%
vrpnc8
100
9
200
230
865.94
876.40
1.21%
865.94
0.00%
vrpnc9
150
14
200
200
1162.55
1181.77
1.65%
1170.81
0.71%
vrpnc10
199
18
200
200
1395.85
1435.27
2.82%
1415.02
1.37%
vrpnc11
120
7
200
N/A
1042.11
1047.82
0.55%
1047.61
0.53%
vrpnc12
100
10
200
N/A
819.56
821.29
0.21%
821.29
0.21%
vrpnc13
120
11
200
720
1541.14
1565.01
1.55%
1554.51
0.87%
vrpnc14
100
11
200
1040
866.37
886.41
2.31%
869.96
0.41%
such instances. A copy of VRP Spreadsheet Solver containing a real-world Pickup-andDelivery VRP instance with 27 customer locations has been made available for researchers to verify the solution algorithm and use the instance as a benchmark for future studies [11]. As a final note, we would like to state that we welcome contributions from the researchers developing algorithms for the VRP, in the form of DLL files containing their solution algorithms. Contributed implementations will be hosted online jointly with VRP Spreadsheet Solver, with the full credit of each DLL file being attributed to the researchers who contributed it.
6. Concluding remarks In this paper, we have introduced VRP Spreadsheet Solver, an open source spreadsheet solver for the VRP and its many variants. We have demonstrated its realized and potential benefits on two case studies, one from the healthcare sector and the other one from the tourism sector. We have shown the performance of the solution algorithm on a set of benchmark instances from the literature. We believe that VRP Spreadsheet Solver has the potential to be
25
Best gap
used throughout the world due to its ease of use, flexibility, and accessibility, and achieve savings for many SMEs as well as CO2 emissions. Any decision support tool should be able to generate alternative solutions for the decision maker. VRP Spreadsheet Solver currently returns and displays a single solution, for the sake of simplicity. As future work, we plan to add a parameter for the number of alternative solutions required by the user, record the corresponding number of best solutions encountered during the solver run, and return the results. Acknowledgment: We thank Maria Battarra for her constructive comments on a draft of this paper. Thanks are also due to the two anonymous reviewers, whose comments have helped to improve the paper.
References [1] J. L. Andrade-Pineda, P. L. Gonzalez-R, J. M. Framinan, A decisionmaking tool for a regional network of clinical laboratories, Interfaces 43 (4) (2013) 360–372. [2] R. Baldacci, A. Mingozzi, R. Roberti, New route relaxation and pricing strategies for the vehicle routing problem, Operations Research 59 (5) (2011) 1269–1283. [3] T. Bekta¸s, S. Elmasta¸s, Solving school bus routing problems through integer programming, Journal of the Operational Research Society 58 (12) (2007) 1599–1604. [4] O. Br¨ aysy, G. Hasle, Software tools and emerging technologies for vehicle routing and intermodal transportation, in: P. Toth, D. Vigo (Eds.), Vehicle Routing: Problems, Methods, and Applications, vol. 18, SIAM, 351–380, 2014. [5] N. Christofides, A. Mingozzi, P. Toth, Exact algorithms for the vehicle routing problem, based on spanning tree and shortest path relaxations, Mathematical Programming 20 (1) (1981) 255–282. 26
[6] G. Clarke, J. W. Wright, Scheduling of vehicles from a central depot to a number of delivery points, Operations Research 12 (4) (1964) 568–581. [7] F. G. S¸ahinyazan, B. Y. Kara, M. R. Taner, Selective vehicle routing for a mobile blood donation system, European Journal of Operational Research 245 (1) (2015) 22 – 34. [8] G. B. Dantzig, J. H. Ramser, The truck dispatching problem, Management Science 6 (1) (1959) 80–91. [9] E. Demir, T. V. Woensel, T. de Kok, Multidepot distribution planning at logistics service provider nabuurs b.v., Interfaces 44 (6) (2014) 591–604. [10] R. Eglese, T. Bekta¸s, Green vehicle routing, in: P. Toth, D. Vigo (Eds.), Vehicle Routing: Problems, Methods, and Applications, vol. 18, SIAM, 437–458, 2014. [11] G. Erdoˇgan, Glasgow Bike Share – Rebalancing Problem, Data in Brief Submitted. [12] G. Erdoˇgan, VRP Spreadsheet Solver, available for download at http://verolog.deis.unibo.it/vrp-spreadsheet-solver, 2013. [13] S. Erdoˇgan, E. Miller-Hooks, A green vehicle routing problem, Transportation Research Part E: Logistics and Transportation Review 48 (1) (2012) 100 – 114. [14] I. A. Forma, T. Raviv, M. Tzur, A 3-step math heuristic for the static repositioning problem in bike-sharing systems, Transportation Research Part B: Methodological 71 (2015) 230–247. [15] D. Gavalas, C. Konstantopoulos, K. Mastakas, G. Pantziou, A survey on algorithmic approaches for solving tourist trip design problems, Journal of Heuristics 20 (3) (2014) 291–328. [16] C. Gro¨er, B. Golden, E. Wasil, The consistent vehicle routing problem, Manufacturing & Service Operations Management 11 (4) (2009) 630–643. 27
[17] C. Gro¨er, B. Golden, E. Wasil, A library of local search heuristics for the vehicle routing problem, Mathematical Programming Computation 2 (2) (2010) 79–101. [18] V. C. Hemmelmayr, K. F. Doerner, R. F. Hartl, D. Vigo, Models and algorithms for the integrated planning of bin allocation and vehicle routing in solid waste management, Transportation Science 48 (1) (2014) 103–120. [19] R. Hesse, D. H. Scerno, How electronic spreadsheets changed the world, Interfaces 39 (2) (2009) 159–167. [20] G. Hiermann, J. Puchinger, S. Ropke, R. F. Hartl, The electric fleet size and mix vehicle routing problem with time windows and recharging stations, European Journal of Operational Research 252 (3) (2016) 995–1018. [21] M. Huang, K. R. Smilowitz, B. B. k, A continuous approximation approach for assessment routing in disaster relief, Transportation Research Part B: Methodological 50 (2013) 20 – 41. [22] G. Laporte, Fifty years of vehicle routing, Transportation Science 43 (4) (2009) 408–416. [23] R. Liu, Z. Jiang, The close-open mixed vehicle routing problem, European Journal of Operational Research 220 (2) (2012) 349–360. [24] D. S. Mankowska, F. Meisel, C. Bierwirth, The home health care routing and scheduling problem with interdependent services, Health Care Management Science 17 (1) (2014) 15–30. [25] C. E. Miller, A. W. Tucker, R. A. Zemlin, Integer programming formulation of traveling salesman problems, Journal of the ACM 7 (4) (1960) 326–329. [26] A. Nerg, K. Stuckenschneider, Domestic Disasters and Geospatial Technology for the Defense Logistics Agency, MBA thesis, Naval Postgraduate School, Monterey, California, 2014.
28
¨ [27] L. Ozdamar, O. Demir, A hierarchical clustering and routing procedure for large scale disaster relief logistics planning, Transportation Research Part E: Logistics and Transportation Review 48 (3) (2012) 591 – 602. [28] J. Partyka, R. Hall, Vehicle routing software survey: VR delivers the goods, OR/MS Today 41 (2014) 40–46. [29] D. Pisinger, S. Ropke, A general heuristic for vehicle routing problems, Computers & Operations Research 34 (8) (2007) 2403 – 2435. [30] P. Schittekat, K. S¨ orensen, OR practice–supporting 3PL decisions in the automotive industry by generating diverse solutions to a large-scale locationrouting problem, Operations Research 57 (5) (2009) 1058–1067. [31] A. Subramanian, L. M. A. Drummond, C. Bentes, L. S. Ochi, R. Farias, A parallel heuristic for the vehicle routing problem with simultaneous pickup and delivery, Computers & Operations Research 37 (11) (2010) 1899–1911. [32] P. Toth, D. Vigo, Vehicle routing: problems, methods, and applications, vol. 18, SIAM, 2014. [33] N. L. Van Wassenhove, Humanitarian aid logistics: supply chain management in high gear, Journal of the Operational Research Society 57 (5) (2006) 475–489. [34] T. Vidal, T. G. Crainic, M. Gendreau, C. Prins, A unified solution framework for multi-attribute vehicle routing problems, European Journal of Operational Research 234 (3) (2014) 658 – 673. [35] X. Wang, M. Battarra, B. Golden, E. Wasil, Vehicle routing and scheduling, in: D. Teodorovic (Ed.), The Routledge Handbook of Transportation, Routledge, London, U. K., 238–256, 2015. [36] J. Yi, Vehicle routing with time windows and time-dependent rewards: A problem from the american red cross, Manufacturing & Service Operations Management 5 (1) (2003) 74–77. 29