AN OPTIMAL CONTROL THEORY-BASED FRAMEWORK FOR SUPPLY CHAIN RESILIENCE P. Seferlis1, D. Vlachos2, E. Iakovou2, A. Xanthopoulos2 1. Laboratory of Machine Dynamics, Department of Mechanical Engineering, Aristotle University of Thessaloniki,
[email protected] 2. Laboratory of Quantitative Analysis, Logistics and Supply Chain Management, Department of Mechanical Engineering, Aristotle University of Thessaloniki, {vlachos1, eiakovou, axanthop}@auth.gr
ABSTRACT Modern supply chains need to be agile and flexible enough so that they can be responsive to sources of variability and unpredictability, such as, demand fluctuations, supply and transportation disruptions and lengthy and variable order lead times. At the core of the appropriate response to this challenge, resides the effective collaboration among all stakeholders of the extended enterprise; this is further realized though the proper supply chain contractual agreements, information sharing and a system-wide cost and profitability optimization paradigm. In this manuscript, we present a control theory-based optimization framework that can be employed at an operational level, determining the optimal policy for multi-product, multi-echelon supply chain network resilience. The decision variables include production rates, transportation loads, and product inventory levels. The objective function is the minimization of total supply chain cost over a specified rolling time horizon subject to production, storage and transportation capacities and service (fill-rate) constraints. Having selected a suitable, based on the dynamics of the supply chain, time interval, a detailed difference model is utilized for the prediction of the dynamic behavior of the system. In addition, a stochastic model is used for the forecast of future product demand variation based on the calculated prediction error at each time period. The response of the system to abrupt demand changes and to disruptions in production and transportation is investigated and analyzed. This analysis quantifies the impact of system shocks such as changes and disruptions, while further providing useful managerial insights for improving the resiliency of the entire supply chain. KEYWORDS: SUPPLY CHAIN RESILIENCE, MODEL PREDICTIVE CONTROL, OPTIMIZATION 1. INTRODUCTION As companies throughout all industries continue to globalize their operations and outsource significant portion of their value chain activities, they often end up relying heavily on order replenishments from distant suppliers. The explosion in long distance sourcing and supply is exposing supply chains and shareholder value at ever increasing risks including operational and disruption risks. Typical operational risks include quality problems, congested facilities, energy and infrastructure issues, equipment failures etc., while commonly encountered disruption risks include natural or man-made disasters such as earthquakes, floods, hurricanes, epidemics, terrorist attacks, industrial accidents, labor strikes, etc. These trends have placed enormous pressures on supply chains; companies that cannot meet these challenges are facing tremendous difficulties within the confines of the new economy as the failure to do so results in severe corrosion of shareholder value. Proceedings of the 3rd International Conference on Manufacturing Engineering (ICMEN), 1-3 October 2008, Chalkidiki, Greece Edited by Prof. K.-D. Bouzakis, Director of the Laboratory for Machine Tools and Manufacturing Engineering (ΕΕΔΜ), Aristoteles University of Thessaloniki and of the Fraunhofer Project Center Coatings in Manufacturing (PCCM), a joint initiative by Fraunhofer-Gesellschaft and Centre for Research and Technology Hellas, Published by: ΕΕΔΜ and PCCM
811
It is well established, both in academia and in real-world business environments that resource flexibility is advantageous for firms that are susceptible to various modes of disruption (i.e. supply, transportation, facilities, freight, communications, and demand disruptions /1/). However, companies have traditionally relied on static planning approaches developed for low variability and low risk environments. The reliance on these traditional approaches and the absence of any additional planning in dealing with risks and thus increasing the resilience of a supply chain has often led to the suboptimal performance for the entire supply chain system. Recent trends in managing global supply chain risks focus on the development of robust (effective performance for a range of operations risks) and resilient (quick to recover from disruption) supply chain systems. However, there is still a clear lack of contingency strategic policies and the appropriate analytical methodologies for the determination of their optimal parameters, when considering the different modes of disruptions in a supply chain. The most common type of disruption appearing in the literature is that of production or supply rate changes. One of the first relevant quantitative efforts is that of Moinzadeh and Aggarwal /2/ that considered an (s,S) policy for a constant production and demand rate system with random disruptions in a bottleneck production facility in which supply could be randomly disrupted and the disruption lasts a random period. In parallel, Parlar /3/ considered random supply disruptions with stochastic demand and lead-time in a continuous review inventory system, while supplier availability is modeled as a semi-Markov process. Next, Arreola-Risa and DeCroix /4/ considered a stochastic (s,S) inventory system in which supply could be randomly disrupted and the disruption lasts a random period. This paper considers partial backorders – that is scenarios in which some customer orders may wait as backorders, while others lead to lost sales. Xia et al. /5/, developed a deterministic EOQ-type inventory control model for a two-stage supply chain that is susceptible to several types of production- and demand-related disruptions. More recently, Xiao and Yu /6/ introduced an indirect evolutionary game model with two-vertically integrated channels to study stable strategies in the duopoly situation. Their recovery model captures the impact of raw material supply disruptions on the retailers’ strategies and on the average profits of channels. Furthermore, Xiao and Qi /7/, investigated a one supplier–two competing retailers supply chain that experiences a disruption in cost and demand during a single period. Appropriate quantitative conditions are derived that indicate when the maximum profit can be achieved once a disruption in the original production plan occurs. Investigating other disruption inventory management approaches, Golany et al. /8/ proposed a general approach, based on a three-level lexicographical goal-programming formulation, to address various types of disruptions. A penalty cost for deviations from the original production and inventory plan is accommodated and the concept of a disruption recovery time window is addressed. Snyder et al. /9/ developed a broad range of facility location models for designing supply chain networks that are resilient to disruptions. Furthermore, Wu et al. /10/ presented a Petri network-based methodology approach to determine how disruptions disseminate in supply chains (similar to the well-known bullwhip effect) and the attributes of their impact. Wilson /11/ developed a system dynamics simulation model, in order to investigate the impact of a transportation disruption between two echelons, on supply chain performance by comparing a simple supply chain with a vendor managed inventory system. Finally, a comprehensive literature review on the supply chain risk and disruption management models is provided by Tang /12/. In this research we propose a control theory-based optimization framework that can be employed at an operational level, determining the optimal policy for multi-product, multi-echelon supply chain networks. The decision variables include production rates, transportation loads, and product inventory levels. The objective function is the minimization of total supply chain cost over a specified rolling time horizon subject to production, storage and transportation capacities and service (fill-rate) constraints. Rolling horizon decision making is a common business practice in a dynamic environment for efficiency and practicality (Chand et al. /13/ for a classified bibliography of the literature). Under a rolling-horizon procedure, at the beginning of the first period, a fixed-period problem is solved based on the current state (e.g., inventory/backlog in production-planning problems) and the forecasted data for an appropriately chosen period. Only the
812
3rd ICMEN – 2008
current period’s decisions become firm. One period later, at the beginning of the second period, the problem state is observed and the forecasts for future periods are updated. A new problem with the same horizon length is solved at the beginning of period two, and the second period’s decisions become firm. This procedure is repeated every period, and the horizon gets ‘‘rolled over’’ each period. The number of periods included in the finite-horizon problem is known as study horizon. (Bean et al. /14/). Having selected a suitable, based on the dynamics of the supply chain, time interval, a detailed difference model is utilized for the prediction of the dynamic behavior of the system. In addition, a stochastic model is used for the forecast of future product demand variation based on the calculated prediction error at each time period. The response of the system to abrupt demand changes and to disruptions in production and transportation is investigated and analyzed. This analysis quantifies the impact of system shocks such as changes and disruptions, while additionally providing useful managerial insights for improving the resiliency of the entire supply chain. The rest of the paper is organized as follows. The supply chain under study and the proposed quantitative model are presented in Section 2, while the predictive control strategy is discussed in Section 3. Section 4 presents the results of implementing the model on a realistic supply chain setting. In the same section we also discuss few significant managerial insights stemming from the model implementation. Conclusions and directions for future research are presented in section 5. 2. SUPPLY CHAIN MODEL Following the formulation in Seferlis and Giannelos /15/, let DP denote the set of products in the supply chain. These are manufactured at P plants, utilizing various resources, RS. In the present study, manufacturing employs independent production lines for the manufactured products. The products are subsequently transported to and stored at distribution centers, D. Products from distribution centers are transported upon customer demand, either to wholesalers, W, or directly to retailers, R. Retailers receive time-varying orders from different customers for each product. Satisfaction of customer demand and minimization of supply chain network costs are the primary targets of the system. Unsatisfied demand is recorded as back-orders for the next time period. A discrete time difference model is used to describe the supply chain network dynamics. It is assumed that decisions are taken within equally spaced time periods (e.g. weeks). The duration of the base time period depends on the dynamic characteristics of the network. As a result, dynamics of higher frequency than that of the selected time-scale are considered negligible and are completely omitted by the network. Plants P, distribution centers D, wholesalers W, and retailers R constitute the nodes of the system. For each node, k, there is a set of upstream (predecessor) nodes, indexed by k′, which can supply node k. There is also a set of downstream (successor) nodes, indexed by k ′′ , which can be supplied by k. All valid (k′,k) and/or (k, k ′′ ) pairs constitute permissible routes within the network. All variables in the supply chain network (e.g., product inventories, transportation loads) are assumed to be continuous. This is definitely valid for bulk commodities and products. For unit products, continuous variables can still be utilized, with the addition of a post-processing rounding step to identify neighboring integer solutions. This approach, though clearly not optimal, may be necessary to retain computational tractability in systems of industrial relevance. A product balance around any network node involves the inventory level in the node at time instances t and t-1, as well as the total inflow of products from upstream nodes and total outflow to downstream nodes. The following balance equation is valid for nodes that are either warehouses or distribution centers:
y i ,k (t ) = y i ,k (t − 1) + ∑ x i ,k ′,k (t − Lk ′,k ) − ∑ x i ,k ,k ′′ (t ) k′
Logistics in Manufacturing
k ′′
∀ k ∈ {D,W }, t ∈ T , i ∈ DP ,
(1)
813
where yi,k is the inventory of product i stored in node k , x i ,k ′,k is the amount of the i-th product transported through route (k′,k) and Lk ′,k is the lead time for the ordered products. Lead time includes the production time, when employed to orders placed at plant nodes, and the transportation lag (delay time) for route (k′,k), i.e. the required time periods for the transfer of material from the supplying node to the receiving node. Lead-time is assumed to be an integer multiple of the base time period and independent of the size of the order as product manufacturing is solely limited by resource constraints. For retailer nodes, the inventory balance is slightly modified to account for the actual delivery of the i-th product attained, denoted by di,k:
y i ,k (t ) = y i ,k (t − 1) + ∑ x i ,k ′,k (t − Lk ′,k ) − d i ,k (t ) k′
∀ k ∈ R , t ∈ T , i ∈ DP
(2)
The amount of unsatisfied demand is recorded as back-orders for each product and time period. Hence, the balance equation for back-orders takes the following form:
BOi ,k (t ) = BOi ,k (t − 1) + R i ,k (t ) − d i ,k (t ) − LOi ,k (t )
∀ k ∈ R , t ∈ T , i ∈ DP ,
(3)
where Ri,k(t) is the demand for the i-th product at the k-th retailer node and time period t, LOi,k(t) is the amount of cancelled back-orders (lost orders) because the supply chain network failed to satisfy them within a reasonable time limit. Lost orders are usually expressed as a percentage of unsatisfied demand at time t. A reasonable simplification assumes that unsatisfied demand at any given time period is lost for the network, i.e., BOi ,k (t − 1) = LOi ,k (t ) . At each node capable of carrying inventory (nodes of type D, W, and R), capacity constraints are in effect that account for a maximum allowable inventory level:
∑ vs y (t ) ≤ V i
i
i ,k
max k
∀ k ∈ {W , D, R}, t ∈ T ,
(4)
where yi,k is the inventory of the i-th product in the k-th node, vsi is the storage volume factor for the i-th product, and Vkmax is the total volumetric capacity of the k-th node. Similarly, a maximum allowable transportation capacity is defined for each permissible transportation route within the supply chain network:
∑ vt x i
i
i ,k ,k ′′
(t ) ≤ Tkmax ,k ′′
∀ k ∈ {P ,W , D}, t ∈ T ,
(5)
where vti is the transportation volume factor for each product, and Tkmax is the maximum allow,k ′′ able transportation volume for the route. Each plant is assumed to operate with independent production lines for each product or product family, thus allowing the simultaneous production of any combination of products at any given time period. However, the individual production lines may share common resources. In each plant, k, and for each manufacturing resource, j, a maximum level of availability is in effect as expressed by:
∑∑ κ i
k ′′
i,j
x i ,k ,k ′′ (t ) ≤ C max j ,k
∀ k ∈ P , t ∈ T , j ∈ RS ,
(6)
where κ i , j is the utilization factor of the j-th resource for the i-th product and C mum availability of the i-th resource.
814
max j ,k
is the maxi-
3rd ICMEN – 2008
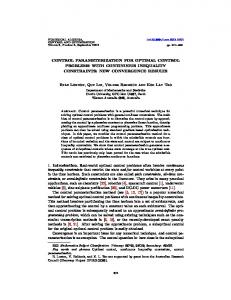
3. MODEL PREDICTIVE CONTROL STRATEGY FOR SUPPLY CHAIN MANAGEMENT Supply chain management involves a number of decisions to be taken at every time period to meet end-customer requirements. The overall supply chain performance is multi-dimensional and directly or indirectly affected by a number of factors, such as service quality and overall operating costs. Provided that these factors are generally competing with each other, trade-offs and compromises are necessary to achieve the best performance. The flows of products along permissible routes connecting successive echelons correspond to the ordering amounts being directed to the retailer nodes. Inventories at the nodes of the network serve as safety stock to handle the stochastic variation of demand, anticipate for lead time in ordered quantities and compensate for abrupt shocks (e.g., damaged products during transportation or bad storage conditions, delays in lead times) that would otherwise disrupt the smooth supply of products. The associated transportation costs, inventory costs (assets directed in the production of the inventory), storage costs (operating costs of warehouse facilities and cost from anticipated damage of product while stored) are weighed against customer demand satisfaction (service level). Supply chain management is performed within an optimization based model predictive control framework as shown in Figure 1. Such a scheme considers the entire network dynamics, incorporates the future impact of past actions and calculates the inventory levels, the distribution of products in the network that optimize a given performance index for the system over a specified time horizon. The control system aims at operating the supply chain at the optimal point despite the influence of demand uncertainty. The control system is required to possess built-in capabilities to recognize the optimal operating policy through meaningful and descriptive cost performance indicators and mechanisms to successfully alleviate the detrimental effects of demand uncertainty and variability. The main objectives of the supply chain network include the maximization of (i) customer demand satisfaction, and, minimize (ii) supply chain service costs. The first target is attained through the minimization of back-orders over a period of time, while the second target is achieved through the minimization of the network costs. Desired trajectory ek+21
Predicted trajectory Rolling time horizon
tk-2
tk-1
Past control actions
uk-2
uk-1
tk
tk+1
tk+2
tk+3
tk+4
Calculated control actions
uk
uk+1
uk+2
uk+3
Figure 1: Schematic of the Predictive Control Modeling Framework
Based on the fact that past and present actions affect the future response of the system, a rolling time horizon is selected. Over the specified rolling time horizon the future behavior of the supply chain is predicted using the described difference model (Eq 1-6). In this model, the state variables are the product inventory levels at the storage nodes, y, and the back-orders, BO, at
Logistics in Manufacturing
815
the order receiving nodes. The manipulated (control or decision) variables are the product quantities transferred through the network’s permissible routes, x. Finally, the product back-orders, BO, and subsequently delivered products, d, are matched to the output variables. At each time period the first control action in the calculated sequence over the time horizon is implemented. The effect of unmeasured demand disturbances and model mismatch is computed through comparison of the actual current demand value and the prediction from a stochastic disturbance model for the demand variability. The difference that describes the overall demand uncertainty and system variability is fed back into the model-predictive control scheme at each time period. Therefore, the model incorporates the model discrepancy for the calculation of the next optimal sequence of actions. The mathematical formulation of the objective function considering back-orders, transportation and inventory costs simultaneously over the specified time horizon, th, takes the following form:
J=
t +th
∑ ∑{ } ∑ {w t
+
k∈ R
i
t +th
BO ,i ,k
∑ {∑ } ∑ {w
(BO (t ))} + ∑ ∑ ∑ {w { }
t +Th t
k ∈ W ,D ,R i ∈DP
Δx ,i ,k ′ ,k
i ,k
(x
t
k ∈ W ,D ,R
i
i ,k ′ ,k (t ) − x i ,k ′ ,k (t − 1))
2
}
T ,i ,k ′ ,k
(x
t +th
i ,k ′ ,k
(t ))} + ∑ ∑ ∑ {w Y ,i ,k ′,k (y i ,k (t ))} t
k ∈{W ,D ,R } i
(7)
The function J encompasses a term accounting for the network revenues, a term penalizing back-orders at all retailer nodes, two terms accounting for the transportation and inventory costs, and a quadratic term that penalizes changes between successive time periods in the distributed products along the transportation routes. The weighting factors, wY ,i ,k reflect the inventory storage costs and inventory assets per unit product, wx ,i ,k ′ ,k account for the transportation cost per unit product for route (k′,k), wBO ,i ,k correspond to the penalty imposed on unsatisfied demand and are estimated based on the impact service level has on the company reputation and future demand and wΔx ,i ,k ′ ,k , are associated with the penalty on the rate of change for the transported amount of the i-th product through route (k′,k). Such a term tends to eliminate abrupt and aggressive control actions and subsequently, safeguard the network from saturation of transportation routes and undesired excessive variability in the transported products induced by sudden demand changes. In addition, transportation activities are usually preferred to resume a somewhat constant level rather than fluctuate from one time period to another. The implementation of the move suppression term would affect control performance leading to a more sluggish dynamic response to shocks affecting the system. Even though, factors w Y ,i ,k , w T ,i ,k ′,k and
w BO ,i ,k are cost related that can be estimated with a relatively good accuracy, factors w Δx ,i ,k ′,k are judged and selected mainly on grounds of desirable achieved performance and variability manipulation. The weighting factors in Eq 7 also reflect the relative importance between the controlled (back-orders and inventories) and manipulated (transported products) variables. The overall supply chain management problem schematically shown in Figure 2 thus takes the following form:
Min J
p , x , y , ysp
s.t. Supply chain model Eq (1) − (6)
(8)
ARIMA demand model At each time period the calculated optimal decision control variables are implemented and the actual demand and back-orders are recorded. Forecast equations employing a stochastic ARIMA model for the product demand that is identified from historical demand data calculate the forecasts for future product demand over the entire span of the rolling horizon.
816
3rd ICMEN – 2008
4. NUMERICAL EXPERIMENTATION A number of simulated cases have been explored and analyzed for their performance in compensating abrupt shocks in the supply chain. The test-case supply chain for two product families consists of 2 plants, 2 distribution centers, 2 wholesalers and 4 retailers. Table 1 shows the objective function weighting factors, the constraints and the lead times for the supply chain. Optimization-based Predictive Decision Framework Information about state of supply chain
Calculated optimal supply routes and inventories
Wholesalers,
Retailers, R Orders
Distribution Centers, D
Plants, P
Delivered
Figure 2: Schematic of the Optimization-based Predictive Decision Framework Table 1: Supply chain data. Max inventory level Max product inventory setpoint Transportation cost (also used in the move suppression term)
Distribution Center 250 40
Wholesaler 150 20
Retailer 80 10
Plant to Distribution center
Distribution Center to Wholesalers
Wholesalers to Retailer
⎡0 . 5 2 . 0 ⎤ ⎢ 2 .0 0 . 5 ⎥ ⎣ ⎦
⎡0.5 2.0⎤ ⎢ 2 .0 0 . 5 ⎥ ⎣ ⎦
⎡0.5 0.5 2.0 2.0⎤ ⎢ 2 .0 2 .0 0 .5 0 .5 ⎥ ⎣ ⎦
0.2
0.2
0.2
0.01 4 6
0.01 3 5
0.01 10.0 2 4
Inventory weights Move suppression weight (multiplies transportation cost) Back-order weights Lead times Case 1 Lead times Case 2
Simulated Scenario This scenario examines the ability of the supply chain management framework to cope with the
Logistics in Manufacturing
817
reliability of distribution center 1. For ten time periods (between interval 10-20 periods) the supply from distribution center 1 to wholesalers 1 and 2 has been disrupted due to damaged products during transportation (Figure 3). The supply chain management framework reacts with additional product quantity shipments to reduce the build-up of back orders at the retailer nodes. The system utilizes the more expensive route between distribution center 2 and wholesaler 1 to cover part of the lost products. As observed, the supply chain recovers after period 30 when compared to the undisrupted case (dashed lines in Figure 3). Obviously, a higher penalty on back orders would have resulted to heavier utilization of more expensive alternative transportation routes. Back orders increase temporarily (Figure 3b) before they reduce to the level of the undisrupted case. 18
100
16
90 80
Total back orders
Transported amounts
14 12 10 8 6 4
60 50 40 30 20
2 0
70
10 0
10
20
30
40
50
60
70
80
0
0
10
20
Time periods
30
40
50
60
70
80
Time periods
(a)
(b)
Figure 3: (a) Supply lines for products A (solid lines) and B (dashed lines) between distribution center 1 and wholesalers; (b) total recorded back orders for the supply chain (solid lines: disrupted supply; dashed lines: undisrupted supply)
Figure 4 shows the objective function value and the contribution of the individual terms. Inventory costs and the term associated to changes in the transported amounts have very small contribution. Back orders have the largest contribution as service level decreases. Inventory levels in node R1 show the exhaustion of inventories due to the disruption of supply.
5
10000
4
8000
Inventory level
Objective function value
12000
6000 4000
2
1
2000 0 0
3
20
40
Time periods
60
80
0
0
10
20
30
40
50
60
70
80
Time periods
(a) (b) Figure 4: (a) Objective function value (solid line: total objective function value; dotted line: back orders contribution; dashed line: transportation costs); (b) cumulative inventory level for the two products in node R1 – disrupted supply case.
818
3rd ICMEN – 2008
6. CONCLUSIONS Resilience has clearly risen as a key attribute for today’s highly extended globalized supply chains as these are highly susceptible to a wide array of type of disruptions. An optimizationbased framework for enhancing resilience of a supply chain is presented. The proposed framework can be employed on a rolling horizon production planning paradigm. It utilizes a predictive optimal control scheme that calculates future actions in order to minimize total cost over an extended study horizon using predictions for the future behaviour of the supply chain. The application of the proposed methodological framework is demonstrated on a number of simulated cases capturing the effect of a supply disruption in system performance while providing intuitively sound managerial insights. 7.
REFERENCES
1.
Sheffi, Y., Rice Jr, J.B., Caniato, F., Fleck, J., Disraelly, D., Lowtan, D., Lensing , R. and Pickett, C., 2003, Supply Chain Response to Terrorism: Creating Resilient and Secure Supply Chains, Supply Chain Response to Terrorism Project – Interim Report, MIT Center for Transportation and Logistics. Moinzadeh, K. and Aggarwal, P.K., Analysis of a Production/Inventory System subject to Random Disruptions. Management Science, 43 (1997) 1577-1588. Parlar, M., Continuous-Review Inventory Problem with Random Supply Interruptions. European Journal of Operational Research, 99 (1997) 366-385. Arreola-Risa, A. and DeCroix, G.A., Inventory Management under Random Supply Disruptions and Partial Backorders. Naval Research Logistics, 45 (1998) 687-703. Xia, Y., Yang, M.H., Golany, B., Gilbert, S.M. and Yu, G., Real-Time Disruption Management in a Two-Stage Production and Inventory System. IIE Transactions, 36 (2004) 111125. Xiao, T. and Yu, G., Supply Chain Disruption Management and Evolutionarily Stable Strategies of Retailers in the Quantity-Setting Duopoly Situation with Homogeneous Goods. European Journal of Operational Research, 173 (2006) 648-668. Xiao, T. and Qi, X., Price Competition, Cost and Demand Disruptions and Coordination of a Supply Chain with one Manufacturer and Two Competing Retailers. Omega: The International Journal of Management Science, 36(5) (2008) 741-753. Golany, B., Xia, Y., Yang, J. and Yu, G., An Interactive Goal-Programming Procedure for Operational Recovery Problems. Optimization and Engineering, 40 (2002) 959-971. Snyder, L.V., Scaparra, P.M., Daskin, M.S. and Church, R.L., Planning for Disruptions in Supply Chain Networks. Informs, Tutorials in Operations Research, (2005) 1-23. Wu, T., Blackhurst, J. and O’Grady, P., Methodology for supply chain disruption analysis. International Journal of Production Research, 45 (7) (2007) 1665 – 1682. Wilson, M.C., The Impact of Transportation Disruptions on Supply Chain Performance. Transportation Research – Part E, 43(4) (2007) 295-320. Tang, C.S., Perspectives in Supply Chain Risk Management. International Journal of Production Economics, 103 (2006) 451-488. Chand, S., Hsu, V.N., and Sethi, S., Forecast, Solution, and Rolling Horizons in Operations Management Problems: A Classified Bibliography, Manufacturing & Service Operations Management, 4(1) (2002) 25-43. Bean, J., Smith. R.L., and Yano, C, Forecast Horizons for the Discounted Dynamic Lot Size Model Allowing Speculative Motive, Naval Research Logistics, 34 (1987), 761-774. Seferlis P., Giannelos N. F., A two-layered Optimization-based control strategy for multiechelon supply chain networks. Computers & Chemical Engineering, 28 (2004) 799-809.
2. 3. 4. 5.
6.
7.
8. 9. 10. 11. 12. 13.
14. 15.
Logistics in Manufacturing
819
820
3rd ICMEN – 2008