An Optimal Technique for ECG Noise Reduction in Real Time Applications MM Elena, JM Quero, I Borrego University of Seville, Seville, Spain research provides an overview of several estimation techniques, which are measured with the same parameters including threshold value and error figures. In addition, the specialists compared the original ECG signal with each method results visually. It allowed to choose which algorithms best obtains the highest compression ratio while keeping the needed ECG information. Getting higher compression ratios assumes that a large proportion of the samples are zeroed. The Digital Wavelet Transform (DWT) modifies the signal in order to obtain these samples before the codification stage is reached. A balance is established between guaranteeing a minimum noise threshold, to keep redundant information, and increasing it as much as possible to obtain a greater number of null elements in the vector of coefficients of the WT; the proposed threshold achieved here is optimal. We introduced the optimal method SGM, that uses the global universal threshold modified using the standard deviation, to estimate the value and to apply this to the complete wavelet coefficients vector.
Abstract This paper presents a novel and efficient algorithm of ECG compression in real time monitoring systems, updated with each new input signal sample. This algorithm tries to improve the compression ratio of the captured signal by means of an optimal noise threshold in terms of hardware complexity and memory requirements. Threshold estimation is computed, using the instantaneous standard deviation, in order to decrease data sorting and storing resources, and allowing low-cost implementation in portable electronic systems. This method produces the highest number of null samples (more than 88.7%) using a low threshold and signal errors with very acceptable merit figures (99.876% of EPE, and 0.193% of MSE). The quality of the recovered signal is good for the clinical diagnosis, obtaining a superior compression rate in spite of using instantaneously captured ECG signals.
1.
2.
Introduction
The main steps of denoising algorithms based on Wavelet Transform are: 1. ECG Decomposition using the digital wavelet transforms (DWT). 2. Noise Estimation to determine the threshold. 3. Hard-Thresholding of the coefficients vector by applying the estimated value in 2. 4. ECG Reconstruction using the inverse DWT. This works improves the noise estimation and thresholding stage mainly to optimize the hardware efficiency. Moreover, the thresholds and signal are quantized in order to simulate fix point operations. Let X be an ECG signal of n samples, that is decomposed according to the pyramidal DWT to the level j. The wavelet coefficients vector (Wc) is defined as Wc = (cd1, cd2,…,cdj,caj) where caj is the approximation coefficients vector in the upper level and cd1 to cdj every detail coefficients vector. The wavelet vector size is N. The denoising problem of noise contaminated signal,
A large number of existing ECG denoising algorithms can be found. Some of them make use of a noise threshold that can be estimated with different methods. The objective of this paper is to show the comparison results of the different thresholding methods found in previous research [1-5] and to propose a new optimum ECG threshold by means of using the Wavelet Transform Techniques. Most algorithms are based on the previous threshold definition established in Donoho’s Universal theory [1]. Calculating the variance of a signal with noise using the median creates disadvantages in computing complexity which are difficult to deal with in wireless portable systems. In addition, in on-line devices, the noise variance is a priori unknown, since it changes instantaneously. Hence, the threshold estimation must be constantly updated when receiving a new sample captured by the system. Original estimation methods were modified and combined with existing techniques in hope that higher compression ratios and less error were achieved. This
ISSN 0276−6547
Thresholding methods
following a normal law N(0,( σˆ )) where
225
σˆ 2
is the noise
Computers in Cardiology 2006;33:225−228.
variance estimated using the median parameter is calculated as follows [2]: median({¦ cd1 ¦, ¦ cd2 ¦,... ¦ cdj ¦})
•
σˆ =
coefficients to estimate σˆ .
0.6745 Noticed that only the detail coefficients are used to estimate noise, but simulations were made considering the effects of using the approximation coefficients. This
Tj = 2
3.
calculates σˆ and uses a different threshold for every decomposition level. Moreover, to identify the method, M or S is used to show if the estimation is based on median or standard deviation parameter. N is the wavelet coefficients length.The global studied thresholds are: • GU: Universal definition[2] , defined as
Tuni = σˆ 2 ln N GM: Universal modified [3]. It was defined to be used in soft-thresholding, in this study we proposed using it in hard-thresholding.
σˆ 2 ln N N
For the level-dependent thresholds definitions Nj is the
σˆ j
level j coefficients vector size and the estimation using the level j coefficients. • MDU: Universal level dependent[4] defined as
Tuni j = σˆ j 2 ln N j •
MDD: Universal GM, proposed to be used as level dependent
Tm j = •
σˆ j 2 ln N j Nj
1E: DE threshold defined in [5],
Tj = 2 where it is noted
j−J 2
σˆ 1 2 ln N that the σˆ1 estimation
σˆ j 2 ln N j
Results and discussion
To test the efficiency of the proposed method, the two channels of the MIT-BIH Arrhythmia DB records [6] are used. The corresponding records are: 100, 101, 102, 104, 107, 117, 119, 201, 207, 208, 209, 212, 213, 214 and 232. In order to achieve similar results to ECG captured using the in-home electrocardiograph, each record was resampled at 360 Hz and quantized using 10 bits/sample of resolution. Offset values have been added to achieve a zero-mean signal. As an example, only 512 samples from the MIT-BIH Arrhythmia Database record e104 (1st derivation) are used. The wavelet transformation has 4 decomposition levels and the biorthogonal (bior3.9) is applied. Using these conditions, the wavelet coefficients vector has 585 elements. The evolution of the threshold and the number of elements with null value of the studied methods are given in Table 1.
dependent (D) thresholding. In the first one, σˆ is estimated using all the vector elements and the threshold is applied to the complete wavelet vector. The second
Tm =
j−J 2
The defined thresholds can be applied to the wavelet coefficients after a decomposition process in the thresholding stage. So, the hard-thresholding method is used due to a better performance than soft-thresholding method in increasing the null elements with a low computational cost. Signal values less than a reference level (i.e. threshold) are setting zeros.
study also calculates σˆ using the standard deviation parameter. This avoids the store of the previous data and it simplifies the memory requirements. Tests compare the different methods; some of them extracted of previous research and others new proposals. For each one, we proved four versions according to consider or not the upper approximation coefficients of the wavelet vector in the threshold estimation and/or thresholding. Two categories can be identified: Global (G) and level
•
only level 1 detail coefficients (cd1). DE: Level dependent 1E proposed to use in hard-thresholding and the whole details
Method
Threshold
Zeros
MGU
5
528
MGM
0
276
MDU
2, 5, 4, 4, 58
532
MDD
0, 0, 0, 1, 8
287
MDE
1, 2, 3, 4, 58
438
M1E
1, 1, 1, 2, 2
365
SGU
107
576
SGM
4
519
SDU
3, 22, 52, 60, 276
572
SDD
0, 2, 6, 9, 39
412
SDE
1, 11, 37, 60, 276
564
S1E
1, 2, 3, 4, 4
452
Table 1. Thresholds and number of null elements of methods (with the contribution of ca4)
uses
226
null thresholds are shown in the table because of the quantification of threshold values less than 0.5. In this case, no thresholding is needed. Although it seems that a high threshold value provides a greater number of zeros, we observed in table 1 that some methods like the MGU and SGM, obtained a high number of zeros with a small threshold (4 or 5). A small signal smoothing, as a result of the noise elimination, is produced by thresholding, without modifications in the signal QRS complex.
The same conclusions are obtained for all records, so one of them is used as example to describe the results and discussions easily. They can be extrapolated to the others signals. Common criteria for the performance testing is the mean square error (MSE), defined as
∑ ( x[n] − x N
MSE (%) =
n =1
∑x
R
[n]) 2 • 100
N
2
[ n]
n =1
The remained signal energy before thresholding is also analyzed measuring the Energy Packing Efficiency (EPE). This energy figure is applied to the wavelet vector to study the energy contributed by the vector after and before applying the chosen threshold to all the elements.
100 90 80 70 60
∑Wct 2 [n]
EPE (%) =
n =1 N
∑Wc [n]
EPE( %)
50
N
MSE( %)
40
× 100
30
2
20
n =1
10 0
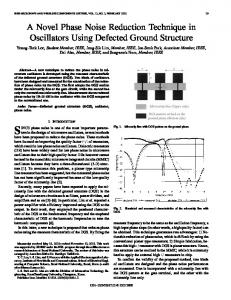
with N the coefficients number and N the elements of the complete wavelet vector. Table 2 and the following figure shows the EPE and MSE parameters for all the methods studied. Method
EPE(%)
MSE(%)
MGU
99,8200
0,2254
MGM
100,0000
0,0374
MDU
97,6900
2,0488
MDD
99,9300
0,0852
MDE
97,7400
1,9972
M1E
99,9800
0,0539
SGU
84,7200
18,1854
SGM
99,8700
0,1932
SDU
57,6300
38,4293
SDD
98,6300
1,2594
SDE
58,0400
38,0301
S1E
99,9500
0,0735
M GU
M GM
M DU
M DD
M DE
M 1E
SGU
SGM
SDU
SDD
SDE
S1E
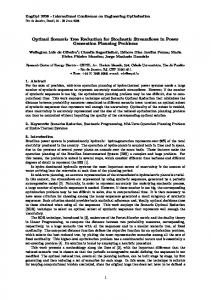
Figure 1. Comparison of EPE and MSE parameters Visual inspection for each method shows that the best behavior is when EPE is al least 99%. Distortion appears for lower values. Up to this limit, good reconstructions are guarantees. The MSE must be as low as possible. Acceptable results in the reconstruction are obtained when MSE is around 1.25%. Some of the methods presented fulfill these conditions. The reconstructed signals after being thresholded with some of the proposed estimation are shown in Fig.3. The median and standard deviation noise estimations and all the vector components to estimate the threshold value and to be thresholded are compared.
Table 2. EPE and MSE parameters of e104 (1st lead) using the compared methods In both level dependent and global threshold methods, every level detail coefficients are considered. Tests evaluated the influence that the upper level approximation coefficients (ca4) have in threshold estimation and increasing the zero elements after applying threshold. It is noted, that the level dependent methods have different thresholds for every details and approximation coefficients of the wavelet vector independently. Some
Figure 2. Visual performance of some proposed methods
227
errors are obtained.
The choice is based on getting a high number of zeros (519 null elements of the 585 coefficients) using a small threshold (i.e. 4) and having small errors measured in very acceptable merit figures EPE of 99.86% and 0.19% MSE . Besides, low complexity load suitable for real time operations is expected.
4.
Conclusions
This work illustrates the effect that wavelet thresholding has on the compression ratio and the quality of the signals reconstructed in wireless surroundings with continuous data transmission. The use of the standard deviation in the estimation of the threshold allows a simplification in the complexity of the hardware and the resources required in the electronic implementation. An almost minimal threshold is obtained which guarantees that noise is removed from the signal, but energy from the ECG is preserved for a correct recovery of the signal.
According to the criteria established before, the best quality performance is achieved using a global Universal method (SGM), using the standard deviation and all the approximation coefficients to estimate the threshold. After that, all the vector coefficients (including ca4) with absolute value less or equal to the threshold are zeroed. The original and the SGM reconstructed signal (e104 (1st. derivation) are shown in Fig.3.
Acknowledgements
Original Signal 100
The authors would like to thank the cardiologists of the Hospital de Valme and Virgin Macarena (Sevilla) for their helpful suggestions.
50 0 -50 -100
0
100
200
300
400
500
References
600
Reconstructed Signal
[1] Donoho DL, Johnstone IM, Kerkyacharian G, Picard D. Wavelet shrinkage: Asymptopia?. Journal of the Royal Statistical Society Series. 1995; 57:301-9. [2] Donoho DL, Johnstone IM. Ideal spatial adaptation by wavelet shrinkage. Biometrika 1994; 81(3):425-55. [3] Donoho DL. Progress in wavelet analysis and WVD: a ten minute tour. In: Y. Meyer, S. Roques. Progress in wavelet analysis and applications. Tolouse: Frontières Ed, 1993:109-128. [4] Cuesta Frau D. Estudio de métodos para procesamiento y agrupación de señales electrocardiográficas. Thesis. Univ. Politécnica de Valencia 2001. [5] Zhong D, Cherkassky V. Image denoising using Wavelet thresholding and model selection. Image Processing International Conference on. 2000:3:262-5. [6] http://www.physionet.org/. [7] Elena M, Quero JM, Toral SL, Tarrida CL, Segovia JA, Franquelo LG. CARDIOSMART: Intelligent Cardiology Monitoring System Using GPS/GPRS Networks. IECON 2002 Proc., Seville: 2002:4: 3419-24.
100 50 0 -50 -100
0
100
200
300
400
500
600
Figure 3. Original and Reconstructed e104 (1st lead) Therefore, the proposed method SGM considering the ca4 for all the operations is suitable for this application, providing all the characteristics to be used as a reliable, fast and optimal algorithm for the ECG denoising process using the Wavelet Transform. In table 3, the obtained results applying the SGM algorithm to other signals are shown. All the described methods before are considered. 107(2)
201(1)
208(1)
213(1)
214(2)
SGM
Records Threshold
12
3
10
11
6
MGU
Zeros Threshold
534 3
530 2
534 3
513 4
524 3
Zeros
428
493
449
454
459
Address for correspondence Mar Elena Electronic Engineering Department, E.S.I. U. Sevilla Avda. Descubrimientos, s/n 41092. Spain e-mail:
[email protected]
Table 3. SGM results (some MIT-BIH records (leads)) These results show the improvements provided by the optimal method SGM, in the sense of increasing the number of zero elements after thresholding. For comparison purposes, the previous values of zero elements obtained in [7] are included. In this electronic device the Donoho universal thresholding was implemented. It is also noticed that the EPE is near 99.8%. Hence, the energy remains almost totally and low
228