John Wiley & Sons Ltd., Chichester, UK, 6th edition, 2001. J.-J. E. Slotine and W. Li. ...... IMT-3-2015 Fredriksen, Arnt Gunvald. Numerical Studies of Viscous ...
Daniel de Almeida Fernandes
An output feedback motion control system for ROVs Guidance, navigation, and control
Thesis for the degree of philosophiae doctor
Trondheim, June 2015
Norwegian University of Science and Technology Faculty of Engineering Science and Technology Department of Marine Technology
.
NTNU � Norges Teknisk-Naturvitenskapelige Universitet Norwegian University of Science and Technology
Thesis for the degree of philosophiae doctor
Faculty of Engineering Science and Technology Department of Marine Technology
c 2015 Daniel de Almeida Fernandes. All rights reserved. Copyright
ISBN 978-82-326-0900-0 (Printed version) ISBN 978-82-326-0901-7 (Electronic version) ISSN 1503-8181
Doctoral theses at NTNU, 2015:122
Printed by Skipnes Kommunikasjon AS
This thesis is dedicated to my parents, Wilibaldo (in memoriam) and Rosa Maria, to my brother Otavio, to Renata K. Marques, and to her family.
Das utopias Se as coisas são inatingíveis... ora! Não é motivo para não querê-las... Que tristes os caminhos, se não fora A mágica presença das estrelas! � Mario Quintana (1951)
Poeminha do contra Todos estes que aí estão Atravancando o meu caminho, Eles passarão. Eu passarinho! � Mario Quintana (1978)
Summary This doctoral thesis is concerned with two main subjects, namely path generation and motion control of observation class Remotely Operated Vehicles (ROVs). Both of them are examined with an emphasis on the motion control problem. The common focus renders the subjects interrelated, although they can be investigated separately. Indeed, the investigation is carried out separately in the thesis. The �rst subject dealt with is path generation. A path generation scheme concerned with the generation of su�ciently smooth position, velocity, and acceleration references, for guiding the motion of ROVs along purposefully pre-de�ned planar and spatial curvature- and torsion-continuous paths comprised of rectilinear and curvilinear parts, is proposed. The references are meant to be used in highperformance Motion Control Systems (MCSs) with trajectory tracking and Dynamic Positioning (DP) capabilities. Four Degrees-of-Freedom (DoFs) are simultaneously considered, namely surge, sway, heave, and yaw. Steadier motion can be attained through the use of the references, which: i) induce steadier hydrodynamic e�ects, thereby inducing less plant parameter variations; and ii) demand steadier thrust forces and moments from the propulsion system. Consequently, higher overall motion accuracy can be attained, despite the challenging operating conditions underwater, while energy saving along the motion is favoured. Towards this end, a Reference Model (RM) that synthesises continuous position, velocity, and acceleration references concerning a single DoF motion, either linear or angular, is initially proposed. The RM synthesises suboptimal references with respect to the time taken to complete the motion under the condition of constrained acceleration and velocity. The condition of suboptimality has harmless implications in practice. It is mostly a consequence of the fact that the RM has to re�ect the desired motion speci�cations and the bandwidth limitations of the MCS being fed with the references. The RM is easy to tune through its meaningful tuning parameters. Two versions of the RM are proposed: i) a basic version, which guides motion under the condition that both the initial and the �nal values of the velocity and acceleration references are equal to zero; and ii) an extended version, which guides motion under the condition that the initial and �nal values of the velocity reference can be di�erent from zero, whereas both the initial and the �nal values v
Summary of the acceleration reference are equal to zero. Finally, the three references synthesised by the RM are used as the parametrisation of the group of references concerning multiple DoF motion which is �rst and foremost the aim of the proposed path generation scheme. Even though the proposed scheme focuses only on the (typically) fully-actuated ROVs, some of the presented ideas can be adapted to be used as a means of also guiding the motion of (typically) underactuated marine crafts, e.g. ships and Autonomous Underwater Vehicles (AUVs), in path following motion control applications. The path planning problem is not in the scope of this work. The proposed RM and the proposed path generation scheme are two of the main contributions found in this thesis. The mathematical development, as well as the experiments and simulations carried out, focused only on planar curvature-continuous paths. The second subject dealt with is motion control. An MCS dedicated to control observation class ROVs, which are used to conduct automated (high-resolution) image-capturing missions, is proposed. The MCS essentially consists in a modelbased Multiple-Input-Multiple-Output (MIMO) output feedback control system that works in tandem with an open-loop guidance system. The MIMO output feedback control system is comprised of a MIMO Proportional-Integral-Derivative (PID) controller that works in combination with a High-Gain State Observer (HGSO). The MIMO PID controller is aided by two additional control laws: i) one that implements state feedback linearisation of the plant dynamics; and ii) another that implements reference feedforward. An elementary thrust allocation algorithm completes the proposed MCS. The MCS has DP and trajectory tracking capabilities. Such capabilities enable the end-users of the ROV technology, e.g. marine archaeologists, biologists, and geologists, to obtain sequential high-quality images at the proper pace to construct consistent representations of objects and environments of interest. Four DoFs are controlled, namely surge, sway, heave, and yaw, whereas both remaining DoFs, namely roll and pitch, are left uncontrolled under the argumentation that they are self-stable � metacentric stability � by the design of the ROVs. Stability and satisfactory tracking performance are attainable through the use of suitable and su�ciently smooth reference trajectories, e.g. those generated by the path generation scheme also proposed in this thesis, in spite of the presence of unmodelled plant dynamics, plant parameter variations, measurement errors and noise, and environmental disturbances. Two other main contributions found in this thesis are the Globally Exponentially Stable (GES) model-based MIMO output feedback MCS, and the veri�cation of the hypothesis that an HGSO serves as an alternative to the benchmark Extended Kalman Filter (EKF) in the proposed MCS. Results from computer simulations and full-scale sea trials, both based on the NTNU's ROV Minerva, are presented and discussed to support the development carried out in the thesis. vi
Contents Summary
v
Contents
vii
List of �gures
xi
List of tables
xv
List of MATLABr scripts
xvii
Preface
xix
I
Introduction
1
1 Contributions and motivation 1.1 1.2 1.3 1.4 1.5
Introduction . . . . . . . . . . . . . Contributions and motivation . . . List of publications . . . . . . . . . Thesis outline . . . . . . . . . . . . List of acronyms and abbreviations
. . . . .
. . . . .
. . . . .
. . . . .
. . . . .
. . . . .
. . . . .
. . . . .
. . . . .
. . . . .
. . . . .
. . . . .
. . . . .
. . . . .
. . . . .
. . . . .
. . . . .
II Path generation 2 Introduction 2.1 2.2 2.3 2.4
Introduction . . . Objectives . . . . Motivation . . . Literature review
3 Reference model
3
3 3 5 6 7
11 . . . .
. . . .
. . . .
. . . .
. . . .
. . . .
. . . .
. . . .
. . . .
. . . .
. . . .
. . . .
. . . .
. . . .
. . . .
. . . .
. . . .
. . . .
. . . .
. . . .
. . . .
. . . .
. . . .
. . . .
. . . .
. . . .
. . . .
13
13 14 15 15
19 vii
Contents 3.1 3.2 3.3 3.4 3.5
Introduction . . . . . . . . . . . . . Optimal curve shapes . . . . . . . Description of the basic version . . Description of an extended version Further features . . . . . . . . . . .
4 Path generation 4.1 4.2 4.3 4.4 4.5 4.6
Introduction . . . . . . . . . . . . Reference frames . . . . . . . . . Straight lines . . . . . . . . . . . Mirror-symmetric twin clothoids Path generation scheme . . . . . Simulation results . . . . . . . .
. . . . . .
. . . . .
. . . . .
. . . . .
. . . . .
. . . . .
. . . . .
. . . . .
. . . . .
. . . . .
. . . . .
. . . . .
. . . . .
. . . . .
. . . . .
. . . . .
. . . . .
. . . . .
. . . . . .
. . . . . .
. . . . . .
. . . . . .
. . . . . .
. . . . . .
. . . . . .
. . . . . .
. . . . . .
. . . . . .
. . . . . .
. . . . . .
. . . . . .
. . . . . .
. . . . . .
. . . . . .
. . . . . .
19 20 22 35 41
45
45 46 47 48 55 57
5 Concluding remarks
65
III Motion control system
67
5.1 5.2
Conclusions . . . . . . . . . . . . . . . . . . . . . . . . . . . . . . Future works . . . . . . . . . . . . . . . . . . . . . . . . . . . . .
6 Introduction 6.1 6.2 6.3 6.4 6.5 6.6
Introduction . . . . . . . Proposed motion control Observation class ROVs Objectives . . . . . . . . Motivation . . . . . . . Literature review . . . .
. . . . . system . . . . . . . . . . . . . . . . . . . .
. . . . . .
. . . . . .
. . . . . .
. . . . . .
. . . . . .
. . . . . .
. . . . . .
. . . . . .
. . . . . .
. . . . . .
. . . . . .
. . . . . .
. . . . . .
. . . . . .
. . . . . .
. . . . . .
. . . . . .
. . . . . .
7 Plant models 7.1 7.2 7.3
Introduction . . . . . . . . . . . . . . . . . . . . . . . . . . . . . . Process plant model . . . . . . . . . . . . . . . . . . . . . . . . . Control plant model . . . . . . . . . . . . . . . . . . . . . . . . .
8 Motion control system 8.1 8.2 8.3 8.4 8.5 8.6 8.7
viii
Introduction . . . . . . . . . . . . . . . . . . . . . . . . . Control system . . . . . . . . . . . . . . . . . . . . . . . Navigation system . . . . . . . . . . . . . . . . . . . . . Stability of the output feedback control system . . . . . Implementation of the Motion Control System (MCS) in Results from full-scale sea trials . . . . . . . . . . . . . . Simpli�ed benchmark against the EKF . . . . . . . . . .
. . . . . . . . . . . . . . . . . . . . practice . . . . . . . . . .
65 66
69
69 70 72 73 74 74
77
77 77 87
91
91 91 102 108 112 115 128
Contents
9 Concluding remarks
135
Appendices
137
9.1 9.2
Conclusions . . . . . . . . . . . . . . . . . . . . . . . . . . . . . . Future works . . . . . . . . . . . . . . . . . . . . . . . . . . . . .
135 136
A Reference model: MATLABr -based, ready-made code examples 139 A.1 Basic version . . . . . . . . . . . . . . . . . . . . . . . . . . . . . A.2 Extended version . . . . . . . . . . . . . . . . . . . . . . . . . . .
139 145
B Filter-based reference models
149
C NTNU's ROV Minerva
157
D Topics in mathematics revisited
161
References
169
B.1 Introduction . . . . . . . . . . . . . . . . . . . . . . . . . . . . . . B.2 Linear time invariant FBRM . . . . . . . . . . . . . . . . . . . . B.3 Nonlinear time varying FBRM . . . . . . . . . . . . . . . . . . .
D.1 Useful functions . . . . . . . . . . . . . . . . . . . . . . . . . . . . D.2 Statistics . . . . . . . . . . . . . . . . . . . . . . . . . . . . . . . D.3 Discrete-time approximation of continuous-time systems . . . . .
149 149 151
161 163 163
ix
List of �gures 2.1
Path generation scheme built upon the reference model . . . . . . .
15
3.1 3.2 3.3 3.4 3.5 3.6 3.7 3.8 3.9 3.10 3.11 3.12 3.13 3.14
Optimal curve shapes . . . . . . . . . . . . . . . . . . . . . . . . . . Shapes of the references synthesised by the reference model . . . . . Position and heading (NED frame) . . . . . . . . . . . . . . . . . . . Linear and angular velocities (BF frame) . . . . . . . . . . . . . . . Commanded propeller rotations . . . . . . . . . . . . . . . . . . . . . North position comparison . . . . . . . . . . . . . . . . . . . . . . . . First absolute tracking error comparison . . . . . . . . . . . . . . . . Second absolute tracking error comparison . . . . . . . . . . . . . . . Surge velocity comparison . . . . . . . . . . . . . . . . . . . . . . . . Commanded propeller rotations . . . . . . . . . . . . . . . . . . . . . References synthesised by the extended version of the reference model Sketch of the hysteretic waiting function . . . . . . . . . . . . . . . . North position . . . . . . . . . . . . . . . . . . . . . . . . . . . . . . Surge velocity . . . . . . . . . . . . . . . . . . . . . . . . . . . . . . .
21 21 30 30 31 31 32 32 34 34 40 42 43 43
4.1 4.2 4.3 4.4 4.5 4.6 4.7 4.8 4.9 4.10 4.11 4.12 4.13
Arc length ratio and radius ratio . . . . . . . . . . . . . . . . . . . Curvature comparison . . . . . . . . . . . . . . . . . . . . . . . . . Length comparison . . . . . . . . . . . . . . . . . . . . . . . . . . . Example of path using approximating curves . . . . . . . . . . . . Example of path using interpolating curves . . . . . . . . . . . . . Reference path in the NE-plane . . . . . . . . . . . . . . . . . . . . Reference path curvature . . . . . . . . . . . . . . . . . . . . . . . Parameter $p (t) and its derivatives with respect to time . . . . . . Characteristic functions and parametrisation of the reference path Trajectory in the NE-plane with heading . . . . . . . . . . . . . . . Position and heading (NED frame) . . . . . . . . . . . . . . . . . . Linear and angular velocities (BF frame) . . . . . . . . . . . . . . Commanded thrust forces and moment . . . . . . . . . . . . . . . .
50 51 51 56 56 60 60 61 61 62 62 63 63
. . . . . . . . . . . . .
xi
List of �gures 6.1 6.2
Block diagram of the proposed motion control system . . . . . . . . Schematic diagram of types of underwater vehicles . . . . . . . . . .
70 73
7.1 7.2
NED and BF reference frames . . . . . . . . . . . . . . . . . . . . . . Example of static mapping of thrust force . . . . . . . . . . . . . . .
78 86
8.1 8.2 8.3 8.4 8.5 8.6
Feedback connection between the auxiliary subsystems S1 and S2 . . Feedback connection between the auxiliary subsystems S1 and S2 . . Feedback connection between the auxiliary subsystems S1 and S2 . . Trajectory tracking test: top view of the NE-plane . . . . . . . . . . Trajectory tracking test: position and heading angle (NED frame) . Trajectory tracking test: absolute position and heading angle errors (NED frame) . . . . . . . . . . . . . . . . . . . . . . . . . . . . . . . Trajectory tracking test: velocities (BF frame) . . . . . . . . . . . . Trajectory tracking test: absolute velocity errors (BF frame) . . . . . Trajectory tracking test: commanded propeller rotations . . . . . . . Dynamic positioning test: position and heading angle (NED frame) . Dynamic positioning test: absolute position and heading angle errors (NED frame) . . . . . . . . . . . . . . . . . . . . . . . . . . . . . . . Dynamic positioning test: velocities (BF frame) . . . . . . . . . . . . Dynamic positioning test: absolute velocity errors (BF frame) . . . . Dynamic positioning test: commanded propeller rotations . . . . . . Dynamic positioning test: position and heading angle (NED frame) . Dynamic positioning test: absolute position and heading angle errors (NED frame) . . . . . . . . . . . . . . . . . . . . . . . . . . . . . . . Dynamic positioning test: velocities (BF frame) . . . . . . . . . . . . Dynamic positioning test: absolute velocity errors (BF frame) . . . . Dynamic positioning test: commanded propeller rotations . . . . . . Maximum absolute position and heading angle errors (NED frame) under the HGSO . . . . . . . . . . . . . . . . . . . . . . . . . . . . . Maximum absolute position and heading angle errors (NED frame) under the EKF . . . . . . . . . . . . . . . . . . . . . . . . . . . . . . Maximum absolute linear speed and yaw rate errors (BF frame) under the HGSO . . . . . . . . . . . . . . . . . . . . . . . . . . . . . . . . . Maximum absolute linear speed and yaw rate errors (BF frame) under the EKF . . . . . . . . . . . . . . . . . . . . . . . . . . . . . . . . . .
98 106 110 117 117
8.7 8.8 8.9 8.10 8.11 8.12 8.13 8.14 8.15 8.16 8.17 8.18 8.19 8.20 8.21 8.22 8.23
118 118 119 119 121 121 122 122 123 125 125 126 126 127 132 132 134 134
A.1 References synthesised by running Script A.1 as it is . . . . . . . . . 142 A.2 References synthesised by running Script A.1 with a little di�erence in the tuning . . . . . . . . . . . . . . . . . . . . . . . . . . . . . . . . . 142 A.3 References synthesised by running Script A.3 as it is . . . . . . . . . 148 xii
List of �gures B.1 Root locus used in qualitative system behaviour study . . . . . . . . 153 B.2 First comparison: references generated by LTI FBRM and NTV FBRM with saturation . . . . . . . . . . . . . . . . . . . . . . . . . . . . . . 154 B.3 Second comparison: references generated by LTI FBRM and NTV FBRM without saturation . . . . . . . . . . . . . . . . . . . . . . . . . . . . 155 B.4 Third comparison: references generated by LTI FBRM and NTV FBRM without saturation . . . . . . . . . . . . . . . . . . . . . . . . . . . . 155 C.1 ROV Minerva . . . . . . . . . . . . . . . . . . . . . . . . . . . . . . . C.2 Top view of Minerva's frame: thruster installation con�guration . . .
157 159
D.1 Pole correspondence between the s-plane and the z -plane . . . . . . D.2 Block diagram of a numerical integrator (trapezoidal method) . . . . D.3 Block diagram of a discrete-time system (trapezoidal method) . . . .
165 166 168
xiii
List of tables 3.1 3.2
Tuning parameters of the reference model . . . . . . . . . . . . . . . Tuning parameters of the reference model used in the simulation . .
22 41
4.1 4.2 4.3 4.4
Approximated values of arc length and radius ratios from Figure 4.1 Approximated lengths of the curves in Figure 4.3 . . . . . . . . . . . Tuning parameters of the reference model used in the simulation . . Table of waypoints in the NE-plane . . . . . . . . . . . . . . . . . . .
49 50 59 59
8.1 8.2 8.3 8.4 8.5
Information Information Information Information Information
summary summary summary summary summary
concerning concerning concerning concerning concerning
Figures Figures Figures Figures Figures
8.4�8.6 . 8.10�8.11 8.15�8.16 8.20�8.21 8.22�8.23
. . . . .
. . . . .
. . . . .
. . . . .
. . . . .
. . . . .
. . . . .
. . . . .
. . . . .
. . . . .
116 123 127 131 133
C.1 Basic speci�cations of the ROV Minerva . . . . . . . . . . . . . . . .
158
xv
List of MATLABr scripts A.1 Basic version of the reference model . . . . . . . . . . . . . . . . . . A.2 Basic version of the reference model (alternative) . . . . . . . . . . . A.3 Extended version of the reference model . . . . . . . . . . . . . . . .
139 143 145
xvii
Preface This thesis is submitted in partial ful�llment of the requirements for the degree of Philosophiae Doctor (PhD) at the Norwegian University of Science and Technology (NTNU). It is an article-based PhD thesis, i.e. the subject matter of this thesis is based on a collection of scienti�c articles published throughout the PhD programme. The work reported in this doctoral thesis was carried out at the Centre for Ships and Ocean Structures (CeSOS) and at the Centre for Autonomous Marine Operations and Systems (AMOS), both headquartered in the Department of Marine Technology (IMT) during the period spanning from August 2010 to June 2015 under the main supervision of Prof. Asgeir J. Sørensen from the IMT, and co-supervision of Prof. Kristin Y. Pettersen from the Department of Engineering Cybernetics (ITK), NTNU, and Prof. Décio C. Donha from the Department of Mechanical Engineering (PME) of the Polytechnic School of the University of São Paulo (Poli/USP), Brazil. The Research Council of Norway (NF) is acknowledged as the sponsor of the research work that culminated with this doctoral thesis through the Centres of Excellence (SFF) funding scheme. Prof. Donha visited Trondheim in August/September 2012. His visit facilitated an even closer and highly cooperative interaction between me and my supervisors, bridging the physical distance separating Brazil and Norway. Indeed, Prof. Donha played the fundamental role of introducing me to Prof. Sørensen during the conference IFAC MCMC 2009 held in Brazil, and in that �rst encounter my plans of becoming a PhD took the �rst steps towards reality. This doctoral thesis then symbolises to me a priceless reward I was granted through the hard, nonetheless entertaining and truly enriching, work I carried out at NTNU. During the PhD programme I had the privilege of being accepted to attend the course entitled `Light, climate, and primary productivity in the Arctic' that was lectured at the University Centre in Svalbard (UNIS), Svalbard, Norway, in May/June 2012, by (head lecturer) Prof. Geir Johnsen from the Department of Biology (IBI), NTNU, who also holds an Adjunct Prof. position in the Department of Arctic Biology, UNIS, by Associate Prof. Tove Gabrielsen from the Department of Biology, UNIS, by Prof. Heidi M. Dierssen from the Department xix
Preface of Marine Sciences, University of Connecticut (UCONN), USA, and by Inga A. Aamot from the IBI, NTNU. The course lasted circa forty long and intensive days � literally, as there were no dark nights due to the splendorous midnight sun �, also encompassing one week of �eldwork in Ny-Ålesund, Svalbard. It was extremely instructive at the broadest extent, and amazing all its way. Moreover, staying in Svalbard during Spring time is wonderful, indisputably an unforgettable experience for a lifetime. In these more than four years I also had the privilege of attending the welltaught, very instructive guest course on `Hybrid dynamical systems' that was lectured at the IMT, NTNU, in September 2013, by Prof. Andrew R. Teel from the Department of Electrical and Computer Engineering, University of California, Santa Barbara (UCSB), USA. The monthly cruises aboard the NTNU's Research Vessel (R/V) Gunnerus, when experiments based on the NTNU's Remotely Operated Vehicle (ROV) Minerva � whose details are found in Appendix C � were conducted, provided the experimental results presented throughout this doctoral thesis. I am extremely grateful for the unique opportunity of being able to implement in practice most of the concepts dealt with during the PhD programme and, more importantly, of learning by doing. I am absolutely sure that every frustrated experiment I faced aboard, along with the countless nights I spent trying to make them right, helped me expand and consolidate my knowledge.
Acknowledgements I am indebted to Renata K. Marques for her continuous support and help during these years, and even earlier, before the PhD programme actually started, to my family, and to my three supervisors. There are no words su�ciently capable of expressing my appreciation of their positive attitudes towards me. In particular, I would like to manifest my gratitude to Albert S. Muntadas, Dr. Anastasios M. Lekkas, Andreas R. Dahl, Anirban Bhattacharyya, Arturo J. O. Malca, Astrid H. Brodtkorb, Ausberto R. Medina, Dr. Bo Zhao, Claudio Paliotta, Daniele Borri, Dennis J. W. Belleter, Dr. Dominik A. Breu, Draºen Poli¢, Dr. Eirik Bøckmann, Dr. Erin E. Bachynski, Dr. Esten I. Grøtli, Dr. Fachri P. Nasution, Dr. Francesco Scibilia, Dr. Fredrik Dukan, Prof. Geir Johnsen, Dr. Henrique M. Gaspar, Hilde C. Hagen, Ida M. Strand, Inga A. Aamot, Ingrid M. Hansen, Prof. Ingrid Schjølberg (IMT, NTNU), Jakob M. Hansen, Javier B. Mataix, Dr. José P. G. Canabes, Kristian R. Klausen, Marianne Kirkeby, Dr. Martin Ludvigsen, Mauro Candeloro, Michel R. Miyazaki, Mohsen Bardestani, Dr. Morten Breivik, Dr. Oleh I. Karpa, Dr. Pedro A. P. Ramírez, Petter Norgren, Pierre-Yves T. Henry, Qin Zhang, Robert Kajanus, Prof. Roger Skjetne (IMT, NTNU), Sepideh Jafarzadeh, Stefan Ekehaug, Ste�en Ø. Kørte, Svenn A. Tutturen, Prof. Thor I. xx
Fossen (ITK, NTNU), Torstein I. Bø, Ulrik Jørgensen, Dr. Walter Caharija, Dr. Yong He, Øyvind K. Kjerstad, Øyvind Ødegård, and to all Brazilian friends in Trondheim for the good moments and laughs we had together, during a meal or over a glass (maybe more) of beer or wine, either in Trondheim or in their hometowns in Norway and abroad, carrying furniture when moving to new apartments, playing music in a container by the river � Nidelva �, and travelling together for pleasure or to attend conferences and other academic events, just to mention some memorable moments. I cannot fail to also mention here my o�ce mates at di�erent periods, Anirban Bhattacharyya, Arturo J. O. Malca, Dr. Eirik Bøckmann, Dr. Fachri P. Nasution, Mauro Candeloro, Michel R. Miyazaki, Sepideh Jafarzadeh, Sergey Gavrilin, Dr. Vegard Longva, and Dr. Yong He, for being, many times, the �rst people to call for help in case of di�culties. I would like to thank very much the captain of R/V Gunnerus, Arve Knudsen, as well as her former and current crew members, Steinar M. Johansen, Kjell Vestnes, Svenn O. Linde, Mats R. Reppe, and Elias Selliseth, for the hospitality, friendship, support, and assistance provided during the cruises I attended. Last but not least, I would like to say many thanks to the IT personnel working for the IMT, Bjørn T. Bach and Seyed M. Jalali, and to the former and current administrative personnel working for the IMT too, Annika Bremvåg, Astrid E. Hansen, Jannike Gripp, Linda Grønstad, Marianne Kjølås, Marianne W. Holm, Marit Nordtiller, Marit Solheim, Oddny K. Østhus, Renate Karoliussen, and Sigrid B. Wold, for the friendship, support, and e�cient and e�ective assistance I was provided with since as early as May 2010, before I actually moved from Brazil to Norway. Before �nishing these prefatory words I would also like to thank very much, from the bottom of my heart, all friends, colleagues, co-workers, professors, and students at NTNU and abroad whose names are not explicitly mentioned here, in spite of having also contributed towards the whole work that culminated with this doctoral thesis, in appreciation of the memorable moments we spent together, for the pleasant and fruitful � for me, at least � technical and non-technical discussions we had, where I learnt more about technical, political, cultural, etc. matters concerning di�erent corners of the world. These lessons are indeed as valuable as the extensive technical content I dealt with during the PhD programme. I thank them all for their words of support and encouragement, and for helping me to successfully manage the challenging tasks and duties I faced.
xxi
Part I
Introduction
1
Chapter 1
Contributions and motivation 1.1 Introduction This thesis is concerned with two main subjects, namely path generation and motion control of observation class Remotely Operated Vehicles (ROVs). Both subjects are examined with an emphasis on the motion control problem. The common focus renders the subjects interrelated, although they can be investigated separately. Indeed, the investigation is presented separately herein. The �rst subject, a path generation scheme, is presented in Part II of the thesis. The second subject, a Motion Control System (MCS), is presented in Part III of the thesis. Results from computer simulations and full-scale sea trials, both based on the NTNU's ROV Minerva, are presented and discussed to support the development carried out in both parts of the thesis. ROVs are underwater vehicles teleoperated from support vessels through umbilical cables which transmit power, commands, and data. They have many applications in shallow, mid, and deep waters. Observation class ROVs are smallersized vehicles which are indispensable workhorses used worldwide as carriers of imagery devices for industrial, research, and military activities. They can also perform light-duty sampling and intervention tasks.
1.2 Contributions and motivation 1.2.1 Path generation scheme A path generation scheme concerned with the generation of su�ciently smooth position, velocity, and acceleration references, for guiding the motion of ROVs along purposefully pre-de�ned planar and spatial curvature- and torsion-continuous (G2 ) paths comprised of rectilinear and curvilinear parts, is proposed. The 3
1. Contributions and motivation references are meant to be used in high-performance MCSs with trajectory tracking and Dynamic Positioning (DP) capabilities. Four Degrees-of-Freedom (DoFs) are simultaneously considered, namely surge, sway, heave, and yaw. Towards this end, a Reference Model (RM) that synthesises position, velocity, and acceleration references of classes C 2 , C 1 , and C 0 , respectively, concerning a single DoF motion, either linear or angular, is initially proposed. The RM synthesises suboptimal references with respect to the time taken to complete the motion under the condition of constrained acceleration and velocity. The RM is easy to tune through its meaningful tuning parameters, which re�ect the desired motion speci�cations and the bandwidth limitations of the MCS being fed with the references. Steadier motion can be attained through the use of the references, which induce steadier hydrodynamic e�ects, thereby inducing less plant parameter variations along the motion, and require steadier thrust forces and moments. Consequently, higher overall motion accuracy can be attained, despite the challenging operating conditions underwater, while energy saving along the motion is favoured. The two main contributions of Part II � the RM and the path generation scheme � are respectively found in Chapter 3 and Chapter 4. Both are original contributions. The main motivation for developing the RM was to develop another alternative to the useful, yet simple, Filter-Based Reference Model (FBRM), in order to contribute to the development of the versatile MCS for ROVs that is carried out at NTNU under the collaborative e�ort of the research team headed up by Prof. Asgeir J. Sørensen. The topic FBRM is super�cially revisited in Appendix B for the ease of reading. The motivation for developing the path generation scheme came naturally, as it is an extension of the previous objective to multiple DoF motion. RMs are important building blocks of reference trajectory tracking control systems in general but, however, not very much published on their own sake. As a general rule when it comes to motion control applications, even when it is clearly stated that an RM is used, little or no attention is given to details. This fact leaves it implicit that the RM is actually an FBRM, which, although easy to implement in practice, has major drawbacks. Improvements are possible at the cost of adding complexity to the originally simple linear design, but the advantages of the improvements are still limited. On the other hand, more sophisticated RMs are often used in the �elds of robotics and Computer Numeric Controlled (CNC) machines. Once more sophisticated designs are sought, it is possible to think about an overall improvement, which concern not only the motion accuracy, but also energy consumption and optimality.
1.2.2 Motion control system An MCS dedicated to control observation class ROVs, which are used to conduct automated image-capturing missions, is proposed. The MCS essentially consists in a model-based Multiple-Input-Multiple-Output (MIMO) output feedback con4
1.3. List of publications trol system that works in tandem with an open-loop guidance system. The MIMO output feedback control system is comprised of a MIMO Proportional-IntegralDerivative (PID) controller that works in combination with a High-Gain State Observer (HGSO). The MIMO PID controller is aided by two additional control laws: i) one that implements state feedback linearisation of the plant dynamics; and ii) another that implements reference feedforward. An elementary thrust allocation algorithm completes the proposed MCS. The MCS has DP and trajectory tracking capabilities. Four DoFs are controlled, namely surge, sway, heave, and yaw, whereas both remaining DoFs, namely roll and pitch, are left uncontrolled under the argumentation that they are self-stable � metacentric stability � by the design of the ROVs. Stability and satisfactory tracking performance are attainable through the use of suitable and su�ciently smooth reference trajectories, e.g. those generated by the path generation scheme also proposed in this thesis, in spite of the presence of unmodelled plant dynamics, plant parameter variations, measurement errors and noise, and environmental disturbances. The two main contributions of Part III � the Globally Exponentially Stable (GES) model-based MIMO output feedback MCS and the veri�cation of the hypothesis that an HGSO serves as an alternative to the benchmark Extended Kalman Filter (EKF) in the proposed MCS � are concentrated in Chapter 8. Both are original contributions. The motivation for developing the MCS was to contribute to the development of the aforementioned NTNU's MCS. More speci�cally, the study of whether or not an HGSO serves as an alternative to the benchmark EKF motivated the whole work that culminated in the proposed MCS.
1.3 List of publications Book chapter(s) • A. J. Sørensen, F. Dukan, M. Ludvigsen, D. A. Fernandes, and M. Candeloro. Development of dynamic positioning and tracking system for the ROV Minerva. In G. N. Roberts and R. Sutton, editors, Further advances in unmanned marine vehicles, volume 77 of IET Control Engineering Series, chapter 6, pages 113� 128. IET � The Institution of Engineering and Technology, Stevenage, UK, 2012.
Journal paper(s) • D. A. Fernandes, A. J. Sørensen, and D. C. Donha. Path generation for highperformance motion of ROVs based on a reference model. Modeling, Identi�cation and Control, 36(2):81�101, April 2015a. 5
1. Contributions and motivation • D. A. Fernandes, A. J. Sørensen, K. Y. Pettersen, and D. C. Donha. Output feedback motion control system for observation class ROVs based on a high-gain state observer: theoretical and experimental results. IFAC Control Engineering Practice, 39:90�102, June 2015b.
Conference paper(s) • D. A. Fernandes, A. J. Sørensen, and D. C. Donha. Full-scale sea trials of a motion control system for ROVs based on a high-gain state observer. In IFAC WC 2014 � South Africa, pages 5157�5162, August 2014. • D. A. Fernandes, A. J. Sørensen, and D. C. Donha. Trajectory tracking motion control system for observation class ROVs. In IFAC CAMS 2013 � Japan, pages 251�256, September 2013. • D. A. Fernandes, F. Dukan, and A. J. Sørensen. Reference model for high performance and low energy consumption motions. In IFAC NGCUV 2012 � Portugal, pages 217�222, April 2012.
1.4 Thesis outline The subject matter of this thesis is divided into three main parts plus four appendices. Each part is in turn subdivided into chapters. Part I is comprised of Chapter 1 only, which introduces the problems dealt with in the thesis, and presents the motivation to deal with them. Chapter 1 also provides the reader with a list of publications, which indicates where nearly the totality of the contents of the thesis was �rst published, and a list of acronyms and abbreviations which appear throughout the text. Part II is comprised of Chapters 2�5. It deals with the problem of generation of suitable and su�ciently smooth references for guiding high-performance, four DoF motion of observation class ROVs along purposefully pre-de�ned planar and spatial curvature- and torsion-continuous paths in automated missions. The paths are comprised of rectilinear and curvilinear parts. The DoFs of interest are surge, sway, heave, and yaw. The references are meant to be employed in trajectory tracking and DP applications. The proposed reference generation scheme builds upon an RM that is initially proposed. Henceforward, the contents of every chapter of Part II is given separately. Chapter 2 introduces the problem dealt with in Part II, presents the motivation to deal with it, and presents a literature review. Chapter 3 proposes an RM that synthesises references for single DoF motion, either linear or angular, whose most noticeable characteristics are: i) high overall 6
1.5. List of acronyms and abbreviations motion accuracy can be attained, despite the challenging operating conditions of the ROVs, since less plant parameter variations are induced while moving; and ii) steadier thrust forces and moments are demanded from the propulsion system of the ROVs, whereupon energy saving is favoured while moving. Chapter 4 is devoted to the proposed reference generation scheme. Chapter 5 presents concluding remarks and provides a list of future works. Part III is comprised of Chapters 6�9. It is concerned with an MCS dedicated to control the motion of observation class ROVs which are used to conduct automated image-capturing missions. Four DoFs � surge, sway, heave, and yaw � are simultaneously controlled. The MCS consists of a model-based MIMO output feedback control system, comprised of a MIMO PID controller, a pair of auxiliary control laws, and an HGSO, that is fed by an open-loop guidance system. Henceforward, the contents of every chapter of Part III is given separately. Chapter 6 introduces the problem dealt with in Part III, presents the motivation to deal with it, and presents a literature review. Chapter 7 presents the plant modelling, where especial attention is drawn to the hydrodynamic e�ects. Chapter 8 is devoted to the proposed MCS. Chapter 9 presents concluding remarks and provides a list of future works. Appendix A furnishes some MATLABr -based ready-made implementation examples regarding the RMs described within Part II. Appendix B touches upon the subject FBRM, which is especially relevant in the context of Part II. Appendix C introduces the NTNU's ROV Minerva, which served as the test platform to the experiments and numerical simulations which yielded the practical and simulation results presented throughout the thesis. In addition, the mathematical model of Minerva was instrumental in the synthesis of the control laws and state observers carried out in Part III. Appendix D touches upon some topics of interest in mathematics, which are relevant in the context of the subjects covered in this thesis. In particular, the Tustin's approximation method, which provides reliable discrete-time approximations of continuous-time dynamical systems, is concisely revisited in the appendix. Such a method was instrumental in the MATLABr - and LabVIEWr -based implementation of the MCS proposed in Part III.
1.5 List of acronyms and abbreviations BF CB CG CW
Body-Fixed Centre of Buoyancy Centre of Gravity Clockwise 7
1. Contributions and motivation DP GA(s) KF LQ RM(s) R/V SD TF(s)
Dynamic Positioning Genetic Algorithm(s) Kalman Filter Linear-Quadratic Reference Model(s) Research Vessel Standard Deviation Transfer Function(s)
ACW AUV(s) CNC CPM DoF(s) DVL EKF GES GNC IMU KYP LoS LPF(s) LQG LTI LTR LTV MCS(s) MPC NED NGC NTV PID PPM RMS ROV(s) SO(N ) SPR SS(N ) UAV(s) UUV(s) ZOH
Anticlockwise Autonomous Underwater Vehicle(s) Computer Numeric Controlled Control Plant Model Degree(s)-of-Freedom Doppler Velocity Log Extended Kalman Filter Globally Exponentially Stable Guidance, Navigation, and Control Inertial Measurement Unit Kalman-Yakubovich-Popov Line-of-Sight Low-Pass Filter(s) Linear-Quadratic Gaussian Linear Time Invariant Loop Transfer Recovery Linear Time Varying Motion Control System(s) Model Predictive Control North-East-Down Navigation, Guidance, and Control Nonlinear Time Varying Proportional-Integral-Derivative Process Plant Model Root-Mean-Square Remotely Operated Vehicle(s) Special Orthogonal group of order N ∈ N | N > 1 Strictly Positive Real Skew-Symmetric group of order N ∈ N | N > 1 Unmanned Aerial Vehicle(s) Unmanned Underwater Vehicle(s) Zero-Order Hold
8
1.5. List of acronyms and abbreviations cRIO FBRM(s) HGSO(s) ITAE MEMS MIMO MRAC SISO
compact Recon�gurable Input/Output Filter-Based Reference Model(s) High-Gain State Observer(s) Integral of Time multiplied by Absolute Error Micro-Electro-Mechanical System Multiple-Input-Multiple-Output Model Reference Adaptive Control Single-Input-Single-Output
9
Part II
Path generation
11
Chapter 2
Introduction 2.1 Introduction Part II of this thesis deals with the generation of su�ciently smooth position, velocity, and acceleration references for guiding the motion of ROVs along purposefully pre-de�ned planar and spatial curvature- and torsion-continuous paths in automated missions. Four DoFs are simultaneously considered, namely surge, sway, heave, and yaw (SNAME, 1950). Towards that end, an RM that synthesises references concerning a single DoF motion along a straight line path, in a suboptimal manner with regard to the time taken to traverse this type of path, is initially proposed. Then, the references synthesised by the RM are used as the parametrisation of other references concerning multiple DoF motion along planar and spatial curvature- and torsion-continuous paths comprised of rectilinear and curvilinear parts. The generated references are meant to be used in high-performance MCSs with trajectory tracking and DP capabilities, e.g. Fernandes et al. (2015b), Omerdic et al. (2012), Sørensen et al. (2012), Caccia (2006), and Hsu et al. (2000). The main contributions found in this part of the thesis were also published in Fernandes et al. (2015a) and Fernandes et al. (2012). Although Part II focuses on (typically) fully-actuated Unmanned Underwater Vehicles (UUVs) such as ROVs, some of the ideas presented herein can be adapted to be used as a means of also guiding the motion of (typically) underactuated marine crafts, e.g. ships and UUVs such as Autonomous Underwater Vehicles (AUVs), in path following motion control applications. In particular, the main geometrical property that underlies the path construction in this work � curvature and torsional continuities � is of relevance in path following applications in general. Above all, this work is concerned with observation class ROVs. Observation class ROVs are indispensable workhorses used worldwide as carriers of imagery devices, e.g. cameras, echo sounders, hyperspectral imagers, and 13
2. Introduction sonars, for industrial, research, and military activities, e.g. inspection, mapping, monitoring, surveillance, and survey. They can also perform light-duty intervention tasks. In essence, ROVs are typically vehicles with open-frame structures teleoperated from support vessels through umbilical cables which transmit power, commands, and data. An example is the NTNU's ROV Minerva introduced in Appendix C. More information concerning observation class ROVs is concisely provided in Section 6.3 in Part III. The interested reader is referred to e.g. Christ and Wernli (2014, 2007) for a comprehensive coverage of the subject. Results from simulations and full-scale sea trials, both based on Minerva, are presented and discussed to support the development carried out in Part II. Granted that accurate motion control is desirable regardless of the type of automated mission that is performed, and is a requirement when it comes to automatically capturing usable images at the proper pace to construct consistent representations of objects or environments of interest, e.g. mapping mission, an MCS with trajectory tracking and DP capabilities has to incorporate a guidance (sub)system capable of generating suitable and su�ciently smooth references. Only references with these attributes can be satisfactorily tracked (Sørensen, 2013; Fossen, 2011; Slotine and Li, 2005). Guidance is concerned with the transient motion behaviour associated with the achievement of the motion control objectives (Fossen, 2011; Breivik and Fossen, 2009), so that the mission speci�cations and the vehicle dynamics are all simultaneously observed. Furthermore, collisions with stationary obstacles are avoided whenever a collision-free path is closely tracked or followed. The path planning problem, however, is not in the scope of this work. The reader is referred to Tsourdos et al. (2011), Kavraki and LaValle (2008), Minguez et al. (2008), and LaValle (2006), when it comes to the path planning problem, where the latter provides a thorough coverage of the subject. The former reference is concerned with cooperative path planning of Unmanned Aerial Vehicles (UAVs), whereas both middle references address the robotics task of planning collision-free motion.
2.2 Objectives I. Propose an RM that guides steady single DoF motion in �nite time and is easy to tune. Steadier motion can be attained through the use of references which induce steadier hydrodynamic e�ects, thereby inducing less plant parameter variations along the motion, and demand steadier thrust forces and moments from the propulsion system. Consequently, higher overall motion accuracy can be attained, despite the challenging operating conditions underwater, while energy saving along the motion is favoured. Easy tuning is achieved through the use of meaningful tuning parameters, which relate well to the motion speci�cations and the vehicle dynamics. The RM is described in Chapter 3. Objective
14
2.3. Motivation
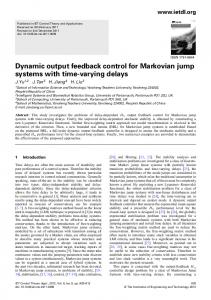
II. Propose a path generation scheme, also referred to as reference generation scheme, built upon the proposed RM, that guides steady multiple DoF motion along purposefully pre-de�ned curvature- and torsion-continuous paths formed by rectilinear and curvilinear parts. Figure 2.1 depicts a block diagram that illustrates how the path generation scheme builds upon the proposed RM. The path generation scheme is described in Chapter 4.
Objective
Figure 2.1: Block diagram of the path generation scheme built upon the reference model.
2.3 Motivation The motivation for developing the RM was to develop another alternative to the useful, yet simple, FBRM found in e.g. Sørensen (2013) and Fossen (2011), in order to contribute to the development of the versatile MCS for ROVs that is carried out at NTNU under the collaborative e�ort of the research team headed up by Prof. Asgeir J. Sørensen (Dukan, 2014; Sørensen et al., 2012). The topic FBRM is super�cially revisited in Appendix B for the ease of reading. The inspiration that underlies the development of the proposed RM came from works on motion optimisation for AUVs, e.g. Chyba et al. (2008) and Kumar et al. (2005), although the present work does not necessarily seek to provide optimal references, and from works on reference generation for highly accurate CNC machines, e.g. Huo and Poo (2012) and Matsubara et al. (2011). It is important to emphasise that the references are generated in open-loop through an FBRM in Matsubara et al. (2011), whereas they are directly synthesised by a computer in Huo and Poo (2012). The references are generated likewise by the proposed RM, i.e. through direct computer synthesis. The motivation for developing the path generation scheme came naturally, as it consists in an extension of the previous objective to multiple DoF motion. 15
2. Introduction
2.4 Literature review Naeem et al. (2003) reviewed several guidance laws relevant to UUVs, with an emphasis on AUVs, and asserted that `the main problem in bringing autonomy to any vehicle lies in the design of a suitable guidance law'. Breivik and Fossen (2009) carried out another survey of the same subject keeping the emphasis on AUVs, but taking planar and spatial motion into account. Among other conclusions, Naeem et al. (2003) stated that, `in practice, Line-of-Sight (LoS) guidance is the key element of all guidance systems', given that the closed-loop path following scheme suits best the needs when it comes to guiding underactuated vehicles. That work made evident the fact that the research on guidance has historically been focusing mainly on underactuated vehicles such as missiles and aircrafts, whose complex guidance problems have been dealt with since the World War II (Breivik and Fossen, 2009). An example of early MCS for UUVs based on the LoS guidance is the work by Healey and Lienard (1993). Improvements aiming at compensating for heading disturbances caused by the sea current can be found in e.g. Aguiar and Pascoal (1997). Fossen and Pettersen (2014) proved that the equilibrium point of the proportional LoS guidance law by Healey and Lienard (1993) is Uniformly Semi-Globally Exponentially Stable (USGES). The work by Caharija et al. (2014) aims at merging intuitive and theoretical perspectives of the integral LoS guidance for current compensation problems of underactuated ships. The technical challenges underactuated vehicles impose on the reference generation, due to their non-holonomic kinematic constraints (Aicardi et al., 2000; Egeland et al., 1996), justify the attention they have received. The LoS and LoS-based guidance laws are still often employed to guide ROVs, e.g. Omerdic et al. (2012), Sørensen et al. (2012), and Caccia (2006), due to their simplicity and ease of implementation (Breivik and Fossen, 2009; Naeem et al., 2003). An example of LoS-based conjoint guidance and control scheme that generates reference heading to steer an ROV towards the destination point employing a Lyapunov-based algorithm to ensure smoothness and convergence is given by Caccia et al. (1998). The approach was re�ned in Caccia and Veruggio (2000). A similar MCS by Guo et al. (2003), conceived to control the motion of AUVs, employs a sliding mode fuzzy algorithm in place of the Lyapunov-based algorithm. Dukan (2014) proposed a spatial LoS guidance strategy dedicated to guide fully actuated ROVs. The interested reader is referred to Caharija (2014) and Lekkas (2014), and the references therein, when it comes to more recent extensions regarding the LoS and LoS-based guidance laws for underactuated marine vehicles. Both latter references also furnish good literature review on LoS and LoS-based guidance laws. There are relatively fewer publications which propose guidance schemes unrelated to the LoS guidance. As an example, Børhaug et al. (2006) developed an optimal guidance scheme for cross-track control of UUVs that optimises the rate of convergence of the vehicles towards the reference paths, while keeping both the 16
2.4. Literature review desired course angle and the rate of turn bounded. Kim and Ura (2003) proposed an optimal guidance law that enables an AUV, subject to the sea current, to reach the terminal position under the minimum fuel consumption. The guidance law is formulated as a two-point boundary value problem based on the Euler-Lagrange equations. Other alternatives of integrated guidance and control schemes can be obtained through the use of the so-called manoeuvring theory, see e.g. Fossen (2011), Skjetne (2005), Skjetne et al. (2004a), Encarnação and Pascoal (2001a), Encarnação and Pascoal (2001b), Encarnação and Pascoal (2001c), Hauser and Hindman (1995), and the references therein. The manoeuvring problem involves performing two tasks, namely a geometric task and a dynamic task. The geometric task consists in converging to, and then following, a reference path, whereas the dynamic task consists in satisfying a dynamic behaviour along the reference path (Fossen, 2011; Skjetne, 2005). The tasks do not have to be performed simultaneously, and the geometric one has higher priority. It ensures that at least path following is performed when trajectory tracking cannot be performed due to inherent limitations of the closed-loop system, e.g. unstable zero dynamics, exogenous disturbances, etc. (Skjetne, 2005). Trajectory tracking is a special case of the manoeuvring problem, where both tasks have to be performed simultaneously. There are some similarities and subject overlap � e.g. path generation and path parametrisation � between the manoeuvring theory and the path generation scheme dealt with in Part II of this thesis. ROV-based missions neither typically need high autonomy levels, nor present technical challenges with respect to non-holonomic constraints. On the other hand, repetitive missions, and missions which require accurate motion control, claim some degree of automation. Furthermore, ROV pilots may feel exhausted and less attentive during long-lasting missions, and these factors may lead to riskier and more expensive missions. The reader is referred to Dukan (2014), Vasilijevi¢ et al. (2013), Ho et al. (2011), Hsu et al. (2000), Pioch et al. (1997), and Yoerger et al. (1986) for discussions about the complexity of the ROV piloting task and the challenges it entails. Experienced pilots have a�rmed that every contribution towards automating ROV-based missions is e�ective not only in increasing the overall motion control accuracy level, but also in improving the global mission performance (Hsu et al., 2000). Assisted joystick control (Dukan, 2014; Dukan and Sørensen, 2012), also known as joystick in closed-loop control, partially compensates for dynamical and environmental motion disturbances, in order for the pilot to more easily guide an ROV based on the typically relatively poor visual feedback of position and velocity that characterises the motion control with a human being in the loop. Unassisted joystick control, with automatic heading and depth control, is currently the most common con�guration of the commercially available ROVs (Christ and Wernli, 2014, 2007). Fully-actuated ROVs permit high-performance motion control to be exercised through trajectory tracking and DP. A collection of guidance techniques, ranging from open17
2. Introduction loop FBRMs to closed-loop optimisation-based reference generators, suitable for guiding the motion of fully-actuated UUVs can be found in Fossen (2011) and in the references therein. The simplest, yet e�ective, technique consists of an FBRM built upon a 2nd- or 3rd-order Low-Pass Filter (LPF) Transfer Function (TF), see Appendix B. It can be easily implemented and modi�ed, and runs fast, even in a digital computer with modest hardware. Its main drawback lies in its linearity, because, for any �xed tuning, the generated velocities and accelerations are linearly proportional to the distances to be covered (Fernandes et al., 2012; Fossen, 2011). Fossen (2011) presents alternatives to partially remedy the problem. Some of them are revisited in Appendix B. Linear FBRMs stem from the Model Reference Adaptive Control (MRAC) technique (Landau, 1974), and are commonly employed in trajectory tracking control systems to improve the closedloop transient response (Åström and Hägglund, 2011; Slotine and Li, 2005).
18
Chapter 3
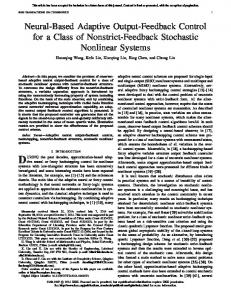
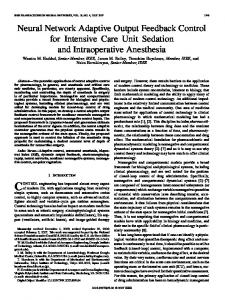
Reference model 3.1 Introduction The proposed RM synthesises position, velocity, and acceleration references of classes C 2 , C 1 , and C 0 , respectively, for guiding a single DoF motion, either linear or angular, in a suboptimal manner with regard to time. The di�erentiability class C n , n ∈ N, denotes a function whose n-th derivative with respect to time exists and is continuous on the domain of de�nition of the function. The condition of suboptimality has harmless implications in practice. It is mostly a consequence of the fact that the RM has to re�ect the constraints associated with the dynamics of the guided ROV, e.g. limited acceleration and velocity. This point becomes clearer when the shapes of the references synthesised by the RM, seen in e.g. Figure 3.2, are compared with the shapes of the (theoretical) optimal curves shown and discussed in Section 3.2. The maximum � or minimum, depending on the motion direction � synthesised velocity is kept for the longest time span possible, as shown in Figure 3.2. Such velocity regime is intended to:
• induce steadier hydrodynamic e�ects, thereby inducing less plant parameter variations; • induce high overall motion accuracy despite the challenging operating conditions the marine vessels are subject to; • demand steadier thrust forces and moment from the propulsion system, thereby promoting energy saving. These factors together favour the attainment of small reference tracking errors. In cases where adaptive controllers/observers are used, these factors also provide more favourable conditions for them to (faster and more robustly) estimate and cope with unknown plant parameter variations and current-generated perturbations. Furthermore, the proposed RM is tuned through meaningful parameters. 19
3. Reference model The RM generates references via direct computer synthesis, similarly to Huo and Poo (2012). Thus, repeatability, �nite convergence time, and facilitated interaction with the references while they are being synthesised, e.g. starting, pausing, resuming, and aborting, can be achieved. The shapes of the synthesised references keep much resemblance with those considered better in Kumar et al. (2005). Both cited references, among others, served as the inspiration for the development of the proposed RM. Check Section 2.3 for details. The basic version of the RM described in Section 3.3 serves as the basis for the description of an extended version found in Section 3.4.
3.2 Optimal curve shapes Figure 3.1 shows the shapes of the optimal acceleration, velocity, and position curves along a straight line path which is to be traversed under the condition of constrained acceleration and velocity. The velocity curve is optimal in the sense that it yields the shortest travelling time Tmin := t3 − t0 [s] between both path's extremities, which are separated by the distance d ∈ R>0 [m]. The path is to be traversed under the additional constraints: i) a(t0 ) = v(t0 ) = p(t0 ) = 0; and ii) a(t3 ) = v(t3 ) = 0 and p(t3 ) = d. Symmetry between the maximum acceleration and deceleration is assumed for the sake of simplicity without loss of generality. Let these maximum values be equal to ±amax , where amax ∈ R>0 [m/s2 ]. Let, in addition, the maximum velocity be equal to vmax ∈ R>0 [m/s]. It is immediate to verify the claim that v(t) is optimal by realising that for any function a0 (t) : T → R, where a0 (t) is a continuous function de�ned on the compact set T ⊂ R | T := {t ∈ R | t ∈ [t0 , t3 ]}, such that |a0 (t)| < |a(t)|, the result � Z t3�Z t3 0 0 p (t0 , t3 ) = a (t) dt dt = d0 < d (3.1) t0
t0
is obtained. Hence, travelling times greater than Tmin are needed to eventually cover the entire distance d. It is worth knowing that
a(t) := amax (H(t − t0 ) − H(t − t1 ) − H(t − t2 ) + H(t − t3 ))
(3.2)
where H(·) is the unit step function, see Appendix D for details, whereupon � Z t3�Z t3 p(t0 , t1 , t2 , t3 ) = a(t) dt dt t0 t0 (3.3) � amax � 2 2 2 (t3 − t0 ) − (t3 − t1 ) − (t3 − t2 ) = d = 2 This claim can be alternatively formulated and proved in the framework of the calculus of variations (van Brunt, 2004; Forsyth, 1960). 20
3.2. Optimal curve shapes
Figure 3.1: Optimal curve shapes.
Figure 3.2: Shapes of the references synthesised by the reference model.
21
3. Reference model
3.3 Description of the basic version The references are parameterised by the parameter time t ∈ R>0 [s]. They are synthesised through a combination of functions distributed into four consecutive phases, as seen in Figure 3.2, where each function is active only during a certain amount of time, such that
a(t) := a1 (t) + a2 (t) + a3 (t) + a4 (t)
(3.4)
v(t) := v1 (t) + v2 (t) + v3 (t) + v4 (t)
(3.5)
p(t) := p1 (t) + p2 (t) + p3 (t) + p4 (t)
(3.6)
where a(t) [m/s2 ], v(t) [m/s], and p(t) [m] denote the acceleration, velocity, and position references, respectively. The subscripts `1 ' through `4 ' identify the phases. Every phase is separately described in Subsections 3.3.1�3.3.4. The required precomputations are introduced in Subsection 3.3.5. Each tuning parameter is explained on the spot where it is mentioned for the �rst time. Table 3.1 collects and summarises all tuning parameters in advance, including those related only to the extended version found in Section 3.4. They are divided into two categories. One category includes the tuning parameters which are frequently readjusted to satisfy the application needs � the �rst six table entries. The third and fourth tuning parameters, i.e. Vi and Vf , are meaningless when it comes to the basic version of the RM. The second category includes the last four table entries. These tuning parameters hardly ever require readjustments, once they are satisfactorily tuned for a particular use with a speci�c ROV. Table 3.1: Tuning parameters of the reference model
22
Parameter
Description
Unit
L Vd Vi Vf Ta Td
Path length (straight line) Desired cruise velocity Desired initial velocity (Extended version only) Desired �nal velocity (Extended version only) Desired minimum time to reach Vd Desired minimum time to stop from Vd
[m] [m/s] [m/s] [m/s] [s] [s]
�L θa θd θ0
Minimum fraction of L to be traversed at vm Function switching threshold Function switching threshold Function switching threshold
[−] [−] [−] [−]
3.3. Description of the basic version
3.1. A linear motion has been chosen to be used in the explanation given throughout Section 3.3, without loss of generality. Should an angular motion be guided, it is enough to consider L in `rad' or `◦ ' (degree), and Vd in `rad/s' or `◦/s', in Table 3.1. Remark
3.3.1 First phase: the acceleration phase This phase is characterised by the modulus of the velocity reference increasing from zero to virtually the maximum value, see Figure 3.2. The phase is split into two subphases in which the modulus of the acceleration reference �rstly increases from zero to virtually the maximum absolute acceleration, and thence decreases to virtually zero again. In this phase, the references are de�ned as
a1 (t) := am f11 (t) h11 (t) + am f12 (t) h12 (t)
(3.7)
v1 (t) := am ((t − t0 ) − τ11 f11 (t)) h11 (t) + vm (1 − (1 − θa ) f12 (t)) h12 (t)
(3.8)
2 p1 (t) := am ((t − t0 )2 /2 − τ11 (t − t0 ) + τ11 f11 (t)) h11 (t)
+ (P1 + vm ((t − t1 ) − (1 − θa ) τ12 (1 − f12 (t)))) h12 (t)
(3.9)
where am ∈ R [m/s2 ] is the maximum � or minimum, depending on the motion direction � acceleration, vm ∈ R [m/s] is the maximum � or minimum, depending on the motion direction � velocity, τ11 , τ12 ∈ R>0 [s] are time constants respectively associated with the 1st and 2nd subphases, t0 ∈ R>0 [s] is the instant at which this phase begins, and t1 ∈ R>0 | t1 > t0 [s] is the instant at which the 2nd subphase begins, when the velocity reference reaches the threshold v1 (t1 ) = vm θa [m/s], where θa ∈ R | θa ∈ [0.6, 1) is the tuning parameter (see Table 3.1) that de�nes the fraction of vm at which the velocity reference starts getting bent as it proceeds towards vm . Lastly, P1 ∈ R | P1 := p1 (t− 1 ) [m], where t− denotes t % t , i.e. parameter t tending to t from the left. The expressions of 1 1 1 am , vm , τ11 , τ12 , t1 , and P1 are given in Subsection 3.3.5. The auxiliary functions f11 (t) and f12 (t) are de�ned as
f11 (t) := 1 − exp(−(t − t0 )/τ11 )
(3.10)
f12 (t) := exp(−(t − t1 )/τ12 )
(3.11)
It is worthwhile to realise that (3.10)�(3.11) can virtually make limt→t1 a1 (t) = am [m/s2 ], i.e. virtually render (3.7) continuous. The functions h11 (t) and h12 (t), which are the characteristic functions of the half-closed �nite intervals [t0 , t1 ) and [t1 , t2 ), respectively, are de�ned as
h11 (t) := H(t − t0 ) − H(t − t1 )
(3.12) 23
3. Reference model h12 (t) := H(t − t1 ) − H(t − t2 )
(3.13)
where H(·) is the unit step function, see Appendix D for details, and t2 ∈ R>0 | t2 > t1 [s] is the instant at which this phase ends, when the acceleration reference reaches the threshold a1 (t− 2 ) := θ0 am , beyond which the acceleration reference virtually vanishes, where t− 2 denotes t % t2 , i.e. parameter t tending to t2 from the left, and θ0 ∈ R>0 | θ0 � 1 is another tuning parameter (see Table 3.1), which is discussed within the next subsubsection. The expression of t2 is furnished in Subsection 3.3.5.
3.3.2 Second phase: the constant velocity phase This phase is characterised by the (constant) cruise velocity vm , see Figure 3.2. In this phase, the references are de�ned as
a2 (t) := 0 h2 (t)
(3.14)
v2 (t) := vm h2 (t)
(3.15)
p2 (t) := (P2 + vm (t − t2 )) h2 (t)
(3.16)
where P2 ∈ R | P2 := p1 (t− 2 ) [m]. The expression of P2 is furnished in Subsection 3.3.5. The function h2 (t), which is the characteristic function of the half-closed �nite interval [t2 , t3 ), is de�ned as
h2 (t) := H(t − t2 ) − H(t − t3 )
(3.17)
3.2. Every reference undergoes a step discontinuity of negligibly small magnitude at the transition from the 1st phase to the 2nd phase due to the presence of the exponential function in (3.11). The lesser θ0 , the lesser the magnitudes of the step discontinuities. On the other hand, the lesser θ0 , the longer the 1st phase lasts, hence causing the cruise velocity vm to be reduced. For instance, if θ0 = exp(−7) and am = 1 m/s2 , then a(t2 ) undergoes a step of magnitude |θ0 am | < 9.12 × 10⁻⁴ m/s2 (< 0.1 %). Likewise, if vm = 1 m/s, then v(t2 ) undergoes a step of magnitude (1 − θa ) θ0 vm < 9.12 × 10⁻⁴ m/s (< 0.1 %). Likewise, if τ12 = 1 s, then p(t2 ) undergoes a step of magnitude (1−θa ) θ0 τ12 < 9.12×10⁻⁴ m. If θ0 = exp(−11.11) ≈ 1.5 × 10⁻⁵ instead, whereas all other values are kept the same as before, the step discontinuities would virtually disappear in the face of quantisation (Åström and Wittenmark, 1997), if the RM was implemented in a 16-bit digital system, given that 2−16 ≈ 1.53 × 10⁻⁵ yields the resolution of ≈ 0.0015 %. Therefore, in this work, it is de�ned that exp(−13) 6 θ0 6 exp(−7). Remark
24
3.3. Description of the basic version
3.3.3 Third phase: the deceleration phase This phase is characterised by the modulus of the velocity reference decreasing from the maximum value, i.e. |vm |, to virtually zero, see Figure 3.2. The phase is split into two subphases in which the modulus of the acceleration reference �rstly increases from zero to virtually the maximum absolute deceleration, and thence decreases to virtually zero again. In this phase, the references are de�ned as
a3 (t) := dm f31 (t) h31 (t) + dm f32 (t) h32 (t)
(3.18)
v3 (t) := (vm + dm ((t − t3 ) − τ31 f31 (t))) h31 (t) + vm θd f32 (t) h32 (t)
(3.19)
2 p3 (t) := dm ((t − t3 )2 /2 − τ31 (t − t3 ) + τ31 f31 (t)) h31 (t)
+ (P3 + vm (t − t3 )) h31 (t) + (P4 + vm θd τ32 (1 − f32 (t))) h32 (t)
(3.20)
where dm ∈ R [m/s2 ] is the maximum � or minimum, depending on the motion direction � deceleration, τ31 , τ32 ∈ R>0 [s] are time constants respectively associated with the 1st and 2nd subphases, t3 ∈ R>0 | t3 > t2 [s] is the instant at which this phase begins, t4 ∈ R>0 | t4 > t3 [s] is the instant at which the 2nd subphase begins, when the velocity reference reaches the threshold v3 (t4 ) = vm θd [m/s], where θd ∈ R | θd ∈ (0, 0.4] is the tuning parameter (see Table 3.1) that de�nes the fraction of vm at which the velocity reference starts getting bent as it proceeds − towards zero. Lastly, P3 ∈ R | P3 := p2 (t− 3 ) [m], where t3 denotes t % t3 , i.e. par− ameter t tending to t3 from the left, and P4 ∈ R | P4 := p3 (t− 4 ) [m], where t4 denotes t % t4 , i.e. parameter t tending to t4 from the left. The expressions of dm , τ31 , τ32 , t3 , t4 , P3 , and P4 are given in Subsection 3.3.5. The auxiliary functions f31 (t) and f32 (t) are de�ned as
f31 (t) := 1 − exp(−(t − t3 )/τ31 )
(3.21)
f32 (t) := exp(−(t − t4 )/τ32 )
(3.22)
It is worthwhile to realise that (3.21)�(3.22) can virtually make limt→t4 a3 (t) = dm [m/s2 ], i.e. virtually render (3.18) continuous. The functions h31 (t) and h32 (t), which are the characteristic functions of the half-closed �nite intervals [t3 , t4 ) and [t4 , t5 ), respectively, are de�ned as
h31 (t) := H(t − t3 ) − H(t − t4 )
(3.23)
h32 (t) := H(t − t4 ) − H(t − t5 )
(3.24)
where t5 ∈ R>0 | t5 > t4 [s] is the instant at which this phase ends, when the acceleration reference reaches the threshold a3 (t− 5 ) := θ0 dm , beyond which the acceleration reference virtually vanishes, where t− 5 denotes t % t5 , i.e. parameter t tending to t5 from the left. The expression of t5 is furnished in Subsection 3.3.5. 25
3. Reference model
3.3.4 Fourth phase: the constant position phase This phase is characterised by the constant position reference, see Figure 3.2. In this phase, the references are de�ned as
a4 (t) := 0 h4 (t)
(3.25)
v4 (t) := 0 h4 (t)
(3.26)
p4 (t) := sgn(vm ) L h4 (t)
(3.27)
where L ∈ R>0 [m] is the tuning parameter (see Table 3.1) that de�nes the (straight line) path length. The function h4 (t), which is the characteristic function of the closed semi-in�nite interval [t5 , ∞), is de�ned as
h4 (t) := H(t − t5 )
(3.28)
3.3. Every reference undergoes another step discontinuity of negligibly small magnitude at the transition from the 3rd phase to the 4th phase due to the presence of the exponential function in (3.22).
Remark
3.3.5 Pre-computation Let the time ratio rT ∈ R>0 be de�ned as
rT := Ta /Td
(3.29)
where Ta ∈ R>0 [s] is the tuning parameter (see Table 3.1) that de�nes the desired minimum time to reach Vd ∈ R \ {0} [m/s], which is the tuning parameter (see Table 3.1) that de�nes the desired cruise velocity, and Td ∈ R>0 [s] is the tuning parameter (see Table 3.1) that de�nes the desired minimum time to stop moving from Vd . These parameters translate the desired maximum � or minimum, depending on the motion direction � acceleration and deceleration through the direct relations `Vd /Ta ' and `−Vd /Td ', respectively. Let the auxiliary constants κa , κd ∈ R>0 be de�ned as
κa :=
θa2 ((ξa − exp(−ξa ))2 − 2 (ξa − 1)) 2 (ξa − 1)2
(3.30)
− (1 − θa )2 (1 − θ0 ) − (1 − θa ) ln(θ0 ) κd := −
(1 − θd )2 (ξd − exp(−ξd ))2 + θd2 (1 − θ0 ) 2 (ξd − 1)2
(1 − θd )2 + (1 − θd )(ξd − exp(−ξd )) + ξd − 1 26
(3.31)
3.3. Description of the basic version where ξa , ξd ∈ R>0 are constants. The greater ξa and ξd , the steeper the slopes of the references during the 1st subphases of the 1st and 3rd phases, respectively, since these constants directly in�uence the time constants de�ned in (3.38) and (3.40) ahead. Even though ξa and ξd are not primarily designed to be tuning parameters, it can be useful to be able to change their values. Hence, it is de�ned that 10 6 ξa , ξd 6 15 in this work. Then, the candidate absolute value vc ∈ R>0 [m/s] for the cruise velocity is de�ned as s � � 1 − min{�L , 0.1} |Vd | (3.32) vc := L κa rT + κd Td where �L ∈ R>0 | �L < 0.1 is the tuning parameter (see Table 3.1) that de�nes the minimum fraction of the path length L that is to be traversed at the cruise velocity vm , which is de�ned as
vm := sgn(Vd ) min{vc , |Vd |}
(3.33)
The adjusted minimum time to stop moving from vm , i.e. td ∈ R>0 [s], and the adjusted minimum time to reach vm , i.e. ta ∈ R>0 [s], are de�ned as
td := (vm /Vd ) Td
(3.34)
ta := rT td
(3.35)
The maximum � or minimum � acceleration and deceleration are de�ned as
am := vm /ta
(3.36)
dm := −(vm /td )
(3.37)
Notice that vm /ta = Vd /Ta in (3.36) and −(vm /td ) = −(Vd /Td ) in (3.37). The time constants τ11 through τ32 are de�ned as
τ11 := θa ta /(ξa − 1)
(3.38)
τ12 := (1 − θa ) ta
(3.39)
τ31 := (1 − θd ) td /(ξd − 1)
(3.40)
τ32 := θd td
(3.41)
The auxiliary time instants Ti ∈ R>0 [s], i ∈ {1, 2, 3, 4, 5}, where Ti := t− i , are de�ned as
T1 := ξa τ11
(3.42) 27
3. Reference model T2 := −τ12 ln(θ0 )
(3.43)
T3 := |L/vm | − (κa ta + κd td )
(3.44)
T4 := ξd τ31
(3.45)
T5 := −τ32 ln(θ0 )
(3.46)
such that the function switching time instants ti , i ∈ {1, 2, 3, 4, 5}, are consecutively de�ned, with respect to the initial instant t0 , as
ti := Ti + t(i−1)
(3.47)
Finally, the positions Pi , i ∈ {1, 2, 3, 4}, are respectively de�ned as 2 P1 := am (T12 /2 − τ11 T1 + τ11 (1 − exp(−ξa )))
(3.48)
P2 := P1 + vm (T2 − (1 − θa ) τ12 (1 − θ0 ))
(3.49)
P3 := P2 + vm T3
(3.50)
2 P4 := P3 + vm T4 + dm (T42 /2 − τ31 T4 + τ31 (1 − exp(−ξd )))
(3.51)
where the relation T1 /τ11 = ξa , which is used in (3.48), stems from (3.42), the relation T2 /τ12 = − ln(θ0 ), which is used in (3.49), stems from (3.43), and the relation T4 /τ31 = ξd , which is used in (3.51), stems from (3.45).
3.3.6 Implementation examples Scripts A.1�A.2 in Appendix A furnish ready-made implementation examples of the basic version of the RM. The examples are coded in MATLABr and can easily be converted to other programming languages, e.g. LabVIEWr , C++, and C#.
3.3.7 Results from full-scale sea trials This subsection presents selected results from two full-scale sea trials based on the ROV Minerva, see Appendix C. The experiments were carried out in Trondheimsfjorden, Norway, in October, 2011. The four DoF MCS used to carry out the experiments was that reported in Sørensen et al. (2012) � essentially an output feedback control system comprised of a PID controller and an EKF �, with the guidance system running the algorithm of the basic version of the RM reported in Fernandes et al. (2012). The MCS was implemented on a compact Recon�gurable Input/Output (cRIO) module, and programmed via LabVIEWr for Microsoft Windows, both by National Instruments. The MCS ran at the constant sampling frequency of 5 Hz � sampling period of 200 ms. 28
3.3. Description of the basic version Both experiments consisted in a 50 m-long surge motion along a straight line heading northwards from the local origin of the North-East-Down (NED) reference frame. This fact implied that ψd (t) = 0◦ , whereupon J (ψd (t)) = I4 in (4.2), T where I4 ∈ R4×4 is an identity matrix, ηd = [ p(t), 0, 0, 0 ] � vector of desired T position and heading in the NED frame �, νd = [ v(t), 0, 0, 0 ] � vector of desired linear and angular velocities in the Body-Fixed (BF) reference frame �, T and ν˙ d = [ a(t), 0, 0, 0 ] � vector of desired linear and angular accelerations in the BF frame � in (4.1)�(4.4), respectively. Detailed information on ηd , νd , and ν˙ d is given in Section 4.1, where reference generation for multiple DoF motion is treated separately. The �rst experiment focused on the proposed RM. The second experiment consisted in a simple comparison of performance and energy consumption along the motion. Regarding the latter experiment, the same movement was repeated twice, in the same direction and taking virtually the same time, once guided by the proposed RM, and once guided by a Linear Time Invariant (LTI) FBRM, see Appendix B.
1st experiment: proposed RM only The tuning parameters of the RM were L = 50 m, Vd = 0.3 m/s, Ta = Td = 20 s, �L = 0.05, θa = 0.8, θd = 0.2, and θ0 = exp(−11.¯1), see Table 3.1 for details. Figure 3.3 depicts separately the elements of the position and heading vector. The maximum absolute spatial position error was < 0.5 m (based on the estimated position), with maximum absolute depth error < 0.1 m. The maximum absolute heading error was < 4◦ . Satisfactory tracking performance was attained, despite the challenging operating conditions underwater, because the references were suitable for tracking. Figure 3.4 depicts separately the elements of the vector of linear and angular velocities. The references were closely tracked, as in the previous �gure, because the tuning of the RM re�ected the bandwidth limitations of the guided ROV. Figure 3.5 depicts the commanded rotations of the propellers. The curves regarding the starboard and port thrusters are nearly �at, somewhat mimicking the shape of the desired surge velocity ud (t) in Figure 3.4. The curve related to the lateral thruster oscillated gently in order to compensate for motion disturbances, thereby maintaining the desired position and heading. The curve related to the vertical thruster remained practically �at all the time. This means that both vertical thrusters worked practically only to keep the ROV at the desired depth, by counteracting her slightly positive buoyancy. These four curves corroborate the claim that the RM guides motion that demands steadier thrust forces and moments from the propulsion system. 29
ψ [◦ ]
d [m]
e [m]
n [m]
3. Reference model 40 20 0 0.2 0 −0.2 80.05 80 79.95 2 0 −2 0
Reference Measured Estimated
50
100 Time [s]
150
200
r [◦/s]
w [m/s] v [m/s] u [m/s]
Figure 3.3: Position and heading (NED frame).
0.3 0.2 0.1 0 0.04 0 −0.04 0.02 0 −0.02 2 1 0 −1 0
Reference Measured Estimated
50
100 Time [s]
150
200
Figure 3.4: Linear and angular velocities (BF frame).
2nd experiment: proposed RM versus LTI FBRM The tuning parameters of the RM were L = 50 m, Vd = 0.25 m/s, Ta = Td = 5 s, �L = 0.05, θa = 0.9, θd = 0.15, and θ0 = exp(−11.8), see Table 3.1 for details. 30
3.3. Description of the basic version ST [rpm]
500 0 −500
Starboard thruster
PT [rpm]
500 0 −500 500 0 −500
Port thruster
LT [rpm]
Lateral thruster
VT [rpm]
−680 −780 0
50
Vertical thrusters 100 Time [s]
150
200
Figure 3.5: Commanded propeller rotations (Legend: L = Lateral, P = Port, S = Starboard, T = Thruster, and V = Vertical).
50 FBRM
n [m]
40 30
RM
20 Reference Measured Estimated
10 0 0
30
60
90
120 Time [s]
150
180
210
Figure 3.6: North position comparison (N-axis of the NED frame).
The tuning parameters of the LTI FBRM were ω = 0.045 rad/s (undamped natural frequency) and ζ = 1 (damping ratio), see Appendix B for details. 31
3. Reference model 2
RM FBRM
|nd − n| [m]
1.5
1
0.5
0 0
30
60
90
120 Time [s]
150
180
210
Figure 3.7: First absolute tracking error comparison (N-axis of the NED frame).
RM FBRM
|nd − n ˆ | [m]
0.4
0.3
0.2
0.1
0 0
30
60
90
120 Time [s]
150
180
210
Figure 3.8: Second absolute tracking error comparison (N-axis of the NED frame).
Figure 3.6 depicts the motion along the N-axis of the NED frame only. The other three elements of the position and heading vector are ignored on the grounds 32
3.3. Description of the basic version that they were similar to those seen before, see Figure 3.3. Figures 3.7�3.8 depict the corresponding absolute tracking errors regarding the measured and estimated values, respectively. It is clear that the movement guided by the RM was more accurate than that guided by the FBRM. This comparison corroborates the claim that the RM induces high overall motion accuracy despite the challenging operating conditions the marine vessels are subject to. The tracking error peaks occurred at the beginning and at the end of the movement guided by the RM were due to the aggressive tuning, i.e. Ta = Td = 5 s turned out to be slightly too short. Figure 3.9 depicts the surge velocities. The desired velocity synthesised by the RM was �atter and lower than that synthesised by the FBRM. The Root-MeanSquare (RMS) values of the desired velocities (see Appendix D) were ≈ 0.2362 m/s and ≈ 0.3097 m/s, respectively. The latter value is ≈ 31 % higher than the former value. Such di�erence is sharp in Figure 3.9. Through the use of the Morrison's equation (Lewandowski, 2004; Faltinsen, 1990; Newman, 1977; Abkowitz, 1972)
Fdrag = 0.5 ρ A Cdrag U 2
(3.52)
where ρ is the water density, A is the reference area de�ned on a plane perpendicular to the motion direction, Cdrag is a (dimensionless) drag coe�cient, and U is the motion velocity, it is possible to infer that the induced RMS drag forces were ≈ 16.42 N and ≈ 28.22 N, respectively. The latter value is ≈ 72 % higher than the former value. The values considered above were ρ = 1025 kg/m3 , A = 0.66 m2 (for ψ = 0◦ ), and Cdrag = 0.87. As expected, the smaller and steadier the experienced drag force, the better the operating conditions for the MCS, whereupon the more accurate the motion. It is not a coincidence that the highest tracking errors shown in Figures 3.6�3.8, regarding the movement guided by the FBRM, occurred during the �rst half of the experiment. The curves in Figure 3.9 corroborate the claims: i) steadier hydrodynamic e�ects are induced by the RM; and ii) high overall motion accuracy is induced by the RM, despite the challenging operating conditions the marine vessels are subject to. Figure 3.10 depicts the commanded rotations of the propellers. The curves associate with the movement guided by the RM were �atter and of lower amplitudes than those associate with the movement guided by the FBRM. Notice, in particular, the struggle of the lateral propeller under the FBRM to ensure that the ROV closely tracks the position reference and keeps the desired heading, especially during the �rst half of the experiment, given that there is signi�cant coupling among all DoFs. The vertical propellers were commanded to strive likewise, in order for the ROV to keep the desired constant depth. The power delivered by a propeller can be inferred from the commanded rotation through the formula (Sørensen, 2013) 3 Pprop = 2 π ρ D5 KQ |ωcomm |
(3.53) 33
3. Reference model 0.6
Reference Measured Estimated RMS values
FBRM 0.5 u [m/s]
0.4 0.3 RM
0.2 0.1 0 0
30
60
90
120 Time [s]
150
180
210
VT [rpm]
LT [rpm]
PT [rpm]
ST [rpm]
Figure 3.9: Surge velocity comparison (X-axis of the BF frame).
1000 500 0 −500 1000 500 0 −500 500 0 −500 −1000 0 −500 −1000 0
RM FBRM
Starboard thruster
Port thruster
Lateral thruster Vertical thrusters
30
60
90
120 Time [s]
150
180
210
Figure 3.10: Commanded propeller rotations (Legend: L = Lateral, P = Port, S = Starboard, T = Thruster, and V = Vertical).
where D is the thruster nozzle diameter, KQ is a (dimensionless) torque coe�cient, and ωcomm [rps] or [Hz] (notice the unit) is the angular velocity of the pro34
3.4. Description of an extended version peller shaft. When it comes to the horizontal propellers of Minerva, the values to be considered are DS = DP = 0.22 m and KQS = KQP = 0.043 (Starboard and port thrusters), and DL = 0.19 m and KQL = 0.089 (Lateral thruster). Therefore, regarding the movement guided by the RM, it is possible to infer that the RMS power delivered by the starboard and port propellers together was PS+P ≈ 231 W, whereas the RMS power delivered by all the horizontal propellers together was PS+P+L ≈ 245 W, provided that the RMS commanded rotations, concerning the starboard, port, and lateral propellers, were ≈ 604 rpm, ≈ 506 rpm, and ≈ 277 rpm, respectively. Similarly, regarding the movement guided by the FBRM, it is possible to infer that the RMS power delivered by the starboard and port propellers together was PS+P ≈ 324 W, whereas the RMS power delivered by all the horizontal propellers together was PS+P+L ≈ 435 W, provided that the RMS commanded rotations, concerning the starboard, port, and lateral propellers, were ≈ 605 rpm, ≈ 645 rpm, and ≈ 553 rpm, respectively. Both values of power under the FBRM are much higher than the corresponding values under the RM. Namely, PS+P is ≈ 40 % higher, whereas PS+P+L is ≈ 78 % higher, under the FBRM. These di�erences are already signi�cant, but they could be even higher, if the power delivered by the vertical thruster had been also taken into account. The curves in Figure 3.10 corroborate the claim that steadier thrust forces and moments are demanded from the propulsion system under the RM, thereby promoting energy saving.
3.4 Description of an extended version The extended version builds upon the basic version described in Section 3.3 and, thus, it bears strong resemblance to that version. The synthesised references are likewise structured as in (3.4)�(3.6). Each of the four phases is separately described in Subsections 3.4.1�3.4.4. The required pre-computations are introduced in Subsection 3.4.5. Table 3.1 collects and summarises all tuning parameters. The main di�erences in comparison with the basic version are the following:
• The initial velocity and the �nal velocity can be both di�erent from zero; • The �rst and third phases are skipped depending on the initial and �nal velocities; the second phase is always executed; and the fourth phase is executed whenever the �nal velocity is null; • The cruise velocity is recursively determined through a numerical method.
3.4.1 First phase: the acceleration phase This phase is characterised by the modulus of the velocity reference increasing from the modulus of the initial value, i.e. |vi | = |v(t0 )|, where vi ∈ R [m/s] is derived from Vi ∈ R | Vi = 0 ∨ (|Vi | 6 |Vd | ∧ sgn(Vi ) = sgn(Vd )) [m/s], which is 35
3. Reference model the tuning parameter (see Table 3.1) that de�nes the desired initial velocity, to virtually the maximum value, i.e. |vm | = |v(t2 )|, where vm ∈ R [m/s] is the cruise velocity. This phase is skipped whenever vi = vm . Likewise in the basic version, this phase is split into two subphases. In this phase, the references are de�ned as
a1 (t) := am f11 (t) h11 (t) + am f12 (t) h12 (t) v1 (t) := (vi + am ((t − t0 ) − τ11 f11 (t))) h11 (t) + (vm − (vm − vi )(1 − θa ) f12 (t)) h12 (t) 2 p1 (t) := ((vi − am τ11 )(t − t0 ) + am ((t − t0 )2 /2 + τ11 f11 (t))) h11 (t)
+ (P1 + vm (t − t1 ) − (vm − vi )(1 − θa ) τ12 (1 − f12 (t))) h12 (t)
(3.54) (3.55)
(3.56)
where am ∈ R [m/s2 ] is the maximum � or minimum, depending on the motion direction � acceleration, which is computed as indicated in (3.36), τ11 , τ12 ∈ R>0 [s] are time constants respectively associated with the 1st and 2nd subphases, t0 ∈ R>0 [s] is the instant at which this phase begins, and t1 ∈ R>0 | t1 > t0 [s] is the instant at which the 2nd subphase begins, when the velocity reference reaches the threshold v1 (t1 ) = vi + (vm − vi ) θa [m/s], where θa ∈ R | θa ∈ [0.6, 1) is the tuning parameter (see Table 3.1) that de�nes the fraction of (vm − vi ) at which the velocity reference starts getting bent as it proceeds towards vm . Lastly, P1 ∈ R | P1 := p1 (t− 1 ) [m]. The expressions of vi , vm , τ11 , τ12 , t1 , P1 , and ta , the latter being useful to compute am as in (3.36), are given in Subsection 3.4.5. The functions f11 (t), f12 (t), h11 (t), and h12 (t) are de�ned similarly to those in (3.10)�(3.13).
3.4.2 Second phase: the constant velocity phase This phase is characterised by the cruise velocity vm . In this phase, the references are de�ned as
a2 (t) := 0 h2 (t)
(3.57)
v2 (t) := vm h2 (t)
(3.58)
p2 (t) := (P2 + vm (t − t2 )) h2 (t)
(3.59)
where P2 ∈ R | P2 := p1 (t− 2 ) [m], and t2 ∈ R>0 | t2 > t1 [s] is the instant at which this phase begins. The expressions of P2 and t2 are furnished in Subsection 3.4.5. The function h2 (t) is de�ned similarly to that in (3.17). Notice the similitude between this phase and the second phase of the basic version in Subsection 3.3.2. 36
3.4. Description of an extended version
3.4.3 Third phase: the deceleration phase This phase is characterised by the modulus of the velocity reference decreasing from the maximum value, i.e. |vm | = |v(t3 )|, to virtually the modulus of the �nal value, i.e. |vf | = |v(t5 )|, where vf ∈ R [m/s] is derived from Vf ∈ R | Vf = 0 ∨ (|Vf | 6 |Vd | ∧ sgn(Vf ) = sgn(Vd )) [m/s], which is the tuning parameter (see Table 3.1) that de�nes the desired �nal velocity. This phase is skipped whenever vf = vm . Likewise in the basic version, this phase is split into two subphases. In this phase, the references are de�ned as
a3 (t) := dm f31 (t) h31 (t) + dm f32 (t) h32 (t) v3 (t) := (vm + dm ((t − t3 ) − τ31 f31 (t))) h31 (t) + (vf + (vm − vf ) θd f32 (t)) h32 (t)
(3.60) (3.61)
p3 (t) := (P3 + vm (t − t3 )) h31 (t) 2 + dm ((t − t3 )2 /2 − τ31 (t − t3 ) + τ31 f31 (t)) h31 (t)
(3.62)
+ (P4 + vf (t − t4 ) + (vm − vf ) θd τ32 (1 − f32 (t))) h32 (t) where dm ∈ R [m/s2 ] is the maximum � or minimum, depending on the motion direction � deceleration, which is computed as indicated in (3.37), τ31 , τ32 ∈ R>0 [s] are time constants respectively associated with the 1st and 2nd subphases, t3 ∈ R>0 | t3 > t2 [s] is the instant at which this phase begins, and t4 ∈ R>0 | t4 > t3 [s] is the instant at which the 2nd subphase begins, when the velocity reference reaches the threshold v3 (t4 ) = vf + (vm − vf ) θd [m/s], where θd ∈ R | θd ∈ (0, 0.4] is the tuning parameter (see Table 3.1) that de�nes the fraction of (vm − vf ) at which the velocity reference starts getting bent as it proceeds towards vf . Lastly, − P3 ∈ R | P3 := p2 (t− 3 ) [m], and P4 ∈ R | P4 := p3 (t4 ) [m]. The expressions of dm , vf , τ31 , τ32 , t3 , t4 , P3 , P4 , and td , the latter being useful to compute dm as indicated in (3.37), are given in Subsection 3.4.5. The functions f31 (t), f32 (t), h31 (t), and h32 (t) are de�ned similarly to those in (3.21)�(3.24).
3.4.4 Fourth phase: the constant position phase This phase is characterised by the constant position reference. It is executed whenever vf = 0 m/s. In this phase, the references are de�ned as
a4 (t) := 0 h4 (t)
(3.63)
v4 (t) := vf h4 (t)
(3.64)
p4 (t) := sgn(vm ) L h4 (t)
(3.65) 37
3. Reference model where the function h4 (t) is de�ned similarly to that in (3.28), and the expression of t5 , which appears in (3.28), is furnished in Subsection 3.4.5. Notice the similitude between this phase and the fourth phase of the basic version in Subsection 3.3.4.
3.4.5 Pre-computation Let the adjusted minimum time to reach vm from vi , which is ta ∈ R>0 [s], and the adjusted minimum time to reach vf from vm , which is td ∈ R>0 [s], be given by
ta := (vm /Vd ) Ta
(3.66)
td := (vm /Vd ) Td
(3.67)
and also the maximum (minimum) acceleration and deceleration be de�ned as
am := vm /ta
(3.68)
dm := −(vm /td )
(3.69)
Notice that vm /ta = Vd /Ta in (3.68) and −(vm /td ) = −(Vd /Td ) in (3.69). The time constants τ11 through τ32 are de�ned as �� � � θa ta vm − vi (3.70) τ11 := vm ξa − 1 � � vm − vi τ12 := (1 − θa ) ta (3.71) vm � �� � vm − vf (1 − θd ) td τ31 := (3.72) vm ξd − 1 � � vm − vf θd td (3.73) τ32 := vm The auxiliary time instants Ti ∈ R>0 [s], i ∈ {1, 2, 4, 5}, where Ti := t− i , are de�ned similarly to those in (3.42)�(3.43) and (3.45)�(3.46). Notice that T3 has purposefully been skipped. It is separately treated ahead. The auxiliary lengths L11 , L12 , L2 , L31 , L32 ∈ R>0 [m] are de�ned as (notice the modulus function) 2 L11 := vi T1 + am T12 /2 − am τ11 T1 + am τ11 (1 − exp(−ξa )) (3.74)
L12 := |vm T2 − (vm − vi )(1 − θa ) τ12 (1 − θ0 )| 38
(3.75)
3.4. Description of an extended version 2 (1 − exp(−ξd )) L31 := vm T4 + dm T42 /2 − dm τ31 T4 + dm τ31
(3.76)
L32 := |vf T5 + (vm − vf ) θd τ32 (1 − θ0 )|
(3.77)
L2 := L − (L11 + L12 + L31 + L32 )
(3.78)
Finally, any robust, fast-execution numerical method can be employed to determine vm through the recursive use of (3.66)�(3.78), including the computation of T1 , T2 , T4 , and T5 , such that the three following conditions and L2 > L min{�L , 0.1}, |vm | 6 |Vd |, and (3.79) |vi |, |vf | 6 |vm | are satis�ed with the highest |vm |. To begin with, vm = Vd , vi = Vi , and vf = Vf are tested. If the conditions in (3.79) are not satis�ed, then |vm | < |Vd | is used. Notice that it may also be needed to adjust vi and vf in order to ensure that |vi | 6 |vm | and |vf | 6 |vm |, in case |vm | drops down to less than |Vi | or |Vf |. Then, the positions Pi , i ∈ {1, 2, 3, 4}, are respectively de�ned as
P1 := sgn(Vd ) L11
(3.80)
P2 := sgn(Vd ) L12 + P1
(3.81)
P3 := sgn(Vd ) L2 + P2
(3.82)
P4 := sgn(Vd ) L31 + P3
(3.83)
Lastly, T3 is de�ned as
T3 := |L2 /vm |
(3.84)
and the function switching time instants ti , i ∈ {1, 2, 3, 4, 5}, are consecutively de�ned, with respect to the initial instant t0 , in a similar fashion to those in (3.47).
3.4.6 Implementation example Script A.3 in Appendix A furnishes a ready-made implementation example of this extended version of the RM. The example is coded in MATLABr and can easily be converted to other programming languages, e.g. LabVIEWr , C++, and C#. 39
3. Reference model
3.4.7 Simulation results
p(t) [m]
This subsection presents simulation results regarding the extended version of the RM described in Section 3.4. The RM is studied in isolation, for the sake of clarity. References regarding a single DoF motion were synthesised. The simulation was based on recursive use of the RM thrice. Di�erent features of the RM were explored every time it was run. The constant sampling frequency was 6.¯ 6 Hz � sampling period of 150 ms. The tuning parameters are collected in Table 3.2. See Table 3.1 for details on them.
Position
200 100
a(t) [m/s2 ] v(t) [m/s]
0 Velocity 1 0 Acceleration
0.1 0 −0.1 0
50
100 Time [s]
150
200
Figure 3.11: References synthesised by the extended version of the reference model.
The results are concentrated in Figure 3.11. The 250 m-long motion starts and ends at rest. It is worthwhile to realise that vm = Vd , vi = Vi , and vf = Vf in all the three cases. The vertical dashed red lines separate each case, which begin at 15 s, ≈ 78 s, and ≈ 128 s, respectively. The latter ends at ≈ 224 s. In the �rst case, the fourth phase is skipped, since the desired �nal velocity is not zero. In the second case, the �rst, third, and fourth phases are skipped, because the cruise velocity is held throughout. Finally, in the third case, all phases are executed. In particular, the fourth phase is executed due to the fact that the desired �nal velocity is equal to zero.
3.4. Simulation results concerning a closed-loop MCS are provided in the next chapter, in Section 4.6. Remark
40
3.5. Further features Table 3.2: Tuning parameters of the reference model used in the simulation Parameter
L Vd Vi Vf Ta Td �L θa θd θ0
1st
2nd
3rd
Unit
100 2 0 1 10 10 0.05 0.8 0.2 exp(−13)
50 1 1 1 10 10 0.05 0.8 0.2 exp(−13)
100 1.5 1 0 10 10 0.05 0.8 0.2 exp(−13)
m m/s m/s m/s s s − − − −
3.5 Further features Both the basic and the extended versions of the RM can be coded together, so that they can be somewhat interchangeable. The usage of the tuning parameters can then dictate which version is the best in every case. As an example, let both Script A.1 and Script A.3 in Appendix A be conditionally used, and the criterion to select the more appropriate script be based on the desired initial and �nal velocities, i.e. Vi and Vf , respectively, see Table 3.1 for details. The basic version is used, if and only if Vi = Vf = 0 m/s, with the advantage of being the fastest to precompute the (suboptimal) cruise velocity vm , because it is not dependent on any recursive numerical method. The extended version is used otherwise. So far, both versions of the RM work in open-loop. However, the use of reference and state � either directly measured or estimated � feedback opens up new possibilities. For instance, the following can be listed:
3.5.1 Hysteretic waiting function By monitoring how closely an ROV tracks the synthesised position reference, it is possible to `wait' for the ROV, for how long it is needed, in case the ROV is lagging behind the reference, until the di�erence is reduced to an acceptable value. Since the references are directly synthesised, it is possible to hold the value of the position reference without a�ecting the other references. It is recommended that such a measure is applied only during the second phase, because the acceleration reference is null during that phase, see Figure 3.2. To avoid chattering (Levant, 2010), the simple hysteretic function sketched out in Figure 3.12 can be implemented, where dmax ∈ R>0 [m] is the maximum distance the guided ROV is allowed to lag behind the position reference, and 41
3. Reference model dmin ∈ R>0 | dmin < dmax [m] is the minimum distance the guided ROV has to lag behind the position reference, after she had already lagged at least dmax m behind that reference, in order for the RM to release the synthesised position reference.
Figure 3.12: Sketch of the hysteretic waiting function. A simpler strategy was experimented in practice instead. It consisted in forcing the RM to wait for the guided ROV at the end of the second phase, see Figure 3.2. This strategy serves no useful purpose in practice but, nonetheless, it is useful to illustrate the topic of the present subsection. Moreover, this simpler strategy took no time to be implemented in the original computer code of the basic version of the RM for experimenting purposes. The general conditions and setup of the experiment were the same as those reported in Subsection 3.3.7. The tuning parameters of the RM were L = 50 m, Vd = 0.75 m/s, Ta = Td = 10.7 s, �L = 0.05, θa = 0.9, θd = 0.15, and θ0 = exp(−11.8), see Table 3.1 for details. Another tuning parameter was dmin = 1 m. Figures 3.13�3.14 show selected experimental results. The RM waited for the ROV Minerva from ≈ 80.6 s to ≈ 98.4 s, as she could not track the velocity reference, as planned, whereupon she lagged ≈ 11.4 m behing the position reference. Notice that the velocity reference was not a�ected during the waiting interval the position reference was held constant at ≈ 46.1 m. Remark 3.5. The capacity of waiting for the guided UUV is one of the properties of the manoeuvring framework (Skjetne, 2005).
3.5.2 Emergency stop function If a collision against a stationary object or the seabed, for instance, is in the imminence of happening, it might be a good idea to bring the ROV to a halt within the shortest time possible. Towards this end, a slightly modi�ed version of the third phase of the basic version of the RM (see Figure 3.2) can be coded, such that both the acceleration and the velocity references are quickly zeroed. 42
3.5. Further features 50
(Waiting) Reference Measured Estimated
n [m]
40 30 20 10 0 0
20
40
60 Time [s]
80
100
Figure 3.13: North position (N-axis of the NED frame).
0.6
u [m/s]
0.4 Reference Measured Estimated
0.2 0
−0.2 0
20
40
60 Time [s]
80
100
Figure 3.14: Surge velocity (X-axis of the BF frame).
3.6. The RMs proposed in this chapter � both versions � have many applications in closed-loop control systems in general. Applications other than
Remark
43
3. Reference model motion control of UUVs have only been chosen not to be explored in this chapter. For example, the precise control of the angular position, velocity, and acceleration of a servomotor can be attained through the use of the proposed RMs; any suitable reference trajectory tracking control system can be fed with the references a(t), v(t), and p(t) in (3.4)�(3.6) synthesised by the proposed RMs. Recall that the synthesised references can be obtained directly in radians, or degrees, as remarked in Remark 3.1.
44
Chapter 4
Path generation 4.1 Introduction The path generation scheme proposed in this chapter, also sometimes referred to as the reference generation scheme, takes advantage of the references synthesised by the RM proposed in Chapter 3. The references synthesised by the RM are used as the parametrisation of a group of references generated for guiding the four DoF � surge, sway, heave, and yaw � motion of ROVs along pre-de�ned curvatureand torsion-continuous1 paths, see Figure 2.1. The advantageous characteristics of the references synthesised by the RM, see Section 3.1, are likewise possessed by the references generated by the reference generation scheme proposed herein. There are di�erent ways and purposes of de�ning paths. This work is not concerned with the path planning problem at all. It is assumed here that purposeful planar and spatial curvature- and torsion-continuous paths, comprised of rectilinear and curvilinear parts, have been previously de�ned, either through the use of proper path planning techniques, or directly based on the target applications, e.g. lawn mower pattern path. To illustrate the point of this chapter, paths comprised of straight lines connected through planar clothoids are used, without loss of generality. In fact, any planar curve that satis�es the curvature continuity condition can be used instead. For example, the Fermat's spiral (Lekkas, 2014; Lekkas et al., 2013), the single polar polynomial (Lai et al., 2007; Nelson, 1989), the cubic Bézier curve (Farouki, 2012; Seidel, 1993), and the cubic Pythagorean hodograph 1 Positional continuity (G ) denotes the case in which the endpoints of two subpaths coincide. Tangential continuity (G ) denotes the case in which two subpaths are G and share a common unit tangent vector at the join point, i.e. their derivatives with respect to their parameter have the same orientation at the join point. Curvature/torsional continuity (G ) denotes the case in which two subpaths are G and share a common unit curvature/torsion vector at the join point, i.e. they share a common centre of curvature/torsion at the join point. Details can be found in e.g. Tsourdos et al. (2011), Adams and Essex (2009), Kreyszig (2006), and LaValle (2006). 0
1
0
2
1
45
4. Path generation (Farouki, 2008, 1997; Farouki and Sakkalis, 1990) are suitable alternatives.
4.2 Reference frames Motion control applications concerning UUVs typically require the use of two reference frames simultaneously (Antonelli, 2014; Sørensen, 2013; Fossen, 2011; Lewandowski, 2004; SNAME, 1950). Succinct information can also be found in Subsection 7.2.1 in Chapter 7. The locally inertial NED reference frame serves as the reference for the following vector of desired position and attitude � heading angle
� �T ηd (t) := nd (t) ed (t) dd (t) ψd (t)
(4.1)
where the elements nd (t), ed (t), and dd (t) are respectively related to the N-, E-, and D-axis, and ψd (t) is the heading angle measured with respect to the Naxis. The parameter t ∈ R>0 [s] is the time. The NED frame is typically used for locally �at Earth navigation. The non-inertial BF reference frame serves as the reference for the vector of desired linear and angular velocities νd (t) = [ ud (t), vd (t), wd (t), rd (t) ]T , and for the vector of desired linear and angular acd [νd (t)] = [ u˙ d (t), v˙ d (t), w˙ d (t), r˙d (t) ]T , where the pairs ud (t) celerations ν˙ d (t) = dt d and u˙ d (t), vd (t) and v˙ d (t), wd (t) and w˙ d (t), and rd (t) = dt [ψd (t)] and r˙d (t) are respectively related to the motion in surge, sway, heave, and yaw (Antonelli, 2014; Sørensen, 2013; Fossen, 2011; Lewandowski, 2004; SNAME, 1950). The origin of the BF frame is attached to a point of the UUV. The transformation matrix J (ψd (t)) ∈ SO(4) (Special Orthogonal group of order 4) is de�ned as cos(ψd (t)) − sin(ψd (t)) 0 0 sin(ψd (t)) cos(ψd (t)) 0 0 (4.2) J (ψd (t)) := 0 0 1 0 0 0 0 1 transforms νd (t) into η˙ d (t) =
d dt [ηd (t)],
such that
νd (t) := J T(ψd (t)) η˙ d (t)
(4.3)
ν˙ d (t) = J˙T(ψd (t)) η˙ d (t) + J T(ψd (t)) η ¨d (t)
(4.4)
The desired heading ψd (t) has to be accumulated along consecutive turns prior to being used in (4.1), through the use of e.g. Algorithm 1, for the sake of continuity beyond the natural supremum � either 2 π or π [rad], depending on the considered range �, and the natural in�mum � either 0 or −π [rad], depending on 46
4.3. Straight lines
Algorithm 1: Desired heading accumulation
1 if ψc (q) < 0 then 2 ψc (q) ← ψc (q) + 2 π 3 end 4 if ψc (q − 1) < 0 then 5 ψc (q − 1) ← ψc (q − 1) + 2 π 6 end 7 if |ψc (q) − ψc (q − 1)| > π then 8 if ψc (q − 1) > ψc (q) then 9 counter(q) ← counter(q − 1) + 1 10 else 11 counter(q) ← counter(q − 1) − 1 12 end 13 end 14 ψd (q) ← ψc (q) + 2 π counter(q)
the considered range �, i.e. to avoid step discontinuities at the aforementioned in�mum and supremum. The accumulated desired heading angle ψd (q) that comes out from Algorithm 1, where q ∈ N\{0}, when it comes to a discrete-time implementation, is based on the two most recently computed values of the desired heading angle, i.e. ψc (q) and ψc (q − 1), which have the same bounded range, and on the variable counter(·) ∈ Z, which accumulates the number of turns taken either in the Clockwise (CW) direction (counter(·) > 0), or in the Anticlockwise (ACW) direction (counter(·) < 0). The variable is initialised as counter(1) = counter(0) = 0.
4.3 Straight lines Straight lines are fundamental building blocks of curvature- and torsion-continuous paths formed by rectilinear and curvilinear parts. The length Ll ∈ R>0 [m] of a straight line is given by
Ll := (n1l , e1l , d1l ) − (n0l , e0l , d0l ) (4.5) where the superscripts `0 ' and `1 ' are not exponents, but help to identify the start point (n0l , e0l , d0l ) and the endpoint (n1l , e1l , d1l ), whose coordinates in the NED (·) (·) (·) frame are nl , el , dl ∈ R [m]. The elements of the points (nl ($l (t)), el ($l (t)), dl ($l (t))) [m], which describe the straight line in the NED frame, are given by 47
4. Path generation nl ($l (t)) := n0l + $l (t) Ll cos(αlv ) cos(αlh )
(4.6)
el ($l (t)) := e0l + $l (t) Ll cos(αlv ) sin(αlh )
(4.7)
dl ($l (t)) := d0l + $l (t) Ll sin(αlv )
(4.8)
where $l (t) ∈ R>0 | $l (t) ∈ [0, 1] ∀ t ∈ R>0 is the time-dependent parameter that parameterises the straight line, αlh ∈ R | αlh ∈ (−π, π] [rad], which is a constant angle contained in the NE-plane that is measured from the N-axis, and αlv ∈ R | αlv ∈ [−π/2, π/2] [rad], which is a constant angle contained in a vertical plane that is measured from the NE-plane, are given by
αlh := atan2((e1l − e0l ), (n1l − n0l )) � � d1l − d0l αlv := tan−1 k(n1l , e1l ) − (n0l , e0l )k
(4.9) (4.10)
4.3.1 Derivatives with respect to the parameter $l (t) The corresponding velocities n˙ l ($ ˙ l (t)), e˙ l ($ ˙ l (t)), and d˙l ($ ˙ l (t)) [m/s], and accel¨ erations n ¨ l ($ ¨ l (t)), e¨l ($ ¨ l (t)), and dl ($ ¨ l (t)) [m/s2 ], are given by
n˙ l ($ ˙ l (t)) = $ ˙ l (t) Ll cos(αlv ) cos(αlh )
(4.11)
e˙ l ($ ˙ l (t)) = $ ˙ l (t) Ll cos(αlv ) sin(αlh )
(4.12)
d˙l ($ ˙ l (t)) = $ ˙ l (t) Ll sin(αlv )
(4.13)
and
n ¨ l ($ ¨ l (t)) = $ ¨ l (t) Ll cos(αlv ) cos(αlh )
(4.14)
e¨l ($ ¨ l (t)) = $ ¨ l (t) Ll cos(αlv ) sin(αlh )
(4.15)
d¨l ($ ¨ l (t)) = $ ¨ l (t) Ll sin(αlv )
(4.16)
4.4 Mirror-symmetric twin clothoids The clothoid, also known as the Euler spiral, or the Cornu spiral, is a plane curve whose curvature changes linearly with the arc length (Levien, 2008). Harary and Tal (2012) extended it to three dimensions, such that the torsion also changes linearly with the arc length. These characteristics can be explored for constructing curvature- and torsion-continuous paths, which are formed by straight lines connected through pairs of mirror-symmetric twin clothoids. Every pair of twin clothoids presents symmetry with respect to the line bisecting the (total) angle 48
4.4. Mirror-symmetric twin clothoids span. The (total) arc length can be exactly and easily computed based on the angle span. By knowing the arc length, the angle span, the rotation direction, and the parity, it is possible to determine the endpoint of the pair of twin clothoids, through the accurate computation of the midpoint, based on the start point. Only planar clothoids are considered in this chapter, as already mentioned. The arc length Lc ∈ R>0 [m] of a pair of mirror-symmetric twin clothoids that winds from the start point, at which the curvature is null, to the midpoint, at which the curvature is maximum, and thence unwinds to the endpoint, at which the curvature is equal to zero again, is given by (4.17)
Lc := 2 θc /κmax c
= (1/rcmin ) ∈ R>0 where θc ∈ R>0 | θc ∈ (0, π] [rad] is the angle span, and κmax c −1 min [m ] is the maximum admissible curvature, where rc ∈ R>0 [m] is the minimum radius of curvature, which occurs at the midpoint, i.e. at the point where Lc /2 and θc /2.
4.1. It is worth knowing that the arc length ratio Lc /Lr , where Lr ∈ R>0 [m] is the length of a virtual arc of circumference � shortest arc (Dubins, 1957) � whose start point and endpoint coincide with those of the pair of twin clothoids, is closely approximated by the curve depicted in Figure 4.1. Notice that Lc becomes more than 10 % longer than Lr only for θc > 105.4◦ . The radius ratio rr /rcmin , where rr ∈ R>0 [m] is the radius of the virtual arc of circumference whose length is equal to Lr , is closely approximated by the curve depicted in Figis approximately twice that of the circumure 4.1. Notice that for θc < 20◦ , κmax c ference. Table 4.1 furnishes some approximated values from Figure 4.1. Remark
Table 4.1: Approximated values of arc length and radius ratios from Figure 4.1
θc [◦ ]
0
30
60
90
120
150
180
Lc /Lr
1
1.0069
1.0288
1.0695
1.1371
1.2497
1.4526
rr /rcmin
2
1.9862
1.9439
1.8701
1.7589
1.6004
1.3768
4.2. It is worth knowing how a pair of twin clothoids compares with other types of curves in terms of curvature and length. Figure 4.2 depicts a comparison of curvatures, for the sake of example, including an arc of circumference that serves as the reference. The arc of circumference has unit radius and spans an angle of 90◦ . The other curves are a pair of twin Fermat's spirals (Lekkas, 2014; Lekkas et al., 2013), a single polar polynomial (Lai et al., 2007; Nelson, 1989), and a cubic Bézier curve (Farouki, 2012; Seidel, 1993). Notice that the single polar polynomial and the pairs of twin clothoids and Fermat's spirals can yield somewhat similar results. A downside of the single polar polynomial and of the pair of Remark
49
4. Path generation 2 1.8 Ratios
1.6
Radius ratio Arc length ratio
1.4 1.2 1 0
20
40
60
80
100 θc [◦ ]
120
140
160
180
Figure 4.1: Arc length ratio and radius ratio.
twin Fermat's spirals is that there is no closed form solution to determine their length, whereupon a numerical method has to be employed to do so. On the other hand, both curves can be computed faster than a pair of twin clothoids. All curves are parameterised by the same unit parameter, and span an angle of 90◦ . Figure 4.3 depicts the curves, whose approximate lengths are given in Table 4.2. Notice the match of the data in Figures 4.2�4.3 and Table 4.2, and that given in the column of Table 4.1 relative to 90◦ . Table 4.2: Approximated lengths of the curves in Figure 4.3 Type Arc of circumference Single polar polynomial Pair of twin Fermat's spirals Pair of twin clothoids Cubic Bézier curve
Length [m]
Overlength [%]
π/2 1.6443 1.6662 1.6799 1.8021
0 4.68 6.07 6.95 14.73
4.4.1 Description of the pair of twin clothoids The elements of the points (nc ($c (t)), ec ($c (t))) [m], which describe the pair of twin clothoids in the NE-plane, and the tangent angles αc ($c (t)) [rad] at the 50
4.4. Mirror-symmetric twin clothoids Pair of twin clothoids Pair of twin Fermat′s spirals Single polar polynomial Cubic Be′zier curve Arc of circumference
3.5 Curvature [m−1 ]
3 2.5 2 1.5 1 0.5 0 0
0.1
0.2
0.3
0.4
0.5 0.6 Parameter
0.7
0.8
0.9
1
Figure 4.2: Curvature comparison.
1
Pair of twin clothoids Pair of twin Fermat′s spirals Single polar polynomial Cubic Be′zier curve Arc of circumference
n [m]
0.8 0.6 0.4 0.2 0 0
0.2
0.4 0.6 e [m]
0.8
1
Figure 4.3: Length comparison.
points, are given by
nc ($c (t)) := n0c + n1c ($c (t))(H($c (t)) − H($c (t) − 0.5)) + n2c ($c (t))(H($c (t) − 0.5) − H($c (t) − 1))
(4.18) 51
4. Path generation ec ($c (t)) := e0c + e1c ($c (t))(H($c (t)) − H($c (t) − 0.5)) + e2c ($c (t))(H($c (t) − 0.5) − H($c (t) − 1)) αc ($c (t)) := αc0 + αc1 ($c (t))(H($c (t)) − H($c (t) − 0.5)) + αc2 ($c (t))(H($c (t) − 0.5) − H($c (t) − 1))
(4.19)
(4.20)
where the superscripts `0 ', `1 ', and `2 ' are not exponents, $c (t) ∈ R>0 | $c (t) ∈ [0, 1] ∀ t ∈ R>0 is the time-dependent parameter that parameterises the pair of twin clothoids, (n0c , e0c ) is the start point, whose coordinates are n0c ∈ R [m] (north) and e0c ∈ R [m] (east), αc0 ∈ R | αc0 ∈ (−π, π] [rad] is the tangent angle at the point (n0c , e0c ), and H(·) is the unit step function, see Appendix D for details.
4.4.2 First clothoid arc of the pair of twin clothoids The parameter $c (t) ranges from zero to 0.5 along the �rst clothoid arc of the pair of twin clothoids, as indicated in (4.18)�(4.20). The terms n1c ($c (t)) [m] and e1c ($c (t)) [m] are given by
"
n1c ($c (t))
#
e1c ($c (t))
" :=
cos(αc0 ) − sin(αc0 ) sin(αc0 )
cos(αc0 )
#"
c0c ($c (t)) s0c ($c (t))
# (4.21)
where c0c ($c (t)) and s0c ($c (t)) are given by the following absolutely convergent power series
c0c ($c (t)) :=
s0c ($c (t)) :=
1 κmax c
∞ X (−1)k θ2k+1 (2 $c (t))4k+1 c
k=0
(2 k)! (4 k + 1) 22k
∞ λc X (−1)k θc2k+2 (2 $c (t))4k+3 κmax (2 k + 1)! (4 k + 3) 22k+1 c
(4.22)
(4.23)
k=0
where λc ∈ Z | λc ∈ {−1, 1} denotes the rotation direction developed from the point (n0c , e0c ), i.e. λc = 1 assigns the CW direction, whereas λc = −1 assigns the ACW direction. The tangent angles αc1 ($c (t)) [rad] are given by
αc1 ($c (t)) := 2 λc θc $c2 (t) 52
(4.24)
4.4. Mirror-symmetric twin clothoids
4.4.3 Second clothoid arc of the pair of twin clothoids The parameter $c (t) ranges from 0.5 to 1 along the second clothoid arc of the pair of twin clothoids, as indicated in (4.18)�(4.20). The terms n2c ($c (t)) [m] and e2c ($c (t)) [m] are given by
"
n2c ($c (t))
#
" :=
e2c ($c (t))
cos(αc0 ) − sin(αc0 ) sin(αc0 )
cos(αc0 )
#"
c00c ($c (t))
# (4.25)
s00c ($c (t))
where c00c ($c (t)) and s00c ($c (t)) are given by
"
c00c ($c (t)) s00c ($c (t))
#
" :=
cos(χc )
−ρc sin(χc )
− sin(χc ) −ρc cos(χc ) # " 0 cc (0.5) + s0c (0.5)
#"
0 c000 c ($c (t)) − cc (0.5) 0 s000 c ($c (t)) − sc (0.5)
# (4.26)
where ρc ∈ Z | ρc ∈ {−1, 1} denotes the parity, i.e. ρc = 1 assigns the even parity, which results in a symmetric pair of twin clothoids, whereas ρc = −1 assigns the odd parity, which results in an antisymmetric pair of twin clothoids. The latter pair presents a curvature discontinuity at the midpoint, due to an instantaneous change of the centre of curvature at the midpoint, which causes such pair of clothoids to degenerate into just tangent-continuous (G1 ). The argument χc is de�ned as (4.27)
χc := λc (π − (1 + ρc ) θc /2) 000 and c000 c ($c (t)) and sc ($c (t)) are given by
c000 c ($c (t)) :=
s000 c ($c (t)) :=
1 κmax c
∞ X (−1)k θ2k+1 (2 (1 − $c (t)))4k+1 c
k=0
(2 k)! (4 k + 1) 22k
∞ λc X (−1)k θc2k+2 (2 (1 − $c (t)))4k+3 κmax (2 k + 1)! (4 k + 3) 22k+1 c
(4.28)
(4.29)
k=0
The tangent angles αc2 ($c (t)) [rad] are given by
αc2 ($c (t)) := (λc θc /2)(1 + ρc (1 − 4 (1 − $c (t))2 ))
(4.30) 53
4. Path generation
4.4.4 Derivatives with respect to the parameter $c (t) The linear and angular velocities n˙ c ($c (t), $ ˙ c (t)) [m/s], e˙ c ($c (t), $ ˙ c (t)) [m/s], and α˙ c ($c (t), $ ˙ c (t)) [rad/s] along the pair of twin clothoids are given by
d [nc ($c (t))] dt d e˙ c ($c (t), $ ˙ c (t)) = [ec ($c (t))] dt d α˙ c ($c (t), $ ˙ c (t)) = [αc ($c (t))] dt
(4.31)
n˙ c ($c (t), $ ˙ c (t)) =
(4.32) (4.33)
and the corresponding linear and angular accelerations n ¨ c ($c (t), $ ˙ c (t), $ ¨ c (t)) [m/s2 ], e¨c ($c (t), $ ˙ c (t), $ ¨ c (t)) [m/s2 ], and α ¨ c ($c (t), $ ˙ c (t), $ ¨ c (t)) [rad/s2 ] are given by
n ¨ c ($c (t), $ ˙ c (t), $ ¨ c (t)) =
d2 [nc ($c (t))] dt2
(4.34)
e¨c ($c (t), $ ˙ c (t), $ ¨ c (t)) =
d2 [ec ($c (t))] dt2
(4.35)
α ¨ c ($c (t), $ ˙ c (t), $ ¨ c (t)) =
d2 [αc ($c (t))] dt2
(4.36)
where the derivatives with respect to time in (4.31)�(4.32) and (4.34)�(4.35) are obtained with the help of " ∞ # � � ∞ X INum(k, $c (t)) X dn dn dn INum(k, $c (t)) [φc ($c (t))] = n ζ =ζ (4.37) dtn dt IDen(k) dtn IDen(k) k=0
k=0
where φc ($c (t)) is a dummy function that represents c0c ($c (t)) in (4.22), s0c ($c (t)) 000 in (4.23), c000 c ($c (t)) in (4.28), and sc ($c (t)) in (4.29), ζ is a dummy constant that max max represents either 1/κc or λc /κc , and INum(k, $c (t)) and IDen(k) respectively stand for the numerator and the denominator of φc ($c (t)). Based on (4.31), (4.32), (4.34), and (4.35), the curvature is given by
|n˙ c (·) e¨c (·) − e˙ c (·) n ¨ c (·)| κc ($c (t)) = q 3 ((n˙ c (·))2 + (e˙ c (·))2 )
(4.38)
4.3. The power series (4.22), (4.23), (4.28), and (4.29) are adapted from Råde and Westergren (2004). The magnitude of the terms in the sums to in�nity (4.22), (4.23), (4.28), (4.29), and (4.37) decreases rapidly as k increases. The use of only a few terms, e.g. k ∈ {0, 1, . . . , 10}, yields very close approximations for the sums in practice. Exploring this fact leads to expedited, yet accurate, computations of those summands. Remark
54
4.5. Path generation scheme
4.5 Path generation scheme There are essentially two possibilities of combining straight lines and pairs of twin clothoids � or other suitable types of curved lines � to form paths. The �rst possibility consists of using the pairs of twin clothoids as approximating curves with speci�ed maximum curvatures and torsions, thereby resulting in paths which do not pass through all the waypoints which sketch out the paths. There are typically as many pairs of twin clothoids as the total number of waypoints minus two. Figure 4.4 shows an example in which all planar clothoids have the same maximum curvature. The second possibility consists of using the pairs of twin clothoids as interpolating curves with speci�ed maximum curvatures and torsions, thereby resulting in paths which do pass through all the waypoints which sketch out the paths. Figure 4.5 shows an example in which all planar clothoids have the same maximum curvature. Such a kind of path, which encompasses two successive lane changes, is useful, among other things, to avoid collisions. The path in Figure 4.5 is based on antisymmetric pairs of twin clothoids � odd parity (ρc = −1) �, which render the path only tangent-continuous (G1 ), due to the inherent properties of the clothoids. Notice that this fact has nothing to do with the curve interpolation. Alternatives to circumvent the curvature discontinuity problem are: i) to replace each antisymmetric pair of twin clothoids by two symmetric pairs of twin clothoids linked by a short straight line; or ii) to replaced them with curved lines which yield curvature-continuous lane change paths, e.g. the curve reported in Nelson (1989); or iii) to move along the path in such a manner that the velocity and the acceleration are both null at the join point of both clothoids of the antisymmetric pair. The total path length Lp ∈ R>0 [m] is given by
Lp :=
N X
Li
(4.39)
i=1
where Li ∈ R>0 [m] denotes the length of the i-th part of the path, which is formed by N juxtaposed parts in total. In essence, the path length can be mapped, from the start point to the endpoint, as a strictly monotonically increasing one-to-one function of the parameter $p (t) ∈ R>0 | $p (t) ∈ [0, 1] ∀ t ∈ R>0 . Similarly, the length of the i-th part of the path can be mapped as a function of the parameter $i (t) ∈ R>0 | $i (t) ∈ [0, 1] ∀ t ∈ R>0 . Then, either $l (t) = $i (t), $ ˙ l (t) = $ ˙ i (t), and $ ¨ l (t) = $ ¨ i (t), or $c (t) = $i (t), $ ˙ c (t) = $ ˙ i (t), and $ ¨ c (t) = $ ¨ i (t), i ∈ {1, 2, . . . , N }, depending on the type of the line � rectilinear or curvilinear, respectively �, see Sections 4.3�4.4. The parameter $p (t), and its derivatives with respect to time $ ˙ p (t) and $ ¨ p (t), are de�ned as
$p (t) = $p (p(t)) := |p(t)|/Lp
(4.40) 55
4. Path generation
n [m]
40 Waypoints 1st waypoint Last waypoint Support lines Straight lines Twin clothoids
30
20 10
20
30 e [m]
40
50
Figure 4.4: Example of path using approximating curves.
60 Waypoints 1st waypoint Last waypoint Straight lines Twin clothoids
n [m]
50 40 30 20 20
40
e [m]
60
80
Figure 4.5: Example of path using interpolating curves.
$ ˙ p (t) = $ ˙ p (v(t), p(t)) := sgn(p(t)) v(t)/Lp
(4.41)
$ ¨ p (t) = $ ¨ p (a(t), p(t)) := sgn(p(t)) a(t)/Lp
(4.42)
56
4.6. Simulation results where a(t), v(t), and p(t) come respectively from (3.4)�(3.6). They can be generated by either the basic version of the RM that is described in Section 3.3, or an extended version of the RM, as described in Section 3.4. The relation |p(t)| ≡ sgn(p(t)) p(t) ⇔ p(t) ∈ R\{0} is utilised to determine the derivatives with respect to time in (4.41)�(4.42). Consequently, the N parameters $i (t), i ∈ {1, 2, . . . , N }, and their derivatives with respect to time $ ˙ i (t) and $ ¨ i (t), are de�ned as i−1 X Lj Lp $p (t) − hi ($p (t)) (4.43) $i (t) := Li L j=1 p
$ ˙ i (t) := (Lp /Li ) $ ˙ p (t) hi ($p (t))
(4.44)
$ ¨ i (t) := (Lp /Li ) $ ¨ p (t) hi ($p (t))
(4.45)
where Lj = Li ⇔ j = i. The characteristic functions hi ($p (t)) of the �rst N − 1 (half-closed) subintervals of $p (t), i.e. for i ∈ {1, 2, . . . , N − 1}, are de�ned as i−1 i X X L L L L j j p p − H $p (t) − (4.46) hi ($p (t)) := H $p (t) − Li L Li+1 L j=1 p j=1 p where H(·) denotes the unit step function, see Appendix D. The characteristic function of the N -th (closed) subinterval of $p (t), i.e. for i = N , is de�ned as i−1 X Lj Lp hi ($p (t)) := H $p (t) − (4.47) Li L j=1 p
4.4. Recall that the proposed path generation scheme concerns both planar and spatial paths, as stated in Section 4.1. Therefore, (4.39)�(4.47) are valid for both planar and spatial paths. Recall also that planar paths comprised of straight lines connected through clothoids are used to illustrate the point of this chapter without loss of generality, as also stated in Section 4.1. Remark
4.6 Simulation results This section presents simulation results based on the ROV Minerva, see Appendix C. The four DoF MCS used to carry out the simulation was that reported in Part III of this thesis, with the guidance system built upon the reference generation scheme proposed in this chapter. The simulation was based on recursive use of the extended version of the RM that is described in Section 3.4. Notice that the basic version of the RM that is described in Section 3.3 could have been used instead. 57
4. Path generation The sampling frequency was 6.¯ 6 Hz � sampling period of 150 ms. The tuning parameters of the RM are all collected in Table 4.3. See Table 3.1 for details on them. The additional tuning parameters concerning the path generation were rcmin = 10 m and ρc = 1. They held for both pairs of twin clothoids. Table 4.4 gives the waypoints which sketch out the path. The tuning parameters of the MCS, regarding the controller, were KP = diag(52.6, 83.8, 53.3, 69.2) KI = diag(5, 10, 5, 20) KD = diag(420.3, 533.8, 432.5, 182.0) (4.48) (WC )i,j = (WL )i,j = (WM )i,j = (WQ )i,j = 1 WP = I5 where i, j ∈ {1, 2, 3, 4}, and I5 ∈ R5×5 is an identity matrix, whereas the tuning parameters regarding the state observer, were c −1 L11 = diag(0.1, 0.1, 10, 10) M c −1 L12 = diag(5, 5, 5, 5) M c −1 (4.49) L21 = diag(0.03, 0.03, 3, 3) M c −1 L22 = diag(100, 100, 100, 100) M � = 0.0005 and γ = 1
c ∈ R4×4 is the weighted nominal inertia matrix of the ROV Minerva where M that is implemented in the MCS. See Appendix C for details on Minerva, and Chapter 8 for details on the tuning parameters of the MCS. Figures 4.6�4.9 are exclusively related to the path generated as reference. Figure 4.6 depicts the path based on Table 4.4. Figure 4.7 depicts the path curvature. Notice that κ($p (t)) is continuous, and that κ($p (t)) 6 1/rcmin = 0.1 m−1 ∀ $p (t) ∈ [0, 1] ∧ ∀ t ∈ R>0 . The parameter $p (t), and its derivatives with respect to time, are shown in Figure 4.8. The whole path, whose length is ≈ 184.3 m, has �ve parts, each of which with a characteristic function hi ($p (t)), and parameterised by a parameter $i (t), i ∈ {1, 2, 3, 4, 5}, see Figure 4.9. The vertical dashed red lines separate each part of the path. The desired depth of 80 m was held constant throughout the simulation. Figure 4.10 depicts the trajectory described by Minerva in the NE-plane. Notice the strong resemblance it bears to the reference path in Figure 4.6. The motion started at 50 s from DP, and stopped back in DP at ≈ 731.5 s. Figure 4.11 depicts the described trajectory elementwise. The maximum absolute (spatial) position error was < 0.5 m, where the maximum absolute depth error was 58
4.6. Simulation results Table 4.3: Tuning parameters of the reference model used in the simulation Par.
L Vd Vi Vf Ta Td �L θa θd θ0
1st
2nd
3rd
4th
5th
Unit
≈ 27.446 0.4 0 0.25 20 20 0.05 0.8 0.2 exp(−13)
≈ 43.176 0.25 0.25 0.25 20 20 0.05 0.8 0.2 exp(−13)
≈ 43.058 0.4 0.25 0.25 20 20 0.05 0.8 0.2 exp(−13)
≈ 43.176 0.25 0.25 0.25 20 20 0.05 0.8 0.2 exp(−13)
≈ 27.446 0.4 0.25 0 20 20 0.05 0.8 0.2 exp(−13)
m m/s m/s m/s s s − − − −
Table 4.4: Table of waypoints in the NE-plane Waypoint
1st
2nd
3rd
4th
Unit
North East Down
0 0 80
60 0 80
0 90 80
60 90 80
m m m
< 0.15 m. The maximum absolute heading error was < 2.5◦ . The satisfactory performance of the MCS under challenging operating conditions, e.g. motion concerning the three horizontal DoFs simultaneously, plant parameter variations, and measurement errors and noise, could be attained thanks to the suitable and su�ciently smooth motion references generated by the proposed reference generation scheme. Figure 4.12 depicts the corresponding velocities along the trajectory. The measured and the estimated velocities remained close to the references all the time. It is worthwhile to realise that vm = Vd , vi = Vi , and vf = Vf in all the four last parts of the path. In the �rst part, however, vm = 0.93 Vd = 0.372 m/s, according to the numerical method employed to determine vm , see Subsection 3.4.5 and Script A.3 in Appendix A for details. The vertical dashed red lines in Figures 4.11�4.13 indicate the separate parts of the path, which began at the instants 50 s, ≈ 140.3 s, ≈ 313.1 s, ≈ 430.6 s, and ≈ 603.5 s, respectively. The latter ended at ≈ 731.5 s. The same division holds for Figure 4.8. Figure 4.13 depicts the commanded thrust forces and moment from the propulsion system of the ROV. The curves somewhat mimicked the shapes of the reference velocities depicted in Figure 4.12. When it comes to the sway and heave forces, and the yaw moment, the curves gently oscillated around constant values in order to compensate for disturbances. The heave thrust force kept the desired depth by counter59
4. Path generation 60 Waypoints 1st waypoint Last waypoint Support lines Straight lines Twin clothoids
50
n [m]
40 30 20 10 0 0
15
30
45 e [m]
60
75
90
Figure 4.6: Reference path in the NE-plane.
0.1
κ(̟p (t)) [m−1 ]
0.08 0.06 0.04 0.02 0 0
0.2
0.4
̟p (t)
0.6
0.8
Figure 4.7: Reference path curvature.
acting the positive buoyancy force of 100 N of Minerva, see Appendix C.
60
1
4.6. Simulation results
Figure 4.8: Parameter $p (t) and its derivatives with respect to time.
1 hi (̟p (t)) ̟i (t), i ∈ {1, . . . , 5}
0 1 0 1 0 1 0 1 0 0
0.1
0.2
0.3
0.4
0.5 ̟p (t)
0.6
0.7
0.8
0.9
1
Figure 4.9: Characteristic functions and parametrisation of the �ve parts of the reference path.
61
4. Path generation
60 50
n [m]
40 30 20 10 0 0
15
30
45 e [m]
60
75
90
n [m]
40 20 0
e [m]
60 30 0
d [m]
80 79.9
ψ [◦ ]
Figure 4.10: Trajectory described by the ROV in the NE-plane. The patches indicate the heading.
100 50 0 0
Reference Measured Estimated
100
200
300
400 Time [s]
500
600
Figure 4.11: Position and heading (NED frame).
62
700
0.4 0.2 0 0.05 0 −0.05 0.04
r [◦/s]
w [m/s] v [m/s] u [m/s]
4.6. Simulation results
Reference Measured Estimated
0 2 0 −2 0
100
200
300
400 Time [s]
500
600
700
Yaw [Nm]
Heave [N]
Sway [N]
Surge [N]
Figure 4.12: Linear and angular velocities (BF frame).
60 30 0 40 0 −40 110 100 90 5 0 −5 0
100
200
300
400 Time [s]
500
600
700
Figure 4.13: Commanded thrust forces and moment.
63
Chapter 5
Concluding remarks 5.1 Conclusions Part II of this thesis dealt with the generation of su�ciently smooth references for guiding the motion of ROVs along purposefully pre-de�ned planar and spatial curvature- and torsion-continuous paths comprised of rectilinear and curvilinear parts. The mathematical development, as well as the experiments and simulations carried out, focused only on (planar) curvature-continuous paths, without loss of generality. The generated references yielded motion:
• suboptimal with regard to the time taken to traverse the paths; • under less induced plant parameter variations; • that favoured energy saving while moving; • with higher overall tracking accuracy; • with �nite convergence time. An RM that synthesises references regarding a single DoF motion, either linear or angular, was initially proposed in Chapter 3. It is easy to tune due to its meaningful tuning parameters, which re�ect the desired motion speci�cations and the bandwidth limitations of the MCS. Two versions of the RM were described: i) a basic version, in Section 3.3, which guides motion under the condition that the initial and �nal values of the velocity and acceleration references are equal to zero; and ii) an extended version, in Section 3.4, which guides motion under the condition that the initial and �nal values of the velocity reference can be di�erent from zero, whereas the initial and �nal values of the acceleration reference are equal to zero. After that, in Chapter 4, the references synthesised by the RM were used to parameterise other references concerning the motion along curvature- and torsioncontinuous paths comprised of rectilinear and curvilinear parts. 65
5. Concluding remarks
5.2 Future works Future works must seek to extend the �ndings and results found in Part II of the thesis, as well as to provide solutions to the unsolved problems. It is most important to:
• Find a more suitable, i.e. robust and fast-execution, numerical method for determining the cruise velocity vm in the extended version of the RM proposed in Section 3.4; • Develop spatial curvature- and torsion-continuous paths based on e.g. the 3D spirals developed by Harary and Tal (2012); • Integrate the proposed path generation scheme with path planners; • Fully develop the `further features' listed in Section 3.5, and incorporate them into both current versions of the RM, as suggested therein; • Devise other extended versions of the RM which will serve yet di�erent purposes; • Extend the formulation found in Chapter 4 to six DoF motion.
66
Part III
Motion control system
67
Chapter 6
Introduction 6.1 Introduction Part III of this thesis deals with an MCS dedicated to control observation class ROVs which are used to conduct automated (high-resolution) image-capturing missions, e.g. Fillinger and Funke (2013), Marsh et al. (2013), Amado-Filho et al. (2012), Ludvigsen et al. (2007), Singh et al. (2007), and Yoerger et al. (1998). The MCS has DP and trajectory tracking capabilities. Such capabilities enable the end-users of the ROV technology, e.g. marine archaeologists, biologists, and geologists, to obtain sequential high-quality images at the proper pace to construct consistent representations of objects and environments of interest. Four DoFs are controlled, namely surge, sway, heave, and yaw (SNAME, 1950), whereas both remaining DoFs, namely roll and pitch, are left uncontrolled under the argumentation that they are self-stable � metacentric stability � by the design of the ROVs. Stability and satisfactory tracking performance are attainable through the use of suitable and su�ciently smooth reference trajectories, e.g. those generated through the path generation scheme proposed in Part II of this thesis, in spite of the presence of unmodelled plant dynamics, plant parameter variations, measurement errors and noise, and environmental disturbances. Further details on the proposed MCS are provided in the next section. Further details on observation class ROVs are provided in Section 6.3. Results from simulations and full-scale sea trials, both based on the (observation class) ROV Minerva, see Appendix C, are presented and discussed to support the development carried out in Part III. The main contributions found in this part of the thesis were also published in Fernandes et al. (2015b), Fernandes et al. (2014), and Fernandes et al. (2013). 69
6. Introduction
Figure 6.1: Block diagram of the proposed motion control system.
6.2 Proposed motion control system The MCS1 proposed herein essentially consists in a model-based MIMO output feedback control system that works in tandem with an open-loop guidance system. The MIMO output feedback control system is comprised of a MIMO PID controller that works in combination with an HGSO. The MIMO PID controller is aided by two additional control laws: i) one that implements (state) feedback linearisation of the plant dynamics; and ii) another that implements reference feedforward. The proposed output feedback control system is fully detailed in Chapter 8, whereas the plant model is given in Chapter 7. Especial attention is drawn to the hydrodynamic e�ects in Chapter 7. The guidance system builds upon the path generation scheme presented in Part II. Thus, it is not treated again in Part III. An elementary thrust allocation algorithm completes the MCS. Figure 6.1 depicts a block diagram that pieces together all components of the MCS, in which the controlled plant is represented by the ROV Minerva.
6.2.1 On guidance, navigation, and control systems An MCS intended to control the motion of an ROV, so that the vehicle can be deployed to perform semi- or fully-automated missions, is typically compartmental1 The main concepts making up the proposed MCS can also be utilised in related marine and electro-mechanical control applications under the necessary adaptation.
70
6.2. Proposed motion control system ised into guidance, navigation, and control systems2 , as exempli�ed in Figure 6.1. Because of such compartmentalisation, an MCS can also be alternatively referred to as either a Guidance, Navigation, and Control (GNC) system, in e.g. Ca�az et al. (2012) and Fossen (2011), or a Navigation, Guidance, and Control (NGC) system, in e.g. Caccia et al. (2012), Naeem et al. (2012), Loebis et al. (2006), and Naeem et al. (2003). Every system is succinctly described in the sequence.
6.2.2 Control system The control system is responsible for determining the steering forces and moments the propulsion system of the controlled vehicle/craft is to deliver, so that the reference trajectories and attitude are followed or tracked, according to the control objective. When it comes to ROVs, which typically have propellers as the only type of actuator, the control system also has to compute the propulsive forces and moments the propulsion system is to deliver.
6.2.3 Navigation system The navigation system is responsible for determining the position, attitude, velocities, and sometimes also the accelerations, of the controlled vehicle/craft, by means of direct measurement or reconstruction via state estimation. Whenever the navigation system includes a state observer, as exempli�ed in Figure 6.1, the navigation and the control systems are interdependent.
6.2.4 Guidance system The guidance system is responsible for generating suitable and su�ciently smooth reference trajectories, as well as the reference attitude along the trajectories. It can also generate the corresponding linear and angular velocities and accelerations along the reference trajectories. Guidance is concerned with the transient motion behaviour associated with the achievement of the motion control objectives (Fossen, 2011; Breivik and Fossen, 2009), so that the mission speci�cations and the vehicle/craft dynamics are all simultaneously observed. Furthermore, collisions with stationary obstacles are avoided whenever a collision-free path is closely tracked or followed, according to the control objective. The guidance system is more or less interdependent on both the navigation and the control systems, depending on the desired and feasible complexity and sophistication levels of the MCS. In an openloop guidance scheme, for instance, the guidance system generates references regardless of the actual position, attitude, and velocities of the controlled vehicle/
2 The same structure applies to MCSs in general, regardless of the type of vehicle they are intended to control, namely terrestrial vehicles, underwater vehicles, surface and semi-submersible marine crafts, aircrafts, and spacecrafts.
71
6. Introduction craft. On the other hand, in a closed-loop guidance scheme, the guidance system generates references also taking into consideration the actual position, attitude, and velocities of the controlled vehicle/craft. In the latter case, it may even make use of the controls generated by the control system.
6.3 Observation class ROVs A supergroup constituted by all types of UUVs can be basically subdivided into three main subgroups or categories: i) ROVs; ii) AUVs; and iii) hybrid UUVs, which simultaneously possess characteristics inherent in each of the previous types. Notice that the latter category is highly heterogeneous. Figure 6.2 depicts a schematic diagram that indicates how underwater vehicles in general can be classi�ed (Christ and Wernli, 2014, 2007). The path highlighted in blue in the �gure puts the observation class ROVs into perspective among all types of underwater vehicles. To put it simply, ROVs are typically fully-actuated vehicles with open-frame structures. They are teleoperated from control rooms located on board support vessels through umbilical cables supplying them with power and transmitting commands and data, e.g. video streams. In contrast, AUVs are typically torpedoshaped, underactuated, battery-powered vehicles which can be launched and retrieved from either vessels or the land. They are capable of autonomously performing (pre-programmed) missions, and have no physical connection with any control room during the execution of missions.
6.3.1 Observation class ROVs The distinguishing features of the observation class ROVs are: • The maximum power of the propulsion systems is limited to a few kilowatts;
• The maximum depth they can reach is limited to a few thousands of meters; • The maximum payload capacity is limited to a few tens of kilograms. Observation class ROVs are indispensable workhorses used worldwide as carriers of imagery devices, e.g. cameras, echo sounders, hyperspectral imagers, and sonars, for industrial, research, and military activities, e.g. inspection, mapping, monitoring, surveillance, and survey. They are also used to collect samples, e.g. water, sediment, and pieces of coral, in which case they are equipped with appropriate tools, e.g. rosette samplers, baskets, cutting and drilling devices, and manipulators. In addition, they can be used to perform some light-duty intervention tasks. An example is the NTNU's ROV Minerva introduced in Appendix C. Some application examples can be found in e.g. Christ and Wernli (2014, 2007), Fillinger and Funke (2013), Marsh et al. (2013), Amado-Filho et al. (2012), Ludvigsen et al. (2007), Singh et al. (2007), and Yoerger et al. (1998). 72
6.4. Objectives
Figure 6.2: Schematic diagram of types of underwater vehicles.
The interested reader is referred to e.g. Christ and Wernli (2014, 2007) for a comprehensive coverage of the subject.
6.4 Objectives I. Propose, and explore some of the potentialities of, an MCS dedicated to control the motion of observation class ROVs which are used to conduct automated image-capturing missions. Four DoFs � surge, sway, heave, and yaw � are simultaneously controlled. The MCS consists of a model-based MIMO output feedback control system, comprised of a MIMO PID controller, auxiliary control laws, and an HGSO, that is fed by an open-loop guidance system. The explored potentialities are concerned with: i) tuning methods for both the PID controller and the state observer; and ii) the Globally Exponential Stability (GES) of the MCS. Everything relies on the properties of the matrices of the plant model. Hence, some aspects of the plant modelling also deserve careful attention. Objective
73
6. Introduction
II. To study whether or not an HGSO serves as an alternative to the benchmark EKF in the MCS. Objective
6.5 Motivation The motivation for developing the MCS proposed in Part III of this thesis was to contribute to the development of the versatile MCS for ROVs that is carried out at NTNU under the collaborative e�ort of the research team headed up by Prof. Asgeir J. Sørensen (Dukan, 2014; Sørensen et al., 2012). More speci�cally, the study of whether or not an HGSO serves as an alternative to the benchmark EKF in the NTNU's MCS �rst and foremost motivated the whole work that culminated in the contents of Part III.
6.6 Literature review 6.6.1 Controller The classical PID control is often preferred for motion control of ROVs and marine crafts in general (Smallwood and Whitcomb, 2004; Roberts et al., 2003; Hsu et al., 2000), and for control of industrial applications in general (Åström and Hägglund, 2011), despite the availability of several modern control techniques (Bennett, 1996). Although the PID control has its limitations to cope with a highly coupled MIMO Nonlinear Time Varying (NTV) plant dynamics, as it is the case of the ROV dynamics, it is often preferred due to its synthesis and implementation simplicity, apart from being fully understood, and having been extensively and successfully tested in practice for almost one century since it was introduced (Åström and Hägglund, 2011; Fossen, 2011; Franklin et al., 2009; Roberts et al., 2003; Bennett, 1996; Friedland, 1986). The PID control alone cannot provide exact tracking of time-varying references, even dealing with a 2nd-order LTI plant, neither can it dynamically compensate for unmodelled plant dynamics. However, such limitations can be sought to be circumvented by combining other techniques with the basic PID algorithm, whereupon satisfactory PID-based controllers can be obtained. Among the various possibilities, the linearisation of the plant dynamics can often be satisfactorily attained through either state feedback � computed torque control law (Franklin et al., 2009) �, or reference feedforward, as in e.g. Fernandes et al. (2015b), Sørensen et al. (2012), and Smallwood and Whitcomb (2004); or the otherwise �xed controller gains can be varied online either discretely, through gain-scheduling, as in e.g. Sørensen (2013), Caccia et al. (2012), Caccia (2006), and Caccia and Veruggio (2000), or continuously, through some adaptive mechanism, as in e.g. Antonelli (2014), Smallwood and Whitcomb (2004), Antonelli et al. (2001), Hsu et al. (2000), and Goheen and Je�erys (1990), 74
6.6. Literature review in order to cope with the plant parameter variations. Perrier and Canudas-de-Wit (1996) proposed simple nonlinear robust controllers which explore the potentiality of bridging the linear PID control and nonlinear control techniques. A number of successful PID-based marine control applications can be found in literature, e.g. Fernandes et al. (2015b), Antonelli (2014), Sørensen (2013), Caccia et al. (2012), Martin and Whitcomb (2012), Omerdic et al. (2012), Sørensen et al. (2012), Fossen (2011), Hoang and Kreuzer (2007), Caccia (2006), Smallwood and Whitcomb (2004), Caccia et al. (2003), Caccia and Veruggio (2000), Park et al. (2000), Perrier and Canudas-de-Wit (1996), and the references therein. PID-based MCSs for UUVs and marine crafts have parallels in industrial robot manipulator counterparts, provided that similar matrix-vector models can be used to model both types of dynamics (Fossen, 2011; Smallwood and Whitcomb, 2004). The modern control techniques are more capable of coping with the dynamics of UUVs and marine crafts, while also rejecting environmental disturbances. However, fairly accurate nominal models are usually required in order for such techniques to yield the expected superior performance. Thus, a great deal of e�ort can be necessary to accurately model and identify the hydrodynamic and actuator parameters, apart from also estimating their uncertainty boundaries. On the other hand, such techniques are more commonly and advantageously employed in MCS for AUVs than for ROVs, since AUVs are typically underactuated vehicles which execute more complex manoeuvres during the missions. Moreover, AUVs in general are relatively easier to model and identify than ROVs, due to the symmetries of their typical torpedo-like closed hulls. A collection of examples of marine applications based on such control techniques, namely integrator backstepping, LinearQuadratic Gaussian (LQG)/Loop Transfer Recovery (LTR), and Model Predictive Control (MPC), can be found in e.g Sørensen (2013), Fossen (2011), and Do and Pan (2009). Examples of robust modern control techniques are the sliding mode (Marco and Healey, 2001; Healey and Lienard, 1993; Fossen and Foss, 1991; Yoerger and Slotine, 1991, 1985), H∞ (Silvestre and Pascoal, 2004; Park et al., 2000; Conte and Serrani, 1998; Donha et al., 1998; Fryxell et al., 1996), and some adaptive techniques (Antonelli, 2014; Antonelli et al., 2001; Fossen and Fjellstad, 1995; Fossen and Sagatun, 1991; Yuh, 1990). The sliding mode control demands somewhat high gains in the switching controllers (∞ frequency), despite the relatively narrow bandwidths of the marine systems. Besides, this technique has high noise sensitivity at the equilibrium points. The H∞ control can be extended to a nonlinear version with optimised performance (Park et al., 2000), but designing such controller is di�cult, since quite intense mathematical treatment is needed, e.g. solving a set of coupled nonlinear partial di�erential equations. Thus, some approximations may be required where analytical solutions cannot be provided. Model parameter uncertainties can be coped with, to some extent, through adaptation but, however, this often results in time consuming algorithms and robustness problems regarding the adaptation loops. Intelligent control techniques, 75
6. Introduction e.g. fuzzy logic, arti�cial neural networks, and neuro-fuzzy (Liang et al., 2006; Kanakakis et al., 2004), can be good alternatives, although often requiring lengthy tuning processes.
6.6.2 State observers The vast majority of the marine output control systems are based on the benchmark EKF, an extension to nonlinear systems of the optimal � minimum variance � Linear-Quadratic (LQ) estimator Kalman Filter (KF) (Kalman and Bucy, 1961; Kalman, 1960), which has been extensively and successfully tested in practice for over half century since it was introduced (Sørensen, 2013; Fossen, 2011; Kinsey et al., 2006; Bennett, 1996; Friedland, 1986). Tuning an EKF may be a hard and time-consuming task due to its quite numerous covariance parameters, which are not necessarily directly related to the plant quantities. Other nonlinear techniques, such as integrator backstepping and passivity, are interesting alternatives for asymptotic state estimation (Fossen, 2011, and references therein). A state observer based on the integrator backstepping technique is easier to tune than an EKF. A passivity-based state observer is even easier to tune than both aforementioned algorithms, requires less detailed plant models to work satisfactorily, and allows design simpli�cations based on a version of the separation principle that holds for certain classes of nonlinear systems (Fossen, 2011; Khalil, 2002). An HGSO has the ability to robustly estimate the unmeasured states, while it asymptotically rejects disturbances. It behaves approximately like a di�erentiator (Khalil, 2002), thus �tting well applications where velocities may not be directly measured, but obtained from position and attitude measurements. Its machine code needs less memory space to be stored, and also runs faster, than that of the EKF. Moreover, it allows the use of the aforementioned separation principle for certain classes of nonlinear systems (Khalil, 2002; Atassi and Khalil, 2000; Esfandiari and Khalil, 1992). High-gain observers currently represent an active area of research, as indicated by Khalil and Praly (2014), and the references therein.
76
Chapter 7
Plant models 7.1 Introduction Proper plant modelling is a prerequisite for the development of the model-based MCS proposed in Part III. Because the modelling of UUVs is quite standardised, see e.g. Antonelli (2014), Sørensen (2013), Fossen (2011), Do and Pan (2009), and Perez and Fossen (2007), this chapter presents the modelling concisely. Emphasis is placed on the modelling of the hydrodynamic e�ects. The explicit dependence of the modelling on time is omitted for the sake simplicity. Nevertheless, the dependence is clearly indicated wherever necessary for clarity.
7.2 Process plant model The Process Plant Model (PPM) is de�ned as the most comprehensive mathematical description of the controlled plant (Sørensen, 2013, 2005), i.e. it is as accurate, and includes as many details, as possible. It is useful in numerical stability and performance robustness analyses, as well as in the initial e�orts towards pre-tuning both the controller and the state observer, if any. In this work, the PPM is built upon the following general premises:
• The locations of both the Centre of Gravity (CG) and the Centre of Buoyancy (CB) of the controlled ROV are �xed; • The ROV operates deeply submerged, i.e. below the wave-a�ected zone � assumed to range from the sea surface down to half the length of the wave; • The velocity and the orientation of the sea current vary slowly enough to be taken as constants; • The �uid � sea water � is irrotational, of constant and uniform density, and of in�nite extent. 77
7. Plant models
Figure 7.1: NED and BF reference frames. Meaningless line �lling text!
7.2.1 Reference frames Two reference frames are simultaneously needed, because the motion has to be referenced in an inertial frame to be meaningfully guided and navigated, whereas the inertia tensor of an ROV, and the hydrodynamic e�ects it experiences during operation, are more easily dealt with if referenced in a frame moving along with the ROV. Figure 7.1 depicts suitable reference frames. One reference frame is the locally inertial NED frame, whose origin ONED is attached at a point on the Earth's surface. Its is used for locally �at Earth navigation. The N-axis is directed towards the Earth's true north, the E-axis is directed eastwards, and the D-axis is directed towards the Earth's centre. The other reference frame is the non-inertial BF frame, whose origin OBF is attached to a convenient point of the structure of the ROV. OBF is often chosen to coincide with the CG of the ROV. The axes of the BF frame are de�ned with respect to the structure of the ROV. The (longitudinal) X-axis is directed from aft to fore, the (transversal) Y-axis is directed from port to starboard, and the (orthogonal) Z-axis is directed from top to bottom. The BF frame changes orientation with respect to the NED frame as the ROV rotates. The Euler angles φ, θ, and ψ [rad] are used to represent the roll, pitch, and yaw movements of the ROV, respectively. The attitude of the BF frame with respect to the NED frame, and the attitude of the ROV likewise, are described by a �xed sequence of three rotations, which is consolidated into the transformation matrix J (η2 ) ∈ R6×6 that is de�ned as 78
7.2. Process plant model " J (η2 ) :=
JL (η2 )
03×3
03×3
JA (η2 )
# (7.1)
where η2 := [ φ, θ, ψ ]T [rad] is the attitude vector, and 03×3 ∈ R3×3 is a null matrix. The rotation matrix matrix JL (η2 ) ∈ SO(3), which handles linear quantities, and the matrix JA (η2 ) ∈ R3×3 , which handles angular quantities, are respectively de�ned as c(θ)c(ψ) −c(φ)s(ψ)+s(φ)s(θ)c(ψ) s(φ)s(ψ)+c(φ)s(θ)c(ψ) JL (η2 ) := c(θ)s(ψ) c(φ)c(ψ)+s(φ)s(θ)s(ψ) −s(φ)c(ψ)+c(φ)s(θ)s(ψ) (7.2)
−s(θ)
s(φ)c(θ)
where s(i) := sin(i) and c(i) := cos(i), i ∈ {φ, θ, ψ}, and 1 sin(φ) tan(θ) cos(φ) tan(θ) cos(φ) − sin(φ) JA (η2 ) := 0
0
sin(φ) sec(θ)
c(φ)c(θ)
(7.3)
cos(φ) sec(θ)
Because JL (η2 ) ∈ SO(3), JL−1 (η2 ) = JLT (η2 ) and det(JL (η2 )) = 1 ∀ φ, θ, ψ ∈ −1 [0, 2 π). On the other hand, JA (η2 ) is not orthogonal. Thus, JA (η2 ) is obtained −1 −1 3×3 by solving JA (η2 ) JA (η2 ) = I3 for JA (η2 ), where I3 ∈ R is an identity matrix. Notice that det(JA (η2 )) = sec(θ), which implicates that θ 6= ±π/2 rad. Fortunately, both forbidden values of the pitch angle, which result in the representation singularity referred to as gimbal lock � degeneration of the space down to a plane because the Y- and Z-axis become parallel �, are hardly ever reached in practice. The reason for the singularity to occur is that JA (η2 ) is not a rotation matrix, but a matrix operator yielding in�nitesimal rotations.
7.2.2 Kinematics The linear and angular velocities of an ROV (Antonelli, 2014; Sørensen, 2013; Fossen, 2011; Do and Pan, 2009; Perez and Fossen, 2007; SNAME, 1950) are given in the BF frame by the dynamic model (7.5), which is to be described next. It is immediate to obtain these velocities in the NED frame by applying the following kinematic transformation based on (7.1) " # " #" # η˙ 1 JL (η2 ) 03×3 ν1 η˙ = = = J (η2 ) ν (7.4) η˙ 2 03×3 JA (η2 ) ν2 where the vector of linear and angular velocities in the BF frame ν ∈ R6 is composed of ν1 = [ u, v, w ]T [m/s], which collects the linear velocities in surge, sway, and heave, taken along the X-, Y-, and Z-axis, respectively, and ν2 = [ p, q, r ]T 79
7. Plant models [rad/s], which collects the angular velocities in roll, pitch, and yaw, taken about the X-, Y-, and Z-axis, respectively. The vector of position and attitude in the NED frame η ∈ R6 is composed of η1 = [ n, e, d ]T [m], which collects the position elements along the N-, E-, and D-axis, respectively, and the aforementioned vector η2 , which collects the attitude elements about the N-, E-, and D-axis, respectively. Hence, the vector of linear and angular velocities in the NED frame η˙ = η(t) ˙ = d [η(t)] , where η(t) = η and the parameter t ∈ R [s] is the time, is composed of >0 dt ˙ θ, ˙ ψ˙ ]T [rad/s]. Notice then that the relations η˙ 1 = [ n, ˙ e, ˙ d˙ ]T [m/s] and η˙ 2 = [ φ, η˙ 1 = JL (η2 ) ν1 and η˙ 2 = JA (η2 ) ν2 hold, according to (7.4).
7.2.3 Rigid body dynamics The dynamic model pursued in this chapter is based on the Newton-Euler equation � classical mechanics. It is given by
MRB ν˙ + CRB (ν2 ) ν = τhd + τhs (η2 ) + τd + τp
(7.5)
where the vectors τhd and τhs (η2 ) represent hydrodynamic and hydrostatic forces and moments, respectively. The e�ects of the sea current are taken into account in τhd . The vector of disturbances τd = [ du , dv , dw , dp , dq , dr ]T represents forces and moments generated by the umbilical cable. The vector τp represents propulsion and steering forces and moments. All vectors but τd , whose denomination is selfexplanatory, are addressed separately in the sequence. This means that the disturbances due to the umbilical cable are not modelled in the present work. The inertia matrix MRB ∈ R6×6 | MRB > 0 is given by " # m I3 −m S(rcg ) MRB = (7.6) m S(rcg ) Icg − m S 2 (rcg ) where m ∈ R>0 [kg] is the (dry) mass, Icg ∈ R3×3 is the inertia tensor with respect to the CG, and S(rcg ) ∈ SS(3) (Skew-Symmetric group of order 3) is a crossproduct matrix. The matrix S(rcg ) stems from the vector rcg = [ xcg , ycg , zcg ]T [m], which gives the location of the CG with respect to OBF , such that 0 −zcg ycg 0 −xcg S(rcg ) = zcg (7.7) −ycg xcg 0 The Coriolis-centripetal matrix CRB (ν2 ) ∈ R6×6 , which can be straightforwardly derived from MRB , is given by " # m S(ν2 ) −m S(ν2 ) S(rcg ) CRB (ν2 ) = (7.8) m S(rcg ) S(ν2 ) −S((Icg − m S 2 (rcg )) ν2 ) 80
7.2. Process plant model where the cross-product matrix S(ν2 ) ∈ SS(3), which stems from the vector ν2 , is given by 0 −r q 0 −p (7.9) S(ν2 ) = r −q p 0 and the cross-product matrix S((Icg − m S 2 (rcg )) ν2 ) ∈ SS(3), which stems from the vector (Icg − m S 2 (rcg )) ν2 ∈ R3 , is determined likewise.
Hydrodynamics The ROV motion transfers mechanical energy to the �uid, which is a dissipative medium, with the result that the �uid accelerates and the motion is a�ected to some extent. The energy transfer produces hydrodynamic e�ects appearing as the ROV, the �uid, or both have non-zero accelerations or velocities. The hydrodynamic e�ects are typically divided into viscous e�ects and e�ects approached by the potential theory � inviscid �uid � (Sørensen, 2013; Fossen, 2011; Lewandowski, 2004; Faltinsen, 1990; Newman, 1977; Abkowitz, 1972). Drag/lift forces and moments are viscous e�ects due to the motion of the ROV relative to the �uid, i.e. the ROV can be either moving through the still �uid, or standing still against the sea current, e.g. in DP. Added masses and the so-called Munk moments, which are also referred to as potential e�ects due to the sea current, are approached by the potential theory (Faltinsen, 1990; Newman, 1977). The wave zone potential damping, which is typically frequency-dependent, can be neglected, whenever the ROV is operating deeply submerged, whereupon the added mass can be simpli�ed to asymptotic values regarding a wave frequency equal to zero. All e�ects are typically modelled by combinations of analytical and semi-empirical methods, where the model coe�cients are typically obtained from dedicated hydrodynamic software codes, e.g. WAMIT, tank tests, or full-scale trials performed with the ROV. The vector of hydrodynamic e�ects τhd ∈ R6 is given by
τhd = − MA ν˙ r − CA (νr ) νr − DL (κ, νr ) νr − DQ |νr |νr
(7.10)
where the vector of relative linear and angular velocities νr ∈ R6 in the BF frame is given by " # " # " # νr1 ν1 ν c1 νr = = − = ν − νc (7.11) νr2 ν2 03 where the vector of sea current velocities νc = [ νcT1 , 0T3 ]T is composed of νc1 = [ uc , vc , wc ]T [m/s], which collects the linear velocities of the sea current in the BF 81
7. Plant models frame, and 03 ∈ R3 is a null vector. Notice then that νr2 = ν2 . Notice also that νc is so de�ned because of the premise of irrotational sea current. Consequently, d [νr (t)], where νr (t) = νr . Lastly, the vector of signed the vector ν˙ r = ν˙ r (t) = dt quadratic relative velocities |νr |νr ∈ R6 is de�ned herein as � �T |νr |νr := |ur |ur |vr |vr |wr |wr |p|p |q|q |r|r (7.12) The sea current velocities are more naturally expressed in the NED frame through the vector νcNED = νcNED (αh , αv ), which is given by � �T νcNED = Vc cos(αh ) cos(αv ) sin(αh ) cos(αv ) sin(αv ) 0 0 0 (7.13) where Vc ∈ R>0 [m/s] is the constant sea current speed, αh ∈ R | αh ∈ (−π, π] [rad] is a constant angle, contained in the horizontal NE-plane, that is measured from the N-axis, and αv ∈ R | αv ∈ [−π/2, π/2] [rad] is a constant angle, contained in a vertical plane, that is measured from the NE-plane. The last three entries of (7.13) are likewise null because of the premise of irrotational sea current. Therefore, (7.14)
νc = νcBF = J T(η2 ) νcNED and
ν˙ c = ν˙ cBF =
(7.15)
d T NED dt [J (η2 (t))] νc
where the matrix J (η2 (t)) = J (η2 ) is given in (7.1). Notice that ν˙ cNED = 06 , where 06 ∈ R6 is a null vector, is used in (7.15), because of the premise of constant sea current. Notice also that νc and ν˙ c are time-varying under the matrix J (η2 ). The added mass inertia matrix MA ∈ R6×6 | MA > 0, also sometimes referred to as the virtual mass inertia matrix, which comes from the quadratic expression of the kinetic energy the �uid possesses due to the pressure �eld created around the accelerating ROV, is de�ned as Xu˙ Xv˙ Xw˙ Xp˙ Xq˙ Xr˙ Y Yv˙ Yw˙ Yp˙ Yq˙ Yr˙ u˙ Zu˙ Zv˙ Zw˙ Zp˙ Zq˙ Zr˙ MA := (7.16) K u˙ Kv˙ Kw˙ Kp˙ Kq˙ Kr˙ Mu˙ Mv˙ Mw˙ Mp˙ Mq˙ Mr˙
Nu˙
Nv˙
Nw˙
Np˙
Nq˙
Nr˙
7.1. The thirty-six hydrodynamic derivatives of MA are constant, because they are predominantly dependent on the shape of the controlled ROV and negligibly dependent on its velocity, despite the fact that, in practice, every entry may slightly vary over time about its nominal value, mostly depending on operating and environmental conditions. All the elements of MA are expected
Assumption
82
7.2. Process plant model to be non-zero and distinct, since an ROV typically has an open-frame structure with asymmetries in the shapes and distribution of the parts and components, apart from the interconnections, e.g. cables and tubes, among the parts and components randomly spread inwards. The added mass Coriolis-centripetal matrix CA (νr ) ∈ R6×6 , which can be straightforwardly derived from MA , is given by �� �T � 03×3 S cA1 cA2 cA3 CA (νr ) = − �� (7.17) �� �T � �T � S cA1 cA2 cA3 S cA4 cA5 cA6 where the cross-product matrices S([ cA1 , cA2 , cA3 ]T ), S([ cA4 , cA5 , cA6 ]T ) ∈ SS(3) stem from the vectors [ cA1 , cA2 , cA3 ]T and [ cA4 , cA5 , cA6 ]T , respectively, such that 0 −cA3 cA2 �� � �T 0 −cA1 S cA1 cA2 cA3 = cA3 (7.18) −cA2 cA1 0 and
�� S cA4
cA5
cA6
�T �
0
= cA6 −cA5
−cA6 0 cA4
cA5
−cA4
(7.19)
0
where cAi = cAi (νr ), and cAi (νr ) ∈ R | cAi (νr ) := (MA )i νr , i ∈ N | i ∈ {1, . . . , 6}, where (MA )i denotes a (row) vector that is equal to the entire i-th row of MA . The matrix DL (κ, νr ) ∈ R6×6 models the linear damping due to linear skin friction in laminar �ows, i.e. at very low �ow velocities. The matrix DQ ∈ R6×6 models the nonlinear damping due to vortex shedding and quadratic skin friction in turbulent �ows. Together, the matrices DL (κ, νr ) and DQ allow linear e�ects to be strengthened at lower velocities and gradually vanish as nonlinear e�ects take over at higher velocities. The matrices are de�ned as Xur exp(−κ |ur |) Xvr exp(−κ |vr |) . . . Xr exp(−κ |r|) Y exp(−κ |u |) Y exp(−κ |v |) . . . Y exp(−κ |r|) r vr r r ur Zur exp(−κ |ur |) Zvr exp(−κ |vr |) . . . Zr exp(−κ |r|) DL (κ, νr ) := K exp(−κ |u |) K exp(−κ |v |) . . . K exp(−κ |r|) (7.20) r vr r r ur Mur exp(−κ |ur |) Mvr exp(−κ |vr |) . . . Mr exp(−κ |r|)
Nur exp(−κ |ur |) Nvr exp(−κ |vr |) . . . Nr exp(−κ |r|) and 83
7. Plant models X|ur |ur
X|vr |vr
X|wr |wr
X|p|p
X|q|q
X|r|r
Y |ur |ur Z|ur |ur DQ := K |ur |ur M|ur |ur
Y|vr |vr
Y|wr |wr
Y|p|p
Y|q|q
Z|vr |vr
Z|wr |wr
Z|p|p
Z|q|q
K|vr |vr
K|wr |wr
K|p|p
K|q|q
M|vr |vr
M|wr |wr
M|p|p
M|q|q
Y|r|r Z|r|r K|r|r M|r|r
N|ur |ur
N|vr |vr
N|wr |wr
N|p|p
N|q|q
N|r|r
(7.21)
where κ ∈ R>0 determines how fast the stability derivatives of (7.20) decay as kνr k increases. Experimental data (Refsnes and Sørensen, 2012) suggested the use of exponential terms in DL (κ, νr ), in order to force the linear damping to decrease under increasing velocities, since the �ow becomes turbulent for increased velocities, whereupon the damping is better modelled by DQ working alone.
7.2. The thirty-six hydrodynamic derivatives of DL (κ, νr ), as well as those of DQ , are constant, despite the fact that, in practice, every entry may slightly vary over time about its nominal value, mostly depending on operating and environmental conditions. All the elements of both matrices are expected to be non-zero and distinct, since an ROV typically has an open-frame structure with asymmetries in the shapes and distribution of the parts and components, apart from the interconnections, e.g. cables and tubes, among the parts and components randomly spread inwards. Assumption
7.3. The modelling of the hydrodynamic damping based on the matrices DL (κ, νr ) and DQ provides a satisfactory approximation of the actual damping. It presents an intermediate level of complexity between fully decoupled models � diagonal matrices �, e.g. Sørensen et al. (2012), Fossen (2011), Smallwood and Whitcomb (2004), and Caccia et al. (2000b), and fully coupled, hence more accurate, models, e.g. Martin and Whitcomb (2012, 2008). The latter typically have as many time-varying matrices collecting nonlinear damping coe�cients as the number of modelled DoFs. There are also other ways of modelling the nonlinear damping, e.g. Sørensen (2013), Fossen and Ross (2012), Fossen (2011), and Lewandowski (2004). The term DQ |νr |νr seen in (7.10) is preferred in this work because DQ becomes a constant matrix. Assumption
7.1. An analogy to justify the use of DL (κ, νr ) and DQ : an openframe ROV is subject to a stiction-like phenomenon, as it experiences relatively more intense damping forces and moments at the motion imminence than when already set in motion. The term stiction is a portmanteau of `static friction'. An ROV has a large wet surface due to its complex construction. At very low �ow velocities, the large surface creates signi�cant hydrodynamic damping. At increased �ow velocities, however, shedding e�ects reduce the wet surface due to the partial `shadowing' created by closely installed parts.
Remark
84
7.2. Process plant model
Hydrostatics The roll and pitch movements, i.e. φ 6= 0 rad and θ 6= 0 rad, respectively, induce forces and moments on the ROV, which would be equal to zero otherwise. The vector of restoring forces and moments τhs (η2 ) ∈ R6 is given by " # JLT (η2 ) (Whs + Bhs ) τhs (η2 ) = (7.22) � � rcg × JLT (η2 ) Whs + rcb × JLT (η2 ) Bhs where Whs = [ 0, 0, W ]T [N] is built upon the weight force W ∈ R>0 | W = m g [N] that acts upon the CG pointing downwards, where g ∈ R>0 [m/s2 ] is the acceleration of gravity, Bhs = [ 0, 0, −B ]T is built upon the buoyancy force B ∈ R>0 | B = ρ g ∇ [N] that acts upon the CB pointing upwards, where ρ ∈ R>0 [kg/m3 ] is the �uid density and ∇ ∈ R>0 [m3 ] is the volume of �uid displaced by the ROV, and the vector rcb = [ xcb , ycb , zcb ]T [m] gives the location of the CB with respect to OBF . The forces W and B are parallel to D-axis, since they are functions of g .
7.2. It is safer to have the ROV designed slightly positive buoyant, i.e. B > W , because it can naturally emerge to the sea surface in case a hard failure occurs in the MCS. On the other hand, a thrust force, whose value amounts to (B − W) N, is permanently demanded from the propulsion system in order to keep the ROV submerged. Remark
Propulsion system Marine thrusters cannot be modelled by �nite-dimensional models based on �rst principles (Sørensen, 2013). In particular, the complex nature of the propeller�uid interaction makes it di�cult to accurately model thrusters. To overcome crucial modelling shortcomings, a combination of analytical and semi-empirical techniques has to be employed to produce simpli�ed models. Static mappings are commonly used simpli�cations whereby the angular velocity np ∈ R [rad/s] of a propeller is related to the thrust force T ∈ R [N] it develops (Sørensen, 2013; Caccia et al., 2000b; Ishidera et al., 1986). Furthermore, the typical electromechanical servo velocity loop of a thruster has a negligible time constant in comparison with the time constants of the ROV dynamics (Do and Pan, 2009; Caccia et al., 2000b). An example of static mapping is depicted in Figure 7.2. It concerns a thruster of the ROV Minerva, see Appendix C. The curves were adapted from the experimental data found in Ludvigsen and Ødegaard (2005, 2004). The thrust force delivered by a thruster can be modelled as
T = (1 − tp ) (kT0 ρ D4 |np |np − kT1 ρ D3 |np | vw )
(7.23)
where tp ∈ R>0 | tp ∈ (0, 1) is a global thrust deduction coe�cient that clusters together all losses with respect to the open-water thrust. Losses are mainly caused 85
7. Plant models 250
vw vw vw vw vw
200 Thrust [N]
150 100
= −0.7m/s = −0.35m/s = 0m/s = 0.5m/s = 1m/s
50 0 −50 −100 −1200 −900
−600 −300 0 300 600 Propeller angular velocity [rpm]
900
1200
Figure 7.2: Example of static mapping of thrust force.
by: i) the increased hydrodynamic drag that arises from the local pressure reduction that stems from the propeller suction; ii) the motion of the propeller along with the ROV; and iii) the �ow disturbances caused by other components of the ROV closely installed and/or other propellers working nearby (Sørensen, 2013; Fossen, 2011; Lewandowski, 2004; Ishidera et al., 1986). The constant D ∈ R>0 [m] denotes the propeller disc diameter, and vw ∈ R [m/s] is the water in�ow velocity into the nozzle of the thruster, which di�ers from vrel ∈ R [m/s] � projection of the vector of relative velocities νr of the self-propelled ROV onto a straight line parallel to propeller shaft � due to: i) potential and viscous hydrodynamic e�ects; and ii) the last two just mentioned causes of thrust loss. The actual value of the water in�ow velocity can be determined through
vw = (1 − wp ) vrel
(7.24)
where wp ∈ R>0 | wp ∈ (0, 1) is the wake fraction number. The nominal thrust coe�cients are kTi ∈ R>0 , i ∈ {0, 1}. They are two-folded typically, i.e. kT+i holds for np > 0, whereas kT−i holds for np < 0. They are obtained from open-water tank tests carried out with the propeller alone under near lossless operating conditions, i.e. tp ≈ 0, and are commonly approximated (Sørensen, 2013; Fossen and Blanke, 2000; Blanke et al., 2000) by a linear function of the so-called advance number
J = vw /(D np ) 86
(7.25)
7.3. Control plant model The coe�cient kT0 corresponds to the bollard pull operating condition in which vw = 0 m/s. The thrust con�guration matrix of the propulsion system (Sørensen, 2013; Fossen, 2011) is denoted Tp ∈ Rq×p , p > q , where q is the dimension of the con�guration space � number of actuated DoFs (Breivik and Fossen, 2009) �, and p is the number of thrusters which actuate the con�guration space. The vector of propulsion and steering forces and moments τp ∈ R6 is given by
� τp = Tp T1
T2
...
Tp−1
Tp
�T
(7.26)
where Ti , i ∈ N | i ∈ {1, 2, . . . , p}, represents the thrust force delivered by the i-th thruster, which is given by (7.23).
7.2.4 The process plant model The pursued PPM is obtained by putting (7.4) and a dynamics equation referenced in the BF frame together. The dynamics equation is obtained by �rstly substituting (7.10), (7.15), (7.22), and (7.26) into (7.5), and then manipulating algebraically the resulting equation afterwards. The PPM is given in the state space by η˙ = J (η2 ) ν M ν˙ = − CRB (ν2 ) ν − CA (νr ) νr − DL (κ, νr ) νr − DQ |νr |νr (7.27) T NED ˙ + MA J (η2 ) νc + τhs (η2 ) + τd + τp where M = MRB + MA > 0 and J˙T(η2 ) = J˙T(η2 (t)) =
d T dt [J (η2 (t))].
7.3 Control plant model The Control Plant Model (CPM) is a diligently simpli�ed version of the PPM. It is introduced for controller and observer design purposes (Sørensen, 2005, 2013). Some simpli�cations can be performed in the mathematical modelling because the controller dominates certain terms of the closed-loop dynamics, e.g. damping and restoring forces and moments. The CPM is also useful in the analytical stability analysis of the resulting closed-loop system. In this work, the CPM is built upon the general premises underlying the PPM, see Section 7.2, plus the following assumptions:
7.4. The con�guration space (Breivik and Fossen, 2009) can be restricted to the four DoFs of interest, namely surge, sway, heave, and yaw, which are controlled by the MCS proposed in Chapter 8. Both uncontrolled DoFs, namely roll and pitch, are self-stable by the design of the ROV � metacentric stability Assumption
87
7. Plant models �, are not actuated at all, and span negligibly narrow ranges, i.e. |φ(t)|, |θ(t)| ≈ 0 rad ∀ t > 0 s. Thus, both DoFs can be permanently disregarded. This means that both the 4th and the 5th elements of the vectors must be removed. The reduction in the dimension of the model causes all vectors de�ned within Section 7.2 to be rede�ned as e.g. τhs := [ 0, 0, (W − B), 0 ]T and τp := Tp [ T1 , T2 , . . . , Tp−1 , Tp ]T , where Tp ∈ R4×p . In particular, it causes ν2 and η2 to be reduced to ν2 (t) = r(t) d ˙ [ψ(t)] = r(t) = ν2 (t). and η2 (t) = ψ(t), respectively, whereupon η˙ 2 (t) = ψ(t) = dt The reduction a�ects all matrices de�ned within Section 7.2 likewise. This means that the whole 4th and 5th rows and columns of the matrices must be removed. Notice then that the transformation matrix J (η2 ) = J (ψ) ∈ SO(4).
7.5. The decay rate κ of the entries of DL (κ, νr ) can be dropped for the sake of stability proo�ng, when it comes to the MCS proposed in Chapter 8. The total hydrodynamic damping e�ects have to be curve re�tted, such that DL ∈ R4×4 | DL > 0 and DQ ∈ R4×4 | DQ > 0 are both constant.
Assumption
Assumption
7.6.
The thrust force T can be satisfactorily approximated by (7.28)
T = kT (np ) |np |np
where kT (np ) ∈ R>0 is the nominal thrust mapping, which is a nonlinear function of the angular velocity of the propeller np that is determined in tank tests performed under the bollard pull condition with the ROV fully assembled. The mapping kT (np ) already includes the overall loss. The reason for simplifying the expression of the thrust force is to drop the explicit dependence on vw from (7.23), because vw is neither measured nor estimated in the present work.
7.7. The terms in (7.10) which generate perturbations in (7.5), whereupon do likewise in (7.27), due to the sea current, can be isolated from (7.10) and collected in the vector of current-generated perturbations τc (ν, νc , ν˙ c ) ∈ R4 , which is referenced in the BF frame. The vector τc (·) can be immediately obtained in the NED frame through the use of (7.14)�(7.15). The reason for creating τc (·) is that νcNED is neither measured nor estimated in the present work. Towards this end, �rstly the vectors νr , ν˙ r , |νr |νr ∈ R4 are resolved into
Assumption
νr = ν − νc
and
ν˙ r = ν˙ − ν˙ c
(7.29)
and
|νr |νr = |ν|ν + (|ν − νc |(ν − νc ) − |ν|ν)
(7.30)
where |ν − νc |(ν − νc ) ∈ R4 in (7.30) denotes a column vector that entails four multiplications carried out componentwise � Hadamard, or Schur, product � i.e. |ν − νc |(ν − νc ) = [ |u − uc |(u − uc ), |v − vc |(v − vc ), |w − wc |(w − wc ), |r|r ]T . Recall the fact rc = 0 rad/s under the premise of irrotational sea current. 88
7.3. Control plant model Then, the expansion of the term CA (νr ) νr yields (7.31)
CA (νr ) νr := CA (ν) ν + CA1 (ν) νc + CA2 (νc ) νc where the matrices CAi ( · ) ∈ R4×4 , i ∈ {1, 2}, are de�ned as
ν T TX MA
CA1 (ν) := −
ν T TY MA
01×4 T T ν T TN MA + MA TN
�
(7.32)
and
" CA2 (νc ) :=
03×4
# (7.33)
νcT TN MA
where 0i×4 ∈ Ri×4 , i ∈ {1, 3}, are null matrices, and TX , TY , TN ∈ R4×4 are constant sparse matrices, such that
0
0
0 0
0 TX := 0
0
0 0 0 0 −1 0 0 0 0 0 , TY := , and TN := 0 0 0 0 0 0 0 0 0 0
0
0 −1 0 0
0 0 0 0
1 0 0 0
0
0
1 0 0
(7.34)
0 0 0
where TN ∈ SS(4). Finally, by collecting the terms of interest from (7.10), with the aid of (7.31), and then manipulating algebraically the resulting equation afterwards, the vector of current-generated perturbations τc (ν, νc , ν˙ c ) is de�ned as
τc (ν, νc , ν˙ c ) := MA ν˙ c − CA1 (ν) νc − CA2 (νc ) νc + DL νc + DQ (|ν|ν − |ν − νc |(ν − νc ))
(7.35)
where τc (ν, νc , ν˙ c ) = 04 ⇔ νc = 04 , where 04 ∈ R4 is a null vector. The vector τc (·) also provides useful information on the sea current. It can be used, among other possibilities, to:
• estimate νc , but such a goal is not pursued in the present work; • help to determine the needed capacity of the propulsion system of the ROV during the design stage. 89
7. Plant models
7.3.1 The control plant model The pursued CPM is obtained by putting (7.4) and a dynamics equation referenced in the BF frame together, both under the reduction in the dimension of the model to four DoFs. The dynamics equation is derived from (7.27) with the aid of (7.31) and under the aforementioned assumptions. The CPM is given in the state space by ( η˙ = J (ψ) ν (7.36) M ν˙ = − C(ν) ν − DL ν − DQ |ν|ν + τc + τhs + τp where M = MRB + MA > 0, C(ν) = CRB (ν) + CA (ν), where C(ν) = C(ν2 ) = ˙ , and τc = τc (ν, νc , ν˙ c ) in (7.35) for the sake of simplicity. C(r) = C(ψ)
7.3.
Notice that the vector of disturbances τd = [ du , dv , dw , dr ]T � already with both the 4th and the 5th rows removed with regard to the counterpart in (7.27) �, see Subsection 7.2.3, is not present in (7.36). The reason to drop τd is to simplify the CPM, since the disturbances � forces and moment � generated by the umbilical cable are neither measured nor estimated in the present work. Remark
90
Chapter 8
Motion control system 8.1 Introduction The MCS presented in this chapter consists in a model-based MIMO output feedback control system that works in tandem with an open-loop guidance system. The control system is presented in Section 8.2. The navigation system is presented in Section 8.3. Both of them are built upon the CPM found in Subsection 7.3.1 in Chapter 7. The guidance system builds upon the path generation scheme presented in Part II of this thesis, and is not treated again in this chapter. Figure 6.1 in Chapter 6 depicts a block diagram of the MCS where the controlled plant is represented by the NTNU's ROV Minerva. The explicit dependence of the MCS on time is omitted for the sake simplicity. Nevertheless, the dependence is clearly indicated wherever necessary for clarity.
8.2 Control system The control system performs two tasks:
• Linearisation of the plant dynamics; T T T • Asymptotic tracking of the reference vector xR := [ ηR , νR ] ∈ R8 .
The �rst task is performed aiming at helping the performance of the second task, and at enabling the use of the linear HGSO to estimate the (possibly) unmeasured plant state variables, i.e. velocities, and �lter the measured plant state variables. T T T T ] ∈ The full vector of suitable and su�ciently smooth references [ ηR , νR , ν˙ R R12 that is generated by the guidance system is composed of the position and heading angle reference vector ηR := [ nR , eR , dR , ψR ]T , which is referenced in the NED frame, see Subsection 7.2.1, of the velocity reference vector νR := [ uR , vR , 91
8. Motion control system wR , rR ]T , which is referenced in the BF frame, see Subsection 7.2.1 and, lastly, d of the acceleration reference vector ν˙ R = ν˙ R (t) = dt [νR (t)], where νR (t) = νR and the parameter t ∈ R>0 [s] is the time. Recall from Section 4.2 in Chapter 4 d [ηR (t)] = J (ψ(t)) νR (t), where ηR (t) = ηR and ψ(t) = ψ , and that η˙ R (t) = dt see also Section 7.3.
8.2.1 Separation principle 8.1.
The plant state vector x := [ η T , ν T ]T ∈ R8 is available for feedback as if measured, whereas it is in reality the estimated vector x ˆ := [ η ˆT , T T 8 ν ˆ ] ∈ R supplied by the HGSO. This assumption is supported by a separation principle based on the use of the HGSO. Such a separation principle holds for certain classes of nonlinear systems (Khalil, 2002; Atassi and Khalil, 2000; Esfandiari and Khalil, 1992), including the proposed MCS, given that: • The controlled plant is left-invertible and minimum-phase; Assumption
• The state feedback control system is globally bounded in the state vector. The left-inversion problem characterises structural properties of a model with regard to estimation and reconstruction of its state vector (Estrada et al., 2007). Exact asymptotic tracking cannot be achieved by non-minimum-phase systems (Franklin et al., 2009; Slotine and Li, 2005). Moreover, such type of system is often the source of considerable di�culty in synthesising well-behaved state feedback control systems (Friedland, 1986). The controlled plant is left-invertible and minimum-phase if its linearised version also has both characteristics (Esfandiari and Khalil, 1992). This is indeed the case in this work, as it is shown later in this section. It is shown in Subsection 8.2.3 that the (state feedback) control system is GES. This means that its region of attraction is the whole vector space D ≡ R12 , which is an equivalent condition to that of being globally bounded in the state vector. Finally, it is shown in Section 8.4 that the proposed output feedback control system is also GES.
8.1. Global boundedness in the state vector can always be achieved by saturating either the control or the estimated state vector outside a compact region of interest D ⊂ Rk , where k ∈ N>0 (Khalil, 2002). This is important to avoid that the high-valued short-duration peaks in the estimated state vector, which are intrinsically produced by the HGSO, as discussed in Section 8.3, severely a�ect the closed-loop system response, as the controller may overreact to them. For instance, a locally stable controller would be driven to instability by an estimate peaking outside its basin of attraction. Consider the following LTI system derived from the CPM in (7.36) ( z˙ = A z + B (τc + τp ) (8.1) y =Cz Remark
92
8.2. Control system where z ∈ R8 is the state vector, y ∈ R4 is the output vector, τc ∈ R4 is the perturbation vector de�ned in (7.35), and τp ∈ R4 is the propulsion and steering vector rede�ned in Section 7.3. Notice that τc and τp are two input vectors of the system (8.1). Let the matrices be de�ned as # " # " 04×4 04×4 J (ψ) � � , B := , and C := I4 04×4 (8.2) A := M −1 04×4 −M −1 DL where J (ψ) is constant for any constant heading angle ψ rad, and 04×4 , I4 ∈ R4×4 are the null and identity matrices of order 4. In particular, ψ = 0 rad is preferred, yielding J (0) = I4 , without loss of generality. Notice that M and DL are the only matrices kept from (7.36). How this is achieved is detailed later. The matrix pair (A, B) is controllable, as the controllability matrix C ∈ R8×32 given by � � C = B A B A 2 B A 3 B A 4 B A5 B A 6 B A 7 B (8.3) has full row rank, provided that e.g. det([ B A B ]) = det(M −2 ) > 0. Notice that ∃ M −1 | M > 0, see Subsection 7.3.1. The matrix pair (A, C) is observable, as the observability matrix O ∈ R32×8 given by � �T O = C T AT C T (A2 )T C T . . . (A6 )T C T (A7 )T C T (8.4) has full column rank, provided that e.g. det([ C T AT C T ]T ) = det(I8 ) = 1, where I8 ∈ R8×8 is an identity matrix. It can be concluded that the LTI system (8.1) is:
• a minimal realisation, because it has no transmission zeros in the whole complex plane, and having no such zeros implies having no zeros at all � in particular, having no zeros in the right-hand plane �, whereupon it is a minimum-phase system; • left-invertible, as the transfer function matrix G(s) = C (s I8 − A)−1 B ∈ R4×4 has full rank ∀ s ∈ C. Equivalently, dim(ker(G(s))) = 0 ∀ s ∈ C. Details on these properties can be found in e.g. Franklin et al. (2009), Estrada et al. (2007), Slotine and Li (2005), Friedland (1986), and Kailath (1980). The separation principle (Khalil, 2002; Atassi and Khalil, 2000; Esfandiari and Khalil, 1992) is therefore assumed to hold for the present nonlinear system, as the conditions on both the CPM and the state feedback controller are satis�ed. No proof is repeated herein, and the interested reader is referred to the cited works for details and the proof. The perturbation theory (Khalil, 2002; Kokotovi¢ et al., 1999), which deals with dynamical systems containing di�erent scales, whether space or time, is commonly employed therein to demonstrate that the state estimation by the HGSO converges very fast to the actual plant states for high enough gains of the state observer. Hence, two time scales coexist in the output feedback 93
8. Motion control system control system, namely the slower state feedback dynamics and the faster state estimation dynamics, such that the system performance under output feedback becomes almost indistinguishable from that under state feedback.
8.2.2 Control vector The control vector u ∈ R4 is de�ned as (8.5)
u := ulin + upid + uff
where ulin tackles to cancel out the nonlinear terms in the dynamics of the CPM in (7.36), upid implements full state feedback, and uff provides reference feedforward. The three terms in (8.5) are detailed in the sequence.
Thrust allocation The thrust allocation block, see Figure 6.1, converts the control vector u into p individual signals µi ∈ R � either voltages or currents � which control the thruster servos, where µ ∈ Rp | µ := [ µ1 , µ2 , . . . , µp−1 , µp ]T . The signals then produce the vector τp in (7.36) through τp := Tp [ T1 , T2 , . . . , Tp−1 , Tp ]T , see Section 7.3. The control signals are given by q (8.6) µi := θi sgn(Ti ) |Ti | / kTi (npi ) for i ∈ {1, . . . , p}, based on (7.28), where θi ∈ R>0 | θi := µi /npi are scaling factors � inverse thruster servo gains � which relate the signals µi to the corresponding propeller angular velocities npi [rad/s], and Ti [N] are the thrust forces wanted the propellers to deliver, such that
�
T1
T2
...
Tp−1
Tp
�T
:= Tp? u
(8.7)
where Tp? ∈ Rp×4 is the thrust allocation algorithm given by the constant mapping
Tp? := Wp−1 TpT (Tp Wp−1 TpT )−1
(8.8)
which basically consists in the Moore-Penrose pseudo-inverse of the thrust con�guration matrix Tp of the propulsion system, see Subsection 7.2.3 �rst, and then Section 7.3. The typically diagonal matrix Wp ∈ Rp×p | Wp = WpT > 0 weights the thruster usage, so that it is possible to reach an optimal thrust allocation through the minimisation of the quadratic cost function
JT := min (θTT Wp θT ) kθT k
94
(8.9)
8.2. Control system subject to τp − Tp θT = 04 , where θT := [ T1 , T2 , . . . , Tp−1 , Tp ]T and 04 ∈ R4 is a null vector. Details on such unconstrained least-squares optimisation problem can be found in e.g. Fossen et al. (2009) and Fossen and Sagatun (1991).
Linearisation of the dynamics of the control plant model The nonlinear terms C(ν) ν and DQ |ν|ν in the dynamics of the CPM in (7.36) can theoretically be cancelled out by state feedback, as both satisfy the matching condition, i.e. they enter the dynamics equation at the same point the control vector τp does (Khalil, 2002), or, equivalently, they belong to the same range space of the input matrix B in (8.2). The vector τhs also satis�es the matching condition, whereupon it can also theoretically be eliminated. Cancelling them out corresponds to applying the method of computed torque, which is popular in the �eld of robotics (Franklin et al., 2009). The linearisation vector ulin ∈ R4 is de�ned as (8.10)
b d ulin := C(ν) ν +D Q |ν|ν − τhs where
b := WC ◦ C(ν) C(ν)
and
d D Q := WQ ◦ DQ
(8.11)
where C(ν), DQ , and τhs are the nominal expressions of C(ν), DQ , and τhs implemented in the MCS. The nominal matrices C(ν) and DQ may slightly di�er from their actual counterparts, since C(ν) and DQ have �xed entries, whereas both actual matrices may vary slowly, as stated in Subsection 7.2.3. The nominal matrices often have diagonal structures, because it is di�cult to obtain accurate estimates of their o�-diagonal elements (Sørensen, 2013; Fossen, 2011; Lewandowski, 2004; Caccia et al., 2000b). The vector τhs may also slightly di�er from the actual τhs . The matrices WC , WQ ∈ R4×4 weight, i.e. scale, the entries of C(ν) and DQ , respectively, because, in practice, it is better to have some small residual nonlinear e�ects, than overcompensating for the nonlinear terms. The symbol `◦' in (8.11) represents the entrywise Hadamard, or Schur, product between two matrices of identical dimensions.
8.2. The vector ulin represents the best endeavour towards linearising the dynamics of the CPM. However, the nonlinearities can never be exactly cancelled out, because the CPM always contains modelling simpli�cations and parameter uncertainties. Remark
Asymptotic trajectory tracking The control objective is to achieve kxR −xk → 0 as t → ∞. The task is performed by a MIMO PID controller aided by reference feed-forward � anticipative action. 95
8. Motion control system PID controllers �t well applications where su�ciently damped 2nd-order dynamics are dealt with (Åström and Hägglund, 2011). Asymptotic tracking needs feedforward action to ensure that the required control e�ort to achieve the goal is provided (Åström and Hägglund, 2011; Franklin et al., 2009; Slotine and Li, 2005; Friedland, 1986). The state feedback vector upid ∈ R4 is de�ned as
upid := KP J T(ψ) eη + KI J T(ψ) eI + KD eν
(8.12)
∈ R is the tracking error vector, whose components where are the position and heading tracking error vector eη ∈ R4 | eη := ηR − η , the velocity tracking error vector eν ∈ R4 | eν := νR −ν , and the integral of eη evaluated Rt over time eI ∈ R4 | eI := 0 eη (τ ) dτ , and the diagonal matrices KP , KI , KD ∈ R4×4 | KP , KI , KD > 0 keep the proportional, integral, and derivative gain sets of the controller. A method for tuning the PID controller is suggested and discussed in Subsection 8.2.4. The reference feedforward vector uff ∈ R4 is de�ned as et := [ eTI , eTη , eTν ]T
12
(8.13)
d c ˙R uff := D L νR + M ν where
d D L := WL ◦ DL
and
c := WM ◦ M M
(8.14)
where DL and M are the nominal expressions of DL and M implemented in the MCS. The nominal matrices DL and M may slightly di�er from their actual counterparts, since DL and M have �xed entries, whereas both actual matrices may vary slowly, as stated in Subsection 7.2.3. The nominal matrices often have diagonal structures, because it is di�cult to obtain accurate estimates of their o�-diagonal elements (Sørensen, 2013; Fossen, 2011; Lewandowski, 2004; Caccia et al., 2000b). The matrices WL , WM ∈ R4×4 weight, i.e. scale, the entries of DL and M , respectively, because, in practice, it is advantageous, in terms of tracking performance, to consider that the plant has less damping and inertia than it actually has, as this may result in smoother control actions. The symbol `◦' in (8.14) represents the entrywise Hadamard, or Schur, product between two matrices of identical dimensions.
8.2.3 Tracking error dynamics By substituting (8.10), (8.12), and (8.13) into (8.5), and then by substituting (8.5) into (7.36) through (8.6)�(8.9) and the relation τp := Tp [ T1 , T2 , . . . , Tp−1 , Tp ]T , see Section 7.3, and lastly by performing a few algebraic operations to the �nally obtained expression, the tracking error dynamics is found to be given by t T T T e˙ t = Tt (ψ) At TtT(ψ) et + Bδt δt (ν) + BR [ νR , ν˙ R ] − Bδt τc
96
(8.15)
8.2. Control system where Tt (ψ) := blockdiag(J (ψ), J (ψ), I4 ) ∈ SO(12), and
04×4
I4
04×4
At =
04×4
04×4
I4
−M
−1
Bδt = [ 04×4
KI 04×4
−M
−1
KP
−M
−1
(8.16)
(DL + KD ) (8.17)
M −T ]T
and
04×4
04×4
t BR =
04×4
04×4
d M −1 (DL − D L)
c I4 − M −1 M
(8.18)
where 04×4 , I4 ∈ R4×4 are the null and identity matrices of order 4, respectively, and δt (ν) ∈ R4 lumps together all the mismatches which stem from the attempt to linearise the dynamics of (7.36) through state feedback under the inevitable presence of modelling errors in (8.10), such that
b d δt (ν) = (C(ν) − C(ν)) ν + (DQ − D Q ) |ν|ν
(8.19)
Notice that the more exactly the parameters of the CPM are known, the closer t to zero the mismatch vector δt (ν) and the reference input matrix BR are, with (WC )i,j = (WL )i,j = (WM )i,j = (WQ )i,j = 1, where i, j ∈ {1, 2, 3, 4}, i.e. with all entries of the weighting matrices equal to one. The vector of references T T T [ νR , ν˙ R ] remains bounded ∀ t ∈ R>0 and vanishes eventually, see Chapter 4. Assumption 8.2. The vector δt (ν) remains `small' ∀ t ∈ R>0 , and vanishes eventually along with νR , in case τc also remains `small'. This assumption is reasonably realistic in practice, as long as a fairly accurate CPM is available. In fact, δt (ν) ≈ 04 for νR ≈ 04 , e.g. DP, with νcNED ≈ 04 . Remark 8.3. It is obviously expected that the propulsion system is capable of counteracting τc , so that (τp )i > (τc )i ∀ t ∈ R>0 , i ∈ {1, 2, 3, 4}. Otherwise, the ROV is unable to perform any task. The vector τc can be used to determine the needed capacity of the propulsion system, as suggested in Section 7.3.
8.3. The vector of restoring forces τhs is practically cancelled, i.e. τhs − τhs ≈ 04 . Notice that it is already omitted from (8.15).
Assumption
97
8. Motion control system
Stability analysis Consider the global di�eomorphism ξt := TtT(ψ) et (Khalil, 2002; Slotine and Li, 2005), based on the transformation Tt (ψ). Equation (8.15) can be rewritten as
˙ ξt + B t δt (ν) + B t [ ν T , ν˙ T ]T − B t τc ξ˙t = Ξt (ψ) δ R R R δ
(8.20)
where
˙ = At − T T(ψ) T˙t (ψ) = At + ψ˙ blockdiag(TN , TN , 04×4 ) Ξt (ψ) t
(8.21)
is a simpler Linear Time Varying (LTV) system matrix. Notice that the matrices t t = BR and Bδt are not a�ected by the transformation TtT(ψ), so that TtT(ψ) BR t t t T BR and Tt (ψ) Bδ = Bδ hold. The relation
˙ := − T T(ψ) T˙t (ψ) = ψ˙ blockdiag(TN , TN , 04×4 ) St (ψ) t
(8.22)
d d ˙ where T˙t (ψ(t)) = dt [Tt (ψ(t))], and ψ(t) = dt [ψ(t)] = r(t) [rad/s] is the yaw rate, is based on the constant sparse skew-symmetric matrix TN in (7.34). The system representations (8.15) and (8.20) are equivalent, although the latter shows clearer how the heading angle changes a�ect the tracking error dynamics. The stability of the origin ξt∗ = 012 � the only equilibrium point � of the un˙ ξt extracted from (8.20), where 012 ∈ R12 is a null forced LTV system ξ˙t = Ξt (ψ) vector, is studied by: i) suitably regarding such a system as a feedback connection between the auxiliary subsystems S1 and S2 , as indicated in Figure 8.1, where S1 is an LTI dynamical system and S2 is an LTV memoryless function (Khalil, 2002); and ii) then applying the circle criterion (Slotine and Li, 2005; Khalil, 2002; Lozano et al., 2000).
Figure 8.1: Feedback connection between the auxiliary subsystems S1 and S2 . The origin of the unforced subsystem S1 is GES, once At is Hurwitz, and the matrix At can always be rendered Hurwitz, because the matrix pair (A, B) in (8.2) is controllable, see Subsection 8.2.1. Let the subsystem S1 be de�ned as seen in Figure 8.1. The matrix Bt := CtT , where Ct ∈ R4×12 is the following constant sparse matrix " # I2 02×2 02×2 02×2 02×2 02×2 Ct := (8.23) 02×2 02×2 I2 02×2 02×2 02×2 98
8.2. Control system where 02×2 , I2 ∈ R2×2 are the null and identity matrices of order 2, respectively. The matrices Bt and Ct have full rank, i.e. rank(Bt ) = rank(Ct ) = 4. The matrix pair (At , Bt ) is controllable, as the controllability matrix C t ∈ R12×48 given by � � A11 C t = Bt At Bt A2t Bt A3t Bt . . . A9t Bt A10 (8.24) t Bt t Bt has full row rank, provided that e.g. det([ Bt A2t Bt A4t Bt ]) 6= 0. The matrix pair (At , Ct ) is observable, as the observability matrix O t ∈ R48×12 given by � � T T T T T (A11 (8.25) O t = CtT ATt CtT (A2t )T CtT . . . (A10 t ) Ct t ) Ct has full column rank, provided that e.g. det([ CtT (A2t )T CtT (A4t )T CtT ]T ) 6= 0. The hydrodynamic derivatives of DL and MA , whereupon also of M , are all expected to be non-zero and distinct, see Subsection 7.2.3. This fact guarantees that C t and O t have full rank, since At is comprised of DL and M −1 . Then, the (Hurwitz) transfer function matrix Ht (s) := Ct (s I12 − At )−1 Bt ∈ R4×4 associated with S1 , where I12 ∈ R12×12 is an identity matrix, is Strictly Positive Real (SPR), as there exist a matrix Pt = PtT > 0, where Pt := I12 , a matrix Qt ∈ R12×12 | Qt := Γt Υt , both to be de�ned soon, and a constant εt ∈ R>0 | εt > max(|λi (Λt )|), i ∈ {1, . . . , 12}, where Λt is also to be de�ned soon, which satisfy the relations in (8.26) regarding the Kalman-Yakubovich-Popov (KYP) lemma (Khalil, 2002; Lozano et al., 2000) ( T At Pt + Pt At = − Qt QTt − εt Pt (8.26) Pt Bt = CtT where Γt ∈ R12×12 is an orthogonal matrix that forms a basis of R12 with the eigenvectors of (ATt +At ), and Λt ∈ R12×12 is a diagonal matrix that is comprised of the eigenvalues of the orthogonally diagonalisable symmetric matrix (ATt +At ) T T (Horn and Johnson, 2013), such that Ap t + At = Γt Λt Γt . The diagonal matrix 12×12 Υt ∈ R | Υt > 0, where (Υt )i,i := εt + (Λt )i,i , i ∈ {1, . . . , 12}. It can also be concluded that S1 is (state) strictly passive, once Ht (s) is SPR, according to Slotine and Li (2005), Khalil (2002), and Lozano et al. (2000). ˙ ∈ SS(4) of the subsystem S2 , see Figure 8.1, be Let the matrix Ψt (ψ) " #" #! 0 1 0 1 ˙ = ψ˙ blockdiag Ψt (ψ) , (8.27) −1 0 −1 0
˙ ϕt = ξ T Bt Ψt (ψ) ˙ Ct ξt = 0 ∀ ψ˙ ∈ R ∧ ∀ t ∈ R>0 ∧ Then, ϕTt ζt = ϕTt Ψt (ψ) t ˙ . The relation Bt = C T ∀ ϕt ∈ R4 (ξt ∈ R12 ), due to the skew-symmetry of Ψt (ψ) t ˙ ϕt lies in the sector is utilised above. It immediate to conclude that ϕTt Ψt (ψ) [0, ∞), whereupon S2 is a lossless passive subsystem, according to Slotine and Li (2005), Khalil (2002), and Lozano et al. (2000). 99
8. Motion control system It can be concluded, based on the application of the circle criterion, that ξt∗ is ˙ ξt is viewed as consisting of a GES (Lozano et al., 2000, Th. 3.5), once ξ˙t = Ξt (ψ) feedback connection between the SPR transfer function matrix Ht (s) � subsystem S1 � and the lossless passive subsystem S2 , as depicted in Figure 8.1. Finally, based on the concluded global stability of ξt∗ , thereby implying that of e∗t = 012 , it can be inferred that the trajectory tracking control objective kxR − xk → 0 as t → ∞ can always be attained. In particular, for persistent current-generated perturbations, i.e. τc 6= 0 ∀ t ∈ R>0 , and vanishing vector T T T of references [ νR , ν˙ R ] , under the inevitable presence of modelling errors, all solutions of (8.20), and those of (8.15) likewise, converge into a small ball Bt of radius ρ Bt ∈ R>0 | ρ Bt < 1 � ρ Bt � 1 ideally � centred at ξt∗ ≡ e∗t . The radius ρ Bt is ultimately de�ned by the gains of the MIMO PID controller, so that ρ Bt is directly proportional to kτc k, and inversely proportional to the controller gains.
8.2.4 Tuning of the MIMO PID controller Tuning a MIMO PID controller is a hard task in general, because it frequently involves a considerable number of variables. The complexity of the derived expressions often render the tuning problem di�cult to analyse and solve analytically. Finding the optimal tuning is an even harder task, that may be practically unfeasible for higher-order systems. Numerical techniques, e.g. exhaustive search, Genetic Algorithms (GAs), and optimisation, among others, are thus commonly employed to �nd a satisfactory tuning. Common to all techniques is the fact that every candidate tuning has to be numerically evaluated, and the number of candidates grows exponentially with the size of the problem � combinatorial explosion �, whereupon a prohibitively long time may be demanded to complete the tuning process.
8.1. (Exhaustive search) The present case has 12 gains to be determined, i.e. the diagonal elements of the matrices KP , KI , and KD . By taking 12 sparse sets, if each set has N ∈ N candidate gains, N 12 computer simulations have to be performed in total. If N = 5, which is a low number of candidates that yields poor tuning, 512 = 244140625 simulations are needed. If each simulation lasts 1 s, then a period of circa 7 years and 9 months is required in order for this poor tuning process to be completed! This example shows clearly that a simpler tuning approach has to be considered in this case. Example
Contribution 8.1. It is suggested in this work to tune the controller based on the well-known optimal criterion named Integral of Time multiplied by Absolute Error (ITAE), which was originally developed for linear Single-Input-SingleOutput (SISO) systems (Åström and Hägglund, 2011; Franklin et al., 2009; Graham and Lathrop, 1953). This criterion is adapted and replicated to four decoupled SISO systems herein. The gains are de�ned as
100
8.2. Control system c ) Ω2 KP := 2 diag(M c ) Ω3 KI := diag(M c) Ω KD := 3 diag(M
(8.28)
where the constants are derived from those appearing in the denominator of the 3rd-order ITAE prototype transfer function for zero tracking error of acceleration references (Graham and Lathrop, 1953). The pre-existent amount of damping is ignored in the calculation, i.e. DL ≡ 04×4 momentarily, in order to make sure that KD > 0, which is a necessary condition for stability. Hence, more damping is always added to the system. The original constant values, when it comes to the matrices KP and KD , respectively, are 4.94 and 2.97 but, however, the value 4.94 proved to be too high in the battery of full-scale sea trials from which selected results are reported in Section 8.6. Thus, the value 4.94 underwent a reduction of ≈ 60 %, based on results from full-scale sea trials and numerical simulations, both based on the ROV Minerva. The value 2.97 was just rounded up to 3. c ) keeps only the main diagonal of M c in (8.14), and the The matrix diag(M diagonal matrix Ω ∈ R4×4 is de�ned as −1 c ))−1 WΩ diag(D d Ω := 2 π ((diag(M L ))
(8.29)
where Ω is the multivariable version of the scalar counterpart ω = 2 π/τ [rad/s], d where τ ∈ R>0 [s] is the natural motion period. The matrix diag(D L ) keeps 4×4 d only the main diagonal of D in (8.14), and the diagonal matrix W L Ω ∈ R weights the controller gains, so that the higher an entry of WΩ , the lower the gains c and D d regarding the corresponding DoF. The use of the diagonal elements of M L is strictly required in order to guarantee that KP , KI , KD > 0. This tuning approach guarantees that all coe�cients of the following 12thorder characteristic polynomial of At
pAt (s) = det(I4 s3 + M −1 ((DL + KD ) s2 + KP s + KI ))
(8.30)
remain strictly positive, which is a necessary, although not su�cient, condition for stability of At (Franklin et al., 2009; Friedland, 1986). The stability is then assessed by �nding the location of the eigenvalues of At , i.e. by �nding the zeros of the characteristic equation pAt (s) = 0. This important result holds as long as M > 0 and DL > 0, independently of whether these matrices have or not diagonal structures. A thorough proof of the statement about the positiveness of the coe�cients of pAt (s) is omitted for the sake of brevity, although a hint for the simplest case can be suitably provided as follows: if all matrices in (8.30) are considered to be diagonal, then four independent 3rd-order SISO systems arise, whereupon the expected result naturally arises by �nding the zeros of pAt (s) = 0. 101
8. Motion control system
Stability robustness Robust stability against plant parameter variations can be attained at the expense of fairly intensive algebraic work on pAt (s), which can be substantially speeded up with the aid of a computer, as the 12 controller gains ultimately depend only on the four entries of WΩ . The intervals of (WΩ )i,i , i ∈ {1, 2, 3, 4}, where At remains Hurwitz under presumed changes of the entries of M and DL � with M > 0 and DL > 0 � can be conservatively found via the Routh-Hurwitz stability criterion (Franklin et al., 2009; Friedland, 1986), or via the Kharitonov polynomials (Mansour and Anderson, 1993; Dasgupta, 1988; Kharitonov, 1979) or, alternatively, via the Ger²gorin's discs (Horn and Johnson, 2013). The latter is more restrictive, and has therefore limited usefulness in providing the desired intervals, despite its simplicity, and the lessened analysis complexity it demands. The suggested approach provides an easier manner to tackle the tuning task, since the gains of the MIMO PID controller become ultimately dependent solely on the diagonal entries of WΩ . This means that the gains can be readily calculated through the use of (8.28)�(8.29) once the elements of the main diagonal of both matrices M and DL are identi�ed in full-scale tests performed with the controlled ROV either in a tank or at the sea. The tuning problem thus resides in determining the appropriate entries of WΩ , with the advantage o�ered by the adopted control architecture � MIMO PID controller, feedback linearisation of the plant dynamics, and reference feedforward working together � that each entry of WΩ corresponds to a DoF which is independent from all other DoFs to a certain extent. As satisfactory performance must be sought, this objective underlies the process of deciding the values of the entries of WΩ . However, prior to directly using any newly calculated set of gains KP , KI , and KD , equation (8.30) has to be used to assess the stability of At in the manner described above, i.e. to determine the eigenvalues of At through �nding the zeros of pAt (s) = 0, where the newly calculated set of gains has to yield stability in the worst-case scenario, given the presumed variation ranges of the entries of M and DL . Fine-tuning can be achieved by tweaking the gains individually, i.e. by directly changing the diagonal entries of KP , KI , and KD , after a satisfactory coarser tuning is achieved, always making sure that the gains yield stability in the worstcase scenario through the use of (8.30).
8.3 Navigation system 8.3.1 Introduction Reconstruction and �ltering of the plant state vector are tasks of the navigation system, in which a state observer plays the central role. See also Subsection 6.2.3. In an output feedback control system, in particular, the observer reconstructs, i.e. 102
8.3. Navigation system estimates, the (possibly) unmeasured state variables based on the measured variables (Franklin et al., 2009; Khalil, 2002; Atassi and Khalil, 2000; Friedland, 1999, 1986; Kailath, 1980). Furthermore, as the measurements are typically noisy, and may also be jumpy and get frozen awhile, these distortions must be smoothed out prior to supplying the state feedback controller (Sørensen, 2013). An HGSO is used in the MCS, as seen in Figure 6.1 in Chapter 6. This section focuses on an application of the theory mainly found in Khalil (2002), Atassi and Khalil (2000), and Esfandiari and Khalil (1992).
8.3.2 High-gain state observer Shortly recalling its main features, the HGSO is a linear system based on the model of the plant that behaves approximately like a di�erentiator. It is robust to estimate the unmeasured states, while rejecting the e�ect of disturbances due to unmodelled dynamics and parameter uncertainties. It allows an output feedback control system to recover the performance achievable under state feedback, so that both performances become almost indistinguishable when the observer gains are su�ciently high. Moreover, the region of attraction under state feedback is practically recovered when the observer gains are su�ciently high. The gains are ultimately determined by a small tuning parameter, e.g. ε ∈ R>0 | ε � 1, which scales the estimation error dynamics, causing the estimated states to converge very fast towards the plant states. Such gains ultimately yield much faster poles, whereupon much faster dynamics, than the closed-loop dynamics of the output feedback control system the HGSO is part of, a fact that is in good agreement with the linear state estimation theory found in e.g. Franklin et al. (2009), Friedland (1999), Friedland (1986), Kailath (1980). Because of the high gains, it also produces impulsive-like transient responses, i.e. high-valued peaks of short duration proportional to the estimation errors, implying the existence of terms of the form (a/ε) exp(−b t/ε) in the response, for some a ∈ R, b ∈ R>0 , and ε & 0, i.e. ε tending to zero from the right. The intrinsic so-called peaking phenomenon may be evident at the initial time instant, when the estimation error is typically larger than during the remaining operating time. The amplitudes of the peaks tend to in�nity, and their duration tend to zero, as ε & 0. On the other hand, in practice, the gains only need to be su�ciently high, and there are also limiting factors, e.g. trade-o� between the estimation accuracy and the bandwidth of the output feedback control system (Khalil, 2002; Atassi and Khalil, 2000). The initial peaks can be avoided, or at least drastically attenuated, in practice, if the initial state of the controlled plant is known by the HGSO. 103
8. Motion control system
8.3.3 Asymptotic state estimation The estimation objective is to achieve kx− x ˆk → 0 as t → ∞, where x ˆ := [ η ˆT , ν ˆT ]T 8 ∈ R is the estimated state vector. The HGSO is implemented here based on the CPM in (7.36), yet keeping only the linear portion of the dynamics of (7.36), as it follows
x ˆ˙ = Te (ψ) Ae TeT(ψ) x ˆ + Be v + Te (ψ) L TeT(ψ) (y − y ˆ)
(8.31)
where Te (ψ) := blockdiag(J (ψ), I4 ) ∈ SO(8), and the remaining matrices are given by " # " # 04×4 I4 04×4 Ae = and Be = (8.32) c −1 D d c −1 04×4 −M M L and
" L=
�−1 L11
γ �−1 L12
�−2 L21
γ �−2 L22
# (8.33)
where Lij ∈ R4×4 , i, j ∈ {1, 2}, are tuning submatrices which compose the output injection matrix L, the small constant � ∈ R>0 | � � 1 is a global tuning parameter yielding the high-gains, γ ∈ N | γ ∈ {0, 1} indicates the availability of the velocity measurements, where γ = 1 means `available', v ∈ R4 | v := upid + uff is the control vector dedicated to the HGSO, y := [ η T , γ ν T ]T ∈ R8 is the measurement vector, and y ˆ ≡ Ce x ˆ, where Ce ∈ R8×8 | Ce := blockdiag(I4 , I4 ), is the estimated state vector actually feeding the control system in Section 8.2. It is worthwhile to realise the resemblance kept between the matrix pair formed by Ae and Be in (8.32), and the corresponding matrix pair in (8.2).
8.3.4 Estimation error dynamics By substituting (8.10), (8.12), and (8.13) into (8.5), and then by substituting (8.5) into (7.36) through (8.6)�(8.9) and the relation τp := Tp [ T1 , T2 , . . . , Tp−1 , Tp ]T , see Section 7.3, the closed-loop trajectory tracking control subsystem � 1st subsystem � is set. To derive the closed-loop state observation subsystem � 2nd subsystem �, (8.12) and (8.13) are �rst added to yield v , and then the 2nd subsystem is set by substituting v into (8.31). By subtracting the expression of the 2nd subsystem from the expression of the 1st subsystem, and lastly by performing a few algebraic operations, the estimation error dynamics is found to be given by e e˙ e = Te (ψ) (Ae − L) TeT(ψ) ee + BK TtT(ψ) et + BIe δe (ˆ ν ) − B δt (ν) e T T T + BR [ νR , ν˙ R ] + B τc
104
(8.34)
8.3. Navigation system where ee ∈ R8 | ee := x− x ˆ is the estimation error vector, the vectors δt (ν) and τc are de�ned in (8.19) and (7.35), respectively, see Subsection 7.3.1, the matrix B is T T T de�ned in (8.2), the tracking error vector et , the vector of references [ νR , ν˙ R ] , and the transformation matrix Tt (ψ) are all de�ned in Subsection 8.2.3, and " # " # 04×4 04×4 0 4×4 e BIe = and BR = (8.35) d c −I4 ∆M D ∆M M L and
" e BK
=
04×4
04×4
04×4
∆M KI
∆M KP
∆M KD
# (8.36)
c −1 , and δe (ˆ where ∆M ∈ R4×4 | ∆M := M −1 − M ν ) is another mismatch vector, which stems from the attempt to linearise the dynamics of (7.36) through state feedback under the inevitable presence of modelling errors in (8.10), such that c −1 D d δe (ˆ ν ) = ((M −1 DL ) − (M ˆ L )) ν
(8.37)
Notice that the more exactly the parameters of the CPM are known, the closer e to zero the mismatch vector δe (ˆ ν ), the residual reference input matrix BR , and e the residual control input matrix BK are, with (WL )i,j = (WM )i,j = 1, i, j ∈ {1, 2, 3, 4}.
8.4.
T T T The vectors et , δt (ν), and [ νR , ν˙ R ] remain bounded ∀ t ∈ R>0 , and also practically vanish eventually. This assumption is based on the analysis and conclusion drawn in Subsection 8.2.3.
Assumption
Stability analysis Consider the global di�eomorphism ξe := TeT(ψ) ee (Khalil, 2002; Slotine and Li, 2005), based on the transformation Te (ψ). Equation (8.34) can be rewritten as e e T T T ˙ ξe + B e δe (ˆ ξ˙e = Ξe (ψ) ν ) − B δt (ν) + BK ξt + BR [ νR , ν˙ R ] + B τc I
(8.38)
where
˙ = (Ae − L) − T T(ψ) T˙e (ψ) = (Ae − L) + ψ˙ blockdiag(TN , 04×4 ) Ξe (ψ) e
(8.39)
e e is a simpler LTV system matrix. Notice that the matrices BIe , B , BK , and BR T T e e T are not a�ected by the transformation Te (ψ), so that Te (ψ) BI = BI , Te (ψ) B e e e e = B , TeT(ψ) BK = BK , and TeT(ψ) BR = BR hold. The relation
˙ := − T T(ψ) T˙e (ψ) = ψ˙ blockdiag(TN , 04×4 ) Se (ψ) e
(8.40) 105
8. Motion control system d d ˙ where T˙e (ψ(t)) = dt [Te (ψ(t))], and ψ(t) = dt [ψ(t)] = r(t) [rad/s] is the yaw rate, is based on the constant sparse skew-symmetric matrix TN in (7.34). The di�eomorphism ξt := TtT(ψ) et de�ned in Subsection 8.2.3 is also utilised to obtain (8.38). The systems (8.34) and (8.38) are equivalent, although the latter shows clearer how the heading angle changes a�ect the estimation error dynamics. The stability of the origin ξe∗ = 08 � the only equilibrium point � of the ˙ ξe extracted from (8.38), where 08 ∈ R8 is a null unforced LTV system ξ˙e = Ξe (ψ) vector, is studied by: i) suitably regarding such a system as a feedback connection between the auxiliary subsystems S1 and S2 , as indicated in Figure 8.2, where S1 is an LTI dynamical system and S2 is an LTV memoryless function (Khalil, 2002); and ii) then applying the circle criterion (Slotine and Li, 2005; Khalil, 2002; Lozano et al., 2000).
Figure 8.2: Feedback connection between the auxiliary subsystems S1 and S2 .
The origin of the unforced subsystem S1 is GES, once the matrix (Ae − L) is Hurwitz. The matrix (Ae −L) can always be rendered Hurwitz, as the entries of L can be freely chosen. Let the subsystem S1 be de�ned as seen in Figure 8.2. The matrix Be := CeT , where Ce ∈ R4×8 | Ce := [ I4 04×4 ]. The matrices Be and Ce have full rank, i.e. rank(Be ) = rank(Ce ) = 4. The matrix pair (Ae , Be ) is controllable, as the controllability matrix C e ∈ R8×32 given by � � C e = Be Ae Be A2e Be A3e Be A4e Be A5e Be A6e Be A7e Be (8.41) has full row rank, provided that e.g. det([ Be Ae Be ]) = det(−�−2 L21 ) 6= 0. The matrix pair (Ae , Ce ) is observable, as the observability matrix O e ∈ R32×8 given by � �T O e = CeT ATe CeT (A2e )T CeT . . . (A6e )T CeT (A7e )T CeT (8.42) has full column rank, given that e.g. det([ CeT ATe CeT ]T ) = det(I4 − γ �−1 L12 ) 6= 0. Then, the (Hurwitz) transfer function matrix He (s) := Ce (s I8 − Ae + L)−1 Be ∈ R4×4 associated with S1 is SPR, as there exist a matrix Pe = PeT > 0, where Pe := I8 , a matrix Qe ∈ R8×8 | Qe := Γe Υe , both to be de�ned soon, and a constant εe ∈ R>0 | εe > max(|λi (Λe )|), i ∈ {1, . . . , 8}, where Λe is also to be de106
8.3. Navigation system �ned soon, which satisfy the relations in (8.43) regarding the KYP lemma (Khalil, 2002; Lozano et al., 2000) ( (Ae − L)T Pe + Pe (Ae − L) = − Qe QTe − εe Pe (8.43) Pe Be = CeT where Γe ∈ R8×8 is an orthogonal matrix that forms a basis of R8 with the eigenvectors of (Ae − L)T + (Ae − L), and Λe ∈ R8×8 is a diagonal matrix that is comprised of the eigenvalues of the orthogonally diagonalisable symmetric matrix (Ae − L)T + (Ae − L) (Horn and Johnson, 2013), such that 8×8 T | Υe > 0, (Ae − L)T + (Ap e − L) = Γe Λe Γe . The diagonal matrix Υe ∈ R where (Υe )i,i := εe + (Λe )i,i , i ∈ {1, . . . , 8}. It can also be concluded that S1 is (state) strictly passive, once He (s) is SPR, according to Slotine and Li (2005), Khalil (2002), and Lozano et al. (2000).
˙ ∈ SS(4) of the subsystem S2 , see Figure 8.2, be deLet the matrix Ψe (ψ) ˙ := ψ˙ TN , where the constant sparse skew-symmetric matrix TN is �ned as Ψe (ψ) ˙ Ce ξe = 0 ∀ ψ˙ ∈ ˙ ϕe = ξ T Be Ψe (ψ) de�ned in (7.34). Then, ϕTe ζe = ϕTe Ψe (ψ) e 4 8 ˙ . The R ∧ ∀ t ∈ R>0 ∧ ∀ ϕe ∈ R (ξe ∈ R ), due to the skew-symmetry of Ψe (ψ) T T ˙ ϕe relation Be = Ce is utilised above. It immediate to conclude that ϕe Ψe (ψ) lies in the sector [0, ∞), whereupon S2 is a lossless passive subsystem, according to Slotine and Li (2005), Khalil (2002), and Lozano et al. (2000).
It can be concluded, based on the application of the circle criterion, that ξe∗ is ˙ ξe is viewed as consisting of a GES (Lozano et al., 2000, Th. 3.5), once ξ˙e = Ξe (ψ) feedback connection between the SPR transfer function matrix He (s) � subsystem S1 � and the lossless passive subsystem S2 , as depicted in Figure 8.2.
Finally, based on the concluded global stability of ξe∗ , thereby implying that of = 08 , it can be inferred that the state estimation objective kee k = kx − x ˆk → 0 as t → ∞ can always be attained. In particular, for persistent current-generated T T T perturbations, i.e. τc 6= 0 ∀ t ∈ R>0 , and vanishing vector of references [ νR , ν˙ R ] , under the inevitable presence of modelling errors, all solutions of (8.38), and those of (8.34) likewise, converge into a small ball Be of radius ρ Be ∈ R>0 | ρ Be < 1 � ρ Be � 1 ideally � centred at ξe∗ ≡ e∗e . The radius ρ Be is ultimately de�ned by the gains of the HGSO, so that ρ Be is directly proportional to kτc k, and inversely proportional to the observer gains.
e∗e
107
8. Motion control system
8.3.5 Tuning The tuning approach suggested in this subsection is heuristic and based on simulation and experimental results. When it comes to underwater applications in general, the sensitivity to measurement errors and noise is a major concern. In particular, the position measurements provided by hydroacoustic positioning systems typically have unfavourable characteristics, namely low update rates, e.g. 6 1 Hz, jumps, and frozen measurements. The linear velocity measurements, when available, are typically provided by Doppler Velocity Logs (DVLs) under low update rates, e.g. ≈ 1 Hz. On the other hand, the controlled plants typically have slow and overdamped dynamics. Therefore, an HGSO can be satisfactorily tuned with relatively high gains. The output injection matrix L in (8.33) damps the estimation response in such a manner that a certain trade-o� between relying more upon the response that is predicted based on the CPM, or relying more upon the incoming measurements instead, can be exploited. Indeed, such kind of trade-o� is a common feature of all state observation algorithms. In some cases, instead of one single tuning matrix, there are multiple tuning matrices, e.g. the EKF. The greater the amount of damping represented by L, the slower the estimation response with regard to changes in the measurements.
8.2. It is suggested in this work to tune the HGSO as it follows, apart from the constant � ∈ R>0 | � � 1, which has to be as small as possible in practice (Khalil, 2002). Contribution
c −1 Lij = Kij M
where
Kij := diag(κ1ij , κ2ij , κ3ij , κ4ij )
(8.44)
where κ1ij , κ2ij , κ3ij , κ4ij ∈ R>0 , i, j ∈ {1, 2}, are 16 constants, and the numbers 1, 2, 3, and 4 are not exponents. Moreover, 1 2 3 4 κ11 , κ11 , κ11 , κ11 ∈ (0, 100] κ112 , κ212 , κ312 , κ412 ∈ [1, 20] (8.45) K21 = cK1 K11 where cK1 ∈ R | cK1 ∈ (0, 5] K22 = cK2 K12 where cK2 ∈ R | cK2 ∈ [1, 50] Furthermore, it is necessary in �rst place to make sure that the tuning renders the matrix (Ae − L) Hurwitz.
8.4 Stability of the output feedback control system The stability of the output feedback control system, i.e. the whole MCS, is studied based on the previously obtained partial results. The expressions of the tracking 108
8.4. Stability of the output feedback control system error dynamics in (8.20) and of the estimation error dynamics in (8.38) are of particular interest in the analysis. The pair of expressions (8.15) and (8.34) could have been optionally chosen for such task instead. The output feedback control system can be expressed as T c T T T ˙ ξc + B c [ (δt (ν) − τc )T , δ T (ˆ ξ˙c = Ξc (ψ) ˙R ] I e ν ) ] + BR [ νR , ν
(8.46)
where ξc := [ ξtT , ξeT ]T ∈ R20 is the state vector, [ (δt (ν) − τc )T , δeT (ˆ ν ) ]T ∈ R8 is T T T the vector of perturbations � internal and external �, [ νR , ν˙ R ] is the same vector of references used before, and the matrices are de�ned as " # At 012×8 ˙ = Ac + Sc (ψ) ˙ Ξc (ψ) and Ac = (8.47) e BK (Ae − L)
˙ := ψ˙ blockdiag(TN , TN , 04×4 , TN , 04×4 ) Sc (ψ)
(8.48)
and
" BIc
=
Bδt
012×4
−B
BIe
#
" and
c BR
=
t BR e BR
# (8.49)
where 012×j ∈ R12×j , j ∈ {4, 8}, are two null matrices. The other matrices are e de�ned either in Subsection 8.2.3 or in Subsection 8.3.4. The matrix BK is ideally null, implicating that Ac is ideally a block diagonal matrix. This would only occur under the ideal conditions: i) x ˆ = x � assumed to hold throughout Section 8.2; and ii) there are neither modelling errors nor plant parameter variations, such that ∆M = 04×4 in (8.36).
8.4. The separation principle (Franklin et al., 2009; Khalil, 2002; Friedland, 1986; Kailath, 1980) is naturally manifested in (8.46)�(8.47), in particular, through the cascade structure of the matrix Ac , because the studied output feedback control system admits such a linear representation. Remark
The stability of the origin ξc∗ = 020 � the only equilibrium point � of the un˙ ξc extracted from (8.46), where 020 ∈ R20 is a null forced LTV system ξ˙c = Ξc (ψ) vector, is studied by: i) suitably regarding such a system as a feedback connection between the auxiliary subsystems S1 and S2 , as indicated in Figure 8.3, where S1 is an LTI dynamical system and S2 is an LTV memoryless function (Khalil, 2002); and ii) then applying the circle criterion (Slotine and Li, 2005; Khalil, 2002; Lozano et al., 2000). The origin of the unforced subsystem S1 is GES, once the lower triangular matrix Ac in (8.47) is Hurwitz. The matrix Ac can always be rendered Hurwitz, since the matrices At and (Ae − L) can always be individually rendered Hurwitz likewise, as concluded in Subsection 8.2.3 and Subsection 8.3.4, respectively. 109
8. Motion control system
Figure 8.3: Feedback connection between the auxiliary subsystems S1 and S2 .
Let the subsystem S1 be de�ned as seen in Figure 8.3. The matrix Bc := CcT , where Cc ∈ R8×20 is the following constant sparse matrix 1 0 0 0 0 0 0 0 0 0 0 0 0 0 0 0 0 0 0 0 0 1 0 0 0 0 0 0 0 0 0 0 0 0 0 0 0 0 0 0 0 0 0 0 1 0 0 0 0 0 0 0 0 0 0 0 0 0 0 0 0 0 0 0 0 1 0 0 0 0 0 0 0 0 0 0 0 0 0 0 Cc := blockdiag(Ct , Ce ) = (8.50) 0 0 0 0 0 0 0 0 0 0 0 0 1 0 0 0 0 0 0 0 0 0 0 0 0 0 0 0 0 0 0 0 0 1 0 0 0 0 0 0 0 0 0 0 0 0 0 0 0 0 0 0 0 0 1 0 0 0 0 0
0 0 0 0 0 0 0 0 0 0 0 0 0 0 0 1 0 0 0 0 The matrices Bc and Cc have full rank, i.e. rank(Bc ) = rank(Cc ) = 8. The matrix pair (Ac , Bc ) is controllable, as the controllability matrix C c ∈ R20×160 given by � � 19 A18 (8.51) C c = Bc Ac Bc A2c Bc A3c Bc . . . A17 c Bc Ac Bc c Bc has full row rank, provided that e.g. det([ Bc A2c Bc A4c Bc ]) 6= 0. The matrix pair (Ac , Cc ) is observable, as the observability matrix O c ∈ R160×20 given by
� O c = CcT
ATc CcT
(A2c )T CcT
...
T T (A18 c ) Cc
T T (A19 c ) Cc
�T
(8.52)
has full column rank, provided that e.g. det([ CcT (A2c )T CcT (A4c )T CcT ]T ) 6= 0. The hydrodynamic derivatives of DL and MA , whereupon also of M , are all expected to be non-zero and distinct, see Subsection 7.2.3. This fact guarantees that C c and O c have full rank, since Ac is comprised of At , which in turn is comprised of DL and M −1 . Then, the (Hurwitz) transfer function matrix Hc (s) := Cc (s I20 −Ac )−1 Bc ∈ R8×8 associated with S1 , where I20 ∈ R20×20 is an identity matrix, is SPR, as there exist a matrix Pc = PcT > 0, where Pc := I20 , a matrix Qc ∈ R20×20 | Qc := Γc Υc , both to be de�ned soon, and a constant εc ∈ R>0 | εc > max(|λi (Λc )|), i ∈ {1, . . . , 20}, where Λc is also to be de�ned soon, which sat110
8.4. Stability of the output feedback control system isfy the relations in (8.53) regarding the KYP lemma (Khalil, 2002; Lozano et al., 2000)
(
ATc Pc + Pc Ac = − Qc QTc − εc Pc
(8.53)
Pc Bc = CcT
where Γc ∈ R20×20 is an orthogonal matrix that forms a basis of R20 with the eigenvectors of (ATc +Ac ), and Λc ∈ R20×20 is a diagonal matrix that is comprised of the eigenvalues of the orthogonally diagonalisable symmetric matrix (ATc +Ac ) T T (Horn and Johnson, 2013), such that Ap c + Ac = Γc Λc Γc . The diagonal matrix 20×20 Υc ∈ R | Υc > 0, where (Υc )i,i := εc + (Λc )i,i , i ∈ {1, . . . , 20}. It can also be concluded that S1 is (state) strictly passive, once Hc (s) is SPR, according to Slotine and Li (2005), Khalil (2002), and Lozano et al. (2000). ˙ ∈ SS(8) of the subsystem S2 , see Figure 8.3, be Let the matrix Ψc (ψ)
˙ := blockdiag(Ψt (ψ), ˙ Ψe (ψ)) ˙ Ψc (ψ) " #" 0 1 0 = ψ˙ blockdiag , −1 0 −1
1 0
#" ,
0
1
−1
0
#" ,
0
0
0
0
#!
(8.54)
˙ and Ψe (ψ) ˙ are de�ned in Subsection 8.2.3 and Subwhere the matrices Ψt (ψ) ˙ C c ξc = ˙ ϕc = ξ T Bc Ψc (ψ) section 8.3.4, respectively. Then, ϕTc ζc = ϕTc Ψc (ψ) c 8 20 0 ∀ ψ˙ ∈ R ∧ ∀ t ∈ R>0 ∧ ∀ ϕc ∈ R (ξc ∈ R ), due to the skew-symmetry of ˙ . The relation Bc = C T is utilised above. It immediate to conclude that Ψc (ψ) c ˙ ϕc lies in the sector [0, ∞), whereupon S2 is a lossless passive subsysϕTc Ψc (ψ) tem, according to Slotine and Li (2005), Khalil (2002), and Lozano et al. (2000). It can be concluded, based on the application of the circle criterion, that ξc∗ is ˙ ξc is viewed as consisting of a GES (Lozano et al., 2000, Th. 3.5), once ξ˙c = Ξc (ψ) feedback connection between the SPR transfer function matrix Hc (s) � subsystem S1 � and the lossless passive subsystem S2 , as depicted in Figure 8.3. For persistent current-generated perturbations, i.e. τc 6= 0 ∀ t ∈ R>0 , and T T T , ν˙ R ] , under the inevitable presence of modvanishing vector of references [ νR elling errors, all solutions of (8.46) converge into a small ball Bc of radius ρ Bc ∈ R>0 | ρ Bc < 1 � ρ Bc � 1 ideally � centred at ξc∗ . The radius ρ Bc is ultimately de�ned by the gains of the MIMO PID controller and of the HGSO, so that ρ Bc is directly proportional to kτc k, and inversely proportional to the controller and state observer gains.
8.3. The global exponential stability concluded for ξc∗ = 020 is the main result sought in Section 8.4. It indicates that the proposed model-based MIMO output feedback control system can work stably in practice. Contribution
111
8. Motion control system Remark 8.5. The resulting system (8.46), and the subsequently carried out analysis, are due to the representation choices made initially. Had the estimated state x ˆ been explicitly used back in Section 8.2, as it is typically done in the analysis of LTI systems, see e.g. Franklin et al. (2009), Friedland (1986), and Kailath (1980), equation (8.46) would be slightly di�erent, although representing exactly the same system. In particular, for the same state vector ξc , the system (8.46) would then have a partitioned upper triangular system matrix instead, whose only e non-zero o�-diagonal submatrix would not then be the current submatrix BK .
8.5 Implementation of the MCS in practice 8.5.1 Introduction This section stands in isolation from the rest of the chapter. It succinctly describes how the MCS was implemented in practice. The implementation di�ers a little from the expressions in the rest of the chapter, but nevertheless it yields exactly the same results. The di�erences are due to the fact that the implementation was carried out so as to save computation time. The objective was to perform the minimum number of calculations. Some variables used within this section are valid exclusively within the section. The MCS was implemented in LabVIEWr for Microsoft Windows. The trapezoidal method, see Appendix D, was used to derive stable discrete-time approximations from the originally stable continuous-time control and navigation systems. Other approximation methods could have been used instead. The MCS ran synchronously. At every sampling instant the HGSO used the most recent navigation data to perform its tasks, and the thrust allocation block updated the control signals to the thruster servos through Zero-Order Hold (ZOH) circuits. A data bu�er stored the most recently made available navigation data. The navigation sensors and a hydroacoustic positioning system fed data into the data bu�er asynchronously. The sensors having update rates higher than the sampling period renewed the corresponding portion of the data several times per sampling period. The sensors having update rates lower than the sampling period and the hydroacoustic positioning system forced the corresponding portion of the data to be reused multiple times. The updates of the control signals to the thruster servos were computed in between two consecutive sampling instants.
8.5.2 Controller The control vectors u(·) and v(·) � discrete-time counterparts of those in (8.5) and Subsection 8.3.3, respectively � were implemented as
v(k) = upid (k − 1) + uff (k) 112
(8.55)
8.5. Implementation of the MCS in practice and
u(k) = ulin (k) + v(k)
(8.56)
where k ∈ N \ {0}. The vector upid (·) is taken one sampling period delayed to preclude the algebraic loop between the MIMO PID controller and the HGSO, as they feed each other, see Figure 6.1. The terms of (8.55)�(8.56) � discrete-time counterparts of those in (8.10), (8.12), and (8.13), respectively � were implemented as
b ν (k)) ν d ulin (k) = C(ˆ ˆ(k) + D ν (k)|ˆ ν (k) − τhs Q |ˆ
(8.57)
upid (k) = KP e0η (k) + KI e0I (k) + KD eν (k)
(8.58)
and
d c ˙ R (k) uff (k) = D L νR (k) + M ν
(8.59)
where ν ˆ(·) is the velocity vector estimated by the HGSO, and νR (·) and ν˙ R (·) are reference vectors generated by the guidance system, which is not treated in Part III of the thesis. The error vectors e0η (·), e0I (·), and eν (·) were implemented as
ˆ − 1)) (ηR (k) − η e0η (k) = J T(ψ(k ˆ(k))
(8.60)
e0I (k) = e0I (k − 1) + (h/2) (e0η (k) + e0η (k − 1))
(8.61)
and
eν (k) = νR (k) − ν ˆ(k)
(8.62)
where η ˆ(·) is the position and heading angle vector estimated by the HGSO, such ˆ that ψ(·) = (ˆ η (·))4 is the estimated heading angle used everywhere in the MCS in order to keep all reference frame transformations synchronised, ηR (·) is another reference vector generated by the guidance system, and h ∈ R>0 [s] is the sampling ˆ period. The transformation matrix J (ψ(·)) ∈ SO(4) is the discrete-time counterpart of that de�ned in Section 7.3. Finally, the thrust allocation block straightforwardly converts the vector u(k) into µ(k) = [ µ1 (k), µ2 (k), . . . , µp−1 (k), µp (k) ]T through (8.6)�(8.9). Proper initialisation of the vectors is an important precaution in order to preclude unpredictable initial behaviour. The vectors were initialised as:
• e0η (0) = e0I (0) = upid (0) = v(0) = 04 ; • ηR (1) = η ˆ(1) and νR (1) = ν˙ R (1) = 04 � ROV in DP at ONED , i.e. the origin of the NED frame, see Subsection 7.2.1. The initialisation of ν ˆ(·) and η ˆ(·) is discussed within Subsection 8.5.3. 113
8. Motion control system
8.5.3 High-gain state observer The vector of estimated states x ˆ(·) = [ η ˆT(·), ν ˆT(·) ]T � discrete-time counterpart of that de�ned in Subsection 8.3.3 � was implemented as " # " # η ˆ(k) η ˆ(k − 1) ˆ − 1)) ˆ − 1)) (v(k) + v(k − 1)) = Φ(ψ(k + ΓV (ψ(k ν ˆ(k) ν ˆ(k − 1) (8.63) " # " #! η ¯m (k) η ¯m (k − 1) ˆ − 1)) + ΓY (ψ(k + νm (k) νm (k − 1) where v(·) is de�ned in (8.55), νm (·) ∈ R4 is the vector of measured velocities, and η ¯m (·) ∈ R4 is the vector of measured position and accumulated heading angle. The vector η ¯m (·) is derived partially directly from the vector of measured position and heading angle ηm (·) ∈ R4 and partially through Algorithm 2, which enables the MCS to keep track of the number of consecutive turns of the ROVs. Algorithm 2 and η ¯m (·) are further described soon. The vector νm (·) = 04 ∀ k ∈ N ⇔ γ = 0, i.e. in case the velocities are not measured. Notice that ηm (·), η ¯m (·), and νm (·) are manipulated, i.e. read and written, by the HGSO, whereas the data bu�er deˆ scribed in Subsection 8.5.1 is only read by the HGSO. The system matrix Φ(ψ(·)) 8×8 8×4 ˆ ∈ R , the control input matrix ΓV (ψ(·)) ∈ R , and the output injection matˆ rix ΓY (ψ(·)) ∈ R8×8 are given by
ˆ − 1)) = ∆(ψ(k ˆ − 1)) (I8 + Λ(ψ(k ˆ − 1))) Φ(ψ(k
(8.64)
ˆ − 1)) = ∆(ψ(k ˆ − 1)) (h/2) Be ΓV (ψ(k
(8.65)
and
ˆ − 1)) = ∆(ψ(k ˆ − 1)) T (ψ(k ˆ − 1)) (h/2) L T T(ψ(k ˆ − 1)) ΓY (ψ(k
(8.66)
ˆ ˆ where the matrix Be is that in (8.32), T (ψ(·)) = blockdiag(J (ψ(·)), I4 ) ∈ SO(8), ˆ , Λ(ψ(·)) ˆ and the matrices ∆(ψ(·)) ∈ R8×8 are given by ˆ − 1)) = (I8 − Λ(ψ(k ˆ − 1)))−1 ∆(ψ(k
(8.67)
and
ˆ − 1)) = T (ψ(k ˆ − 1)) (h/2) (Ae − L) T T(ψ(k ˆ − 1)) Λ(ψ(k
(8.68)
where the matrices Ae and L are those in (8.32) and (8.33), respectively. ˆ − 1) is taken one sampling period delayed to preclude an alNotice that ψ(k gebraic loop in the HGSO. The heading angle measurement ψm (·) = (ηm (·))4 is typically commercially available in the ranges: 114
8.6. Results from full-scale sea trials • range 1: ψm (·) ∈ [0, 2 π) [rad]; • range 2: ψm (·) ∈ (−π, π] [rad]. In either case the range is discontinuous and limited, so that the heading angle is not automatically accumulated along consecutive turns. Algorithm 2 was used to overcome this condition, where counter(·) ∈ Z is a variable initialised as counter(0) = counter(1) = 0, and the variable range ∈ N | range ∈ {1, 2}.
Algorithm 2: Heading angle accumulation
1 if range = 2 ∧ ψm (k) < 0 then 2 ψm (k) ← ψm (k) + 2 π 3 end 4 if range = 2 ∧ ψm (k − 1) < 0 then 5 ψm (k − 1) ← ψm (k − 1) + 2 π 6 end 7 if |ψm (k) − ψm (k − 1)| > π then 8 if ψm (k − 1) > ψm (k) then 9 counter(k) ← counter(k − 1) + 1 10 else 11 counter(k) ← counter(k − 1) − 1 12 end 13 end 14 ψacc (k) ← ψm (k) + 2 π counter(k)
The �rst three elements of ηm (·) are directly copied into η ¯m (·), such that (¯ ηm (·))i = (ηm (·))i , i ∈ {1, 2, 3}, and the accumulated heading angle ψacc (·) that comes out from Algorithm 2 completes η ¯m (·), such that (¯ ηm (·))4 = ψacc (·). Proper initialisation of the vectors is an important precaution in order to preclude, or at least drastically attenuate, the initial peaks of the estimated state vector x ˆ(·). The vectors were initialised as η ˆ(0) = η ˆ(1) = η ¯m (0) = η ¯m (1) and ν ˆ(0) = ν ˆ(1) = νm (0) = νm (1) = 04 � ROV immobilised at ONED . Hence, the initial estimation errors were zeroed.
8.6 Results from full-scale sea trials This section presents selected results from full-scale sea trials in which the ROV Minerva was operated in Trondheimsfjorden, Norway, in October 2013 and April 2014. Trajectory tracking and dynamic positioning tests were carried out. The guidance system was not based on the reference generation scheme proposed in Part II. Information regarding the test setup and the ROV Minerva can be found 115
8. Motion control system in Appendix C. The MCS ran at the constant sampling frequency of 6.¯ 6 Hz � sampling period of 150 ms. The implementation of the MCS is described in Section 8.5. See also Dukan (2014) and Sørensen et al. (2012) for further details on the implementation concerning the whole versatile control system that is carried out at NTNU under the collaborative e�ort of the research team headed up by Prof. Asgeir J. Sørensen, which served as the basis for the implementation of the herein proposed MCS.
8.6.1 Trajectory tracking test with velocity measurements Figures 8.4�8.9 depict results from a test in which the spatial reference trajectory consisted of the so-called lawn mower pattern describing a planar path in the horizontal plane elevated a constant height from the sea bottom, i.e. it replicated the sea bottom pro�le. The lawn mower pattern was comprised of three 20 m-long parallel legs separated 2 m from each other, see Figure 8.4. All measurements were reasonably well �ltered by the HGSO, thereby yielding the acceptable tracking performance seen in Figures 8.4�8.8 and the smooth control action seen in Figure 8.9. Table 8.1 summarises the information contained in Figures 8.4�8.6. The table shows position error norms and absolute heading angle errors calculated with respect to the corresponding references. The largest errors occurred during the turns, i.e. heading angle changes, due to the relatively high maximum angular velocity reference used. Figure 8.9 shows that the starboard and port thrusters nearly reached their saturation limits during the turns. A jump in the horizontal position measurement occurred during the last turn around 196.6 s. Notice the consistently better tracking performance attained along the �rst and third legs than that achieved along the second leg. The trajectory tracking errors remained close to the stated mean values during the motion along the �rst and third legs, whereas a pronounced error occurred during the motion along the second leg. A simultaneous sway velocity deviation can be seen in Figure 8.7. Such tracking error was most probably caused by tuning issues regarding both the controller and the observer. Firstly, the output injection matrix L in (8.33) overdamped the Table 8.1: Information summary concerning Figures 8.4�8.6 Estimation
116
Measurement
Max. error
Mean error
Max. error
Mean error
Position
49.3 cm (@ 186.3 s)
15.9 cm �
1.168 m (@ 196.6 s)
37.6 cm �
Heading angle
9.49◦ (@ 93.9 s)
1.74◦ �
12.85◦ (@ 181.6 s)
2.41◦ �
8.6. Results from full-scale sea trials
Reference Measured Estimated
0
n [m]
−5 −10 −15 −20
−10
−8
−6
e [m]
−4
−2
0
ψ [◦ ]
d [m]
e [m]
n [m]
Figure 8.4: Trajectory tracking test: top view of the NE-plane.
0 −5 −10 −15 0 −4 −8 71 70 69 0 −50 −100 −150 0
Reference Measured Estimated 200
50
100
150
250
50
100
150
200
250
50
100
150
200
250
50
100
150 Time [s]
200
250
Figure 8.5: Trajectory tracking test: position and heading angle (NED frame).
estimation, which relied more on the response predicted based on the CPM than on the incoming measurements. Secondly, the combination of the small tracking 117
|ψerr |[◦ ] |derr |[m] |eerr |[m] |nerr |[m]
8. Motion control system 0.8 0.4 0 0.8 0.4 0 0.14 0.07 0 10 5 0 0
Measured Estimated 50
100
150 Time [s]
200
250
r [◦/s]
w [m/s] v [m/s] u [m/s]
Figure 8.6: Trajectory tracking test: absolute position and heading angle errors (NED frame).
0.4 0.2 0 0.1 0 −0.1 0.1 0 −0.1 10 0 −10 0
50
100
150
200
250
50
100
150
200
50
100
150
200
250
50
100
150 Time [s]
200
250
Reference Measured 250 Estimated
Figure 8.7: Trajectory tracking test: velocities (BF frame).
errors, calculated based on the overdamped state estimation, and the quite inappropriate controller gains precluded the possibility of achieving better tracking 118
|rerr |[◦/s] |werr |[m/s]|verr |[m/s]|uerr |[m/s]
8.6. Results from full-scale sea trials 0.2 0.1 0 0.1 0.05 0 0.1 0.05 0 6 4 2 0 0
Measured Estimated 50
100
150 Time [s]
200
250
VT[rpm] LT[rpm] PT[rpm] ST[rpm]
Figure 8.8: Trajectory tracking test: absolute velocity errors (BF frame).
500 0 −500 −1000 1000 0 −1000 1000 500 0 −500 1000 500 0 0
Starboard thruster 50 Port thruster 50 Lateral thruster
50 Vertical thrusters 50
100
150
200
250
100
150
200
250
100
150
200
250
100
150 Time [s]
200
250
Figure 8.9: Trajectory tracking test: commanded propeller rotations (Legend: L = Lateral, P = Port, S = Starboard, T = Thruster, and V = Vertical).
performance. Other factors, e.g construction asymmetries of Minerva, modelling simpli�cations, plant parameter variations, and disturbances due to the sea cur119
8. Motion control system rent and the umbilical cable, also played important roles in the overall trajectory tracking performance. The tuning parameters of the controller were KP = diag(208.0, 209.5, 298.2, 33.0) KI = diag(10.0, 10.0, 16.7, 1.7) KD = diag(528.8, 533.8, 647.0, 79.6) (8.69) (WC )i,j = (WL )i,j = (WM )i,j = (WQ )i,j = 1 Wp = I5 where i, j ∈ {1, 2, 3, 4} and I5 ∈ R5×5 is an identity matrix, whereas the tuning parameters of the HGSO were c −1 L11 = diag(2, 2, 2, 2) M c −1 L12 = diag(20, 20, 20, 20) M c −1 (8.70) L21 = diag(4, 4, 4, 4) M c −1 L22 = diag(40, 40, 40, 40) M � = 0.001 and γ = 1 The gains in (8.69)�(8.70) were determined in an early stage of the development of the MCS. It is worthwhile to realise that they are fundamentally di�erent from those in (4.48)�(4.49) and (8.75)�(8.76), which were determined much later, therefore, more consciously. The gains in (4.48)�(4.49) and (8.75)�(8.76) concern numerical simulations whose results are shown in Chapter 4 and Section 8.7, respectively. These di�erences laid the foundations of the discussion on proper tuning carried out in Subsection 8.2.4 and Subsection 8.3.5, which respectively culminated in (8.28), when it comes to the MIMO PID controller, and (8.44)�(8.45), when it comes to the HGSO. Other results, which were not included in the thesis, corroborated the de�nition of (8.28), as well as the de�nition of (8.44)�(8.45).
8.6.2 Dynamic positioning test with velocity measurements Figures 8.10�8.14 depict results from a DP test in which the ROV was desired to keep station at a depth of 70 m. Acceptable state regulation can be seen in Figures 8.10�8.13 and reasonably smooth control action can be seen in Figure 8.14. Table 8.2 summarises the information contained in Figures 8.10�8.11. The errors seen in Table 8.2 are larger than those seen in Table 8.1 only because of the jump in the horizontal position measurement that occurred around 319 s. Another jump occurred earlier, around 130 s. The errors remained close to the stated mean values 120
ψ [◦ ]
d [m]
e [m]
n [m]
8.6. Results from full-scale sea trials 0.6 0.2 −0.2 0 −0.5 −1 70.05
50
100
150
200
250
300
350
300
350
50
100
150
Reference Measured 200 Estimated 250
50
100
150
200
250
300
350
50
100
150 200 Time [s]
250
300
350
70 92 90 88 0
|ψerr |[◦ ] |derr |[m] |eerr |[m] |nerr |[m]
Figure 8.10: Dynamic positioning test: position and heading angle (NED frame).
0.6 0.4 0.2 0 1 0.5
Measured Estimated
0 0.05 0 3 2 1 0 0
50
100
150
200 Time [s]
250
300
350
Figure 8.11: Dynamic positioning test: absolute position and heading angle errors (NED frame). except when measurement jumps occurred. Notice that there is no detectable increase in the position tracking error along the N-axis, despite the non-zero mean 121
w [m/s] v [m/s] u [m/s]
0.1 0.05 0 −0.05
r [◦/s]
8. Motion control system
2 0 −2
Reference
0.1 0 0.02 0 −0.02
0
50
100
150
200 Measured 250 Estimated
300
350
50
100
150
200
250
300
350
50
100
150
200
250
300
350
50
100
150 200 Time [s]
250
300
350
|rerr |[◦/s] |werr |[m/s]|verr |[m/s]|uerr |[m/s]
Figure 8.12: Dynamic positioning test: velocities (BF frame).
0.1 0.05
Measured Estimated
0 0.1 0 0.03 0.02 0.01 0 3 2 1 0 0
50
100
150
200 Time [s]
250
300
350
Figure 8.13: Dynamic positioning test: absolute velocity errors (BF frame).
sway velocity indicated in Figure 8.12. In particular, it is easy to realise that the small mean sway velocity would have resulted in a mean lateral force through the 122
8.6. Results from full-scale sea trials Table 8.2: Information summary concerning Figures 8.10�8.11
VT[rpm] LT[rpm] PT[rpm] ST[rpm]
Estimation
Measurement
Max. error
Mean error
Max. error
Mean error
Position
60.2 cm (@ 319.2 s)
9.6 cm �
1.368 m (@ 318.2 s)
14.8 cm �
Heading angle
3.88◦ (@ 319.8 s)
0.86◦ �
3.83◦ (@ 319.6 s)
0.88◦ �
0 −400 −800 500 0 −500 800 400 0 650 600 550 0
Starboard thruster
50
100
150
200
250
300
350
Port thruster 50 100
150
200
250
300
350
Lateral thruster 50 100 150
200
250
300
350
300
350
50
100
Vertical thrusters 150 200 250 Time [s]
Figure 8.14: Dynamic positioning test: commanded propeller rotations (Legend: L = Lateral, P = Port, S = Starboard, T = Thruster, and V = Vertical).
derivative gain of the MIMO PID controller, and also that such force would have caused the ROV to drift sideways. Nevertheless, such (constant) disturbing force was successfully counteracted by the integral term of the MIMO PID controller, as expected. This con�ict led to some undesirable and unnecessary extra propeller work, as it can be seen in Figure 8.14, which explains the existence of the unsteady lateral motion of Minerva, which is manifested through the (high-variance) sway velocity in consonance with the unsteady (zero-mean) displacement around the origin of the N-axis seen in Figures 8.10�8.11. Notice that, in particular, the lateral thruster, see Figure C.2 in Appendix C, worked relatively more than the two other horizontal thrusters. The most probable causes of such behaviour were the 123
8. Motion control system same as in the trajectory tracking test reported in Subsection 8.6.1, i.e. tuning problems. On the other hand, the HGSO captured more accurately the plant dynamics in this case, as already expected, since ν ≈ 04 during all the test. The tuning parameters of the controller were KP = diag(74.9, 74.5, 105.4, 11.9) KI = diag(2.2, 2.1, 3.5, 0.4) KD = diag(317.3, 318.4, 384.7, 47.7) (8.71) (WC )i,j = (WL )i,j = (WM )i,j = (WQ )i,j = 1 Wp = I5 where i, j ∈ {1, 2, 3, 4}, whereas the tuning parameters of the HGSO were c −1 L11 = diag(2, 2, 2, 2) M c −1 L12 = diag(20, 20, 20, 20) M c −1 (8.72) L21 = diag(3, 3, 3, 3) M c −1 L22 = diag(50, 50, 50, 50) M � = 0.002 and γ = 1 The gains in (8.71)�(8.72) were determined in an early stage of the development of the MCS. It is worthwhile to realise that they are fundamentally di�erent from those more consciously determined which are seen in (4.48)�(4.49) and (8.75)�(8.76). All comments on the fundamental di�erences found in the last paragraph of Subsection 8.6.1 apply likewise in this case.
8.6.3 Dynamic positioning test without velocity measurements Figures 8.15�8.19 depict results from a DP test in which the ROV was desired to change the heading angle 90◦ twice, while keeping the constant depth of 137.7 m. Velocity measurements were not used by the HGSO, in spite of being available for the sake of comparison. Stable and acceptable, although not entirely satisfactory, state regulation can be seen in Figures 8.15�8.18, whereas the control action can be seen in Figure 8.19. Table 8.3 summarises the information contained in Figures 8.15�8.16. The position measurements were reasonably well �ltered, even without the support of the velocity measurements. The depth and heading were kept closer to the references because of their inherently more favourable measurement characteristics, i.e. high update rates and less measurement variance. Figures 8.17�8.18 show fairly good velocity reconstruction, in particular, regarding heave and yaw, thereby corroborating the claim that better results can be attained under more 124
n [m]
0.8 0.4 0
e [m]
1 0.5 0
d [m]
8.6. Results from full-scale sea trials
137.8 137.7 137.6
ψ [◦ ]
80 40 0 0
Reference Measured Estimated 50
100
150 Time [s]
200
250
|ψerr |[◦ ] |derr |[m] |eerr |[m] |nerr |[m]
Figure 8.15: Dynamic positioning test: position and heading angle (NED frame).
0.6 0.4 0.2 0 0.8 0.4 0 0.1 0 8 4 0 0
Measured Estimated 50
100
150 Time [s]
200
250
Figure 8.16: Dynamic positioning test: absolute position and heading angle errors (NED frame).
suitable measurements. Notice that part of the delay observed between the reconstructed and the measured velocities was due to the di�erences in the nature of 125
0.3 0.15 0 −0.15 0.2 0 −0.2 0.05 0 −0.05 10 0 −10 0
r [◦/s]
w [m/s] v [m/s] u [m/s]
8. Motion control system
Reference Measured Estimated 50
100
150 Time [s]
200
250
|rerr |[◦/s] |werr |[m/s]|verr |[m/s]|uerr |[m/s]
Figure 8.17: Dynamic positioning test: velocities (BF frame).
0.3 0.2 0.1 0 0.2 0.1 0 0.08 0.04 0 8 4 0 0
Measured Estimated 50
100
150 Time [s]
200
250
Figure 8.18: Dynamic positioning test: absolute velocity errors (BF frame).
the measurements, because the reconstruction was based on the position measurements made by a hydroacoustic positioning system, whereas the velocities were 126
8.6. Results from full-scale sea trials directly measured by a DVL. Undesirable and unnecessary extra propeller work can be seen in Figure 8.19, which explains the unsteady motion of Minerva while in DP, which is manifested through the (high-variance) velocities in consonance with the unsteady (zero-mean) displacement around ONED , i.e. the origin of the NED frame, seen in Figure 8.15. The most probable causes of such behaviour were the same as in the trajectory tracking test reported in Subsection 8.6.1, i.e. tuning problems. Table 8.3: Information summary concerning Figures 8.15�8.16
VT[rpm] LT[rpm] PT[rpm] ST[rpm]
Estimation
Measurement
Max. error
Mean error
Max. error
Mean error
Position
52.9 cm (@ 74.4 s)
18.2 cm �
1.073 m (@ 101.4 s)
46.6 cm �
Heading angle
8.02◦ (@ 58.7 s)
0.03◦ �
11.68◦ (@ 64.3 s)
0.04◦ �
500 0 −500 −1000 500 Port thruster 0 −500 −1000 1000 0 −1000 800 600 0
50
Starboard thruster
Lateral thruster Vertical thrusters
100
150 Time [s]
200
250
Figure 8.19: Dynamic positioning test: commanded propeller rotations (Legend: L = Lateral, P = Port, S = Starboard, T = Thruster, and V = Vertical).
The tuning parameters of the controller were
127
8. Motion control system KP = diag(330, 330, 340, 200) KI = diag(20, 20, 20, 20) KD = diag(670, 670, 690, 240) (WC )i,j = (WL )i,j = (WM )i,j = (WQ )i,j = 1 Wp = I5
(8.73)
where i, j ∈ {1, 2, 3, 4}, whereas the tuning parameters of the HGSO were c −1 L11 = diag(2, 2, 2, 2) M c −1 L12 = diag(0, 0, 0, 0) M c −1 (8.74) L21 = diag(2, 2, 2, 2) M c −1 L22 = diag(0, 0, 0, 0) M � = 0.1 and γ = 0 The gains in (8.73)�(8.74) were determined in an even earlier stage of the development of the MCS than that when (8.69)�(8.70) and (8.71)�(8.72) were determined. It is worthwhile to realise that the gains in (8.73)�(8.74) are fundamentally di�erent from those more consciously determined which are seen in (4.48)�(4.49) and (8.75)�(8.76). All comments on the fundamental di�erences found in the last paragraph of Subsection 8.6.1 apply likewise in this case.
8.7 Simpli�ed benchmark against the EKF 8.7.1 Introduction This section is concerned with a simpli�ed benchmark against the EKF. Simulation results based on the ROV Minerva, see Appendix C for details, were used to benchmark the HGSO against the EKF. Two batches of 10000 simulations each were run and the results collected and summarised in Figures 8.20�8.23 and Tables 8.4�8.5 for the sake of comparison. One batch is concerned with the MCS described in this chapter. The other batch is concerned with a variation of that MCS, whose control system was the same that is described in Section 8.2, whereas the navigation system was built upon the EKF without any bias estimator. The tuning of the control system was kept the same for both MCSs. The implementation of the EKF is reported in Subsection 8.7.2. Further information on the KF, as well as on its variants, such as the EKF, can be found in e.g. Sørensen (2013), Fossen (2011), Kinsey et al. (2006), Kirk (2004), Athans (1999), Friedland (1999), Brown and Hwang (1997), Friedland (1986), Gelb et al. (1974), Kalman and Bucy 128
8.7. Simpli�ed benchmark against the EKF (1961), and Kalman (1960). The MCSs ran at the constant sampling frequency of 6.¯ 6 Hz � sampling period of 150 ms. In all simulations, the ROV Minerva started being run in DP at the initial point (0, 0, 300) [m] in the NED frame, traversed a 52 m-long straight line path towards the �nal point (48, 12, 316) [m] in the NED frame, while also changing the heading angle from 0◦ to 90◦ , and lastly remained in DP at (48, 12, 316) [m]. The transects were taken at relatively high speed, given Minerva's ratings, in order to arouse the couplings among all DoFs to challenge the MCSs, which also had to cope with the constant horizontal sea current whose characteristics were Vc = 0.25 m/s, αh = −135◦ , and αv = 0◦ , see Subsection 7.2.3 for details, apart from random plant parameter variations limited to ±50 % of the nominal values of the CPM. The guidance system was the same for both MCSs. It was built upon the reference generation scheme proposed in Chapter 4. The basic version of the RM that is described in Section 3.3 was used. The tuning parameters of the RM were L = 52 m, Vd = 0.3 m/s, Ta = Td = 20 s, �L = 0.05, θa = 0.8, θd = 0.2, and θ0 = exp(−10), see Table 3.1 for details on them. With regard to the reference generation, notice that the reference heading angle was computed as ψR (t) := (π/2−0) $p (t), where $p (t) is the strictly monotonically increasing parameter that parameterised the straight line path, see Section 4.2 and Section 4.5 for details. The tuning parameters of the controller were KP = diag(52.6, 83.8, 53.3, 69.2) KI = diag(5, 10, 5, 20) KD = diag(420.3, 533.8, 432.5, 182.0) (8.75) (WC )i,j = (WL )i,j = (WM )i,j = (WQ )i,j = 1 Wp = I5 where i, j ∈ {1, 2, 3, 4}, whereas the tuning parameters of the HGSO were c −1 L11 = diag(0.1, 0.1, 10, 10) M c −1 L12 = diag(5, 5, 5, 5) M c −1 (8.76) L21 = diag(0.03, 0.03, 3, 3) M c −1 L22 = diag(100, 100, 100, 100) M � = 0.0005 and γ = 1 and the tuning parameters of the EKF were ( Q K = I8
RK = diag(10, 30, 5, 1, 0.1, 0.3, 2.5, 0.01)
(8.77) 129
8. Motion control system
8.7.2 Extended Kalman �lter implementation The discrete-time corrector was implemented through (8.78)�(8.81) as follows T T KK (k) = PK (k − 1) CK (CK PK (k − 1) CK + RK )−1
(8.78)
T T x ˆK (k) = xK (k − 1) + KK (k) ([ η ¯m (k), νm (k) ]T − CK xK (k − 1))
(8.79)
and PˆK (k) = (I8 − KK (k) CK ) PK (k − 1) (I8 − KK (k) CK )T
(8.80)
T + KK (k) RK KK (k)
(8.81)
T PˆK (k) = (PˆK (k) + PˆK (k))/2
where KK (·) ∈ R8×8 is the gain matrix that minimises the mean-square estimation error, PK (·) ∈ R8×8 is the error covariance matrix, CK = I8 is an output T matrix, RK ∈ R8×8 | RK = RK > 0 is a noise covariance matrix associated with the measurements, and x ˆK (·) ∈ R8 builds upon both the estimated state vector xK (·) ∈ R8 and the vector of measured position and velocities and accumulated T T (·) ]T . See Section 8.5 for details on η ¯m (·), νm (·), and (·), νm heading angle [ η ¯m all other variables which are of interest when it comes to the implementation of the EKF. Equation (8.80) is valid under any KK (·), either optimal or suboptimal. The matrix PˆK (·) ∈ R8×8 is guaranteed to be symmetric through (8.81). The discrete-time predictor was implemented through (8.82)�(8.85) as follows " #! " # 04×4 J ((ˆ xK (k))4 ) 04×4 xK (k) = I8 + h x ˆK (k) + h v(k) (8.82) c −1 D d c −1 04×4 −M M L where J ((ˆ xK (k))4 ) ∈ SO(4) is given by " cos((ˆ xK (k))4 ) J ((ˆ xK (k))4 ) = blockdiag sin((ˆ xK (k))4 )
− sin((ˆ xK (k))4 ) cos((ˆ xK (k))4 )
#" ,
1
0
0
1
#! (8.83)
Recall that (%)i , i, n ∈ N \ {0} | i 6 n, denotes the i-th element of the vector % ∈ Rn , and notice the resemblance the matrices in (8.82) bear to those in (8.2). (8.84)
PK (k) = ΦK (k) PˆK (k) ΦTK (k) + h2 QK
where QK ∈ R8×8 | QK = QTK > 0 is a noise covariance matrix associated with the states, and the Jacobian matrix ΦK (k) ∈ R8×8 evaluated at the point x ˆK (k) is given by " " #! # 04×4 J ((ˆ xK (k))4 ) d ΦK (k) = I8 + h x ˆK (k) (8.85) −1 dˆ xK (k) c D d 04×4 −M L x ˆK (k)=ˆ xK (k)
130
8.7. Simpli�ed benchmark against the EKF Proper initialisation of PK (·) and xK (·) is an important precautionary measure to be taken, as already mentioned in Section 8.5. Therefore, PK (0) := 08×8 , T T where 08×8 ∈ R8×8 is a null matrix, and xK (0) := [ η ¯m (1), νm (1) ]T .
8.7.3 Simulation results Figures 8.20�8.21 concern the maximum absolute position and heading angle errors under the HGSO and EKF, respectively. Table 8.4 summarises the information contained in both �gures. The position errors were computed through � �p (8.86) Max.abs.pos.error := max (nR − n)2 + (eR − e)2 + (dR − d)2 Tsim
where Tsim ⊂ R | Tsim := {tsim ∈ R>0 | tsim ∈ [0, TSIM ]} is the �xed simulation interval used to carry out each of the 20000 simulations, where TSIM ∈ R>0 [s] is the �nal simulation time, whereas the heading angle errors were computed through (8.87)
max(|ψerr |) := max(|ψR − ψ|) Tsim
Notice that the actual position and heading angle were used in the computations above, instead of the estimated values, since they are available in the MATLABr -based simulator. Table 8.4: Information summary concerning Figures 8.20�8.21 HGSO
EKF
Position
Min. value Max. value Mean value (SD1 ) RMS value
53.01 cm 79.79 cm 63.34 cm (3.65 cm) 63.45 cm
51.08 cm 78.20 cm 62.23 cm (3.74 cm) 62.34 cm
Heading angle
Min. value Max. value Mean value (SD) RMS value
0.8623◦ 8.2367◦ 2.9342◦ (1.1202◦ ) 3.1408◦
0.8918◦ 10.6816◦ 3.1476◦ (1.2337◦ ) 3.3807◦
The data sets plotted in Figures 8.20�8.21 agree to a large extent, and Table 8.4 corroborates this claim. The main cause of the large position tracking errors, which occurred in both simulation batches, is the typically low update rate of the hydroacoustic positioning system, see Appendix C for details. The depth measurement updates are faster and more precise, thus yielding closer depth reference tracking. This is also the case, when it comes to the heading angle measurements. 1
Standard Deviation (SD), assuming a normal, or Gaussian, distribution, see Appendix D.
131
max(|ψerr |) [◦ ]
Max.abs.pos. error [m]
8. Motion control system
0.75 0.7 0.65 0.6 0.55 8
Mean value RMS value
6 4 2 1
2k
4k 6k Simulation number
8k
10k
max(|ψerr |) [◦ ]
Max.abs.pos. error [m]
Figure 8.20: Maximum absolute position and heading angle errors (NED frame) under the HGSO.
0.75 0.7 0.65 0.6 0.55 10 8 6 4 2 1
Mean value RMS value
2k
4k 6k Simulation number
8k
10k
Figure 8.21: Maximum absolute position and heading angle errors (NED frame) under the EKF.
132
8.7. Simpli�ed benchmark against the EKF Figures 8.22�8.23 concern the maximum absolute linear speed and yaw rate errors under the HGSO and EKF, respectively. Table 8.5 summarises the information contained in both �gures. The linear speed errors were computed through � �p (8.88) Max.abs.lin.speed.error := max (uR − u)2 + (vR − v)2 + (wR − w)2 Tsim
whereas the yaw rate errors were computed through
˙ max(|rerr |) := max(|rR − r|) ≡ max(|ψ˙ R − ψ|) Tsim
(8.89)
Tsim
Notice that the actual velocities were used in the computations above, instead of the estimated values, since they are available in the MATLABr -based simulator. Table 8.5: Information summary concerning Figures 8.22�8.23 HGSO
EKF
Linear speed
Min. value Max. value Mean value (SD) RMS value
3.32 cm/s 10.16 cm/s 5.27 cm/s (0.80 cm/s) 5.33 cm/s
2.62 cm/s 10.62 cm/s 4.70 cm/s (0.79 cm/s) 4.77 cm/s
Yaw rate
Min. value Max. value Mean value (SD) RMS value
0.6450◦/s 3.4590◦/s 1.2315◦/s (0.2540◦/s) 1.2575◦/s
0.6037◦/s 3.1627◦/s 1.1513◦/s (0.2671◦/s) 1.1819◦/s
The data sets plotted in Figures 8.22�8.23 agree to a large extent, and Table 8.5 corroborates this claim. The main cause of the large linear speed tracking errors, which occurred in both simulation batches, is the typically low update rate of the DVL, see Appendix C for details.
8.4. The experimental and simulation results reported in this chapter permit to ascertain that the HGSO is capable of performing satisfactorily when the tuning is carefully exercised. This is a satisfactory result for the study of how the HGSO compares with the benchmark EKF in the central role in the navigation system of an MCS for observation class ROVs, provided that both state observers yielded rather similar reference tracking performance. Contribution
133
Max.abs.lin. max(|rerr |) [◦/s] speed.error [m/s]
8. Motion control system 0.1 0.08 0.06 0.04 Mean value RMS value
3 2 1 1
2k
4k 6k Simulation number
8k
10k
Max.abs.lin. max(|rerr |) [◦/s] speed.error [m/s]
Figure 8.22: Maximum absolute linear speed and yaw rate errors (BF frame) under the HGSO.
0.1
Mean value RMS value
0.08 0.06 0.04 3 2 1 1
2k
4k 6k Simulation number
8k
10k
Figure 8.23: Maximum absolute linear speed and yaw rate errors (BF frame) under the EKF.
134
Chapter 9
Concluding remarks 9.1 Conclusions Part III of this thesis dealt with an MCS dedicated to control observation class ROVs. The MCS, with DP and trajectory tracking capabilities, consisted of a GES model-based MIMO output feedback control system comprised of a MIMO PID controller, two auxiliary control laws, and an HGSO, and fed by an open-loop guidance system. The MCS was described and analysed thoroughly in Part III. Conducted full-scale sea trials and numerical simulations, both based on the NTNU's ROV Minerva, showed that the MCS was able to perform stably and satisfactorily under the challenging operating conditions faced in practice, e.g. unmodelled plant dynamics, plant parameter variations, measurement errors and noise, and environmental disturbances. In particular, the experimental results encouraged the use of an HGSO as another alternative to the benchmark EKF in MCSs for observation class ROVs. Based on the analysis of simulation and experimental results, it is possible to conclude that improved motion control performance can be achieved under more favourable operating conditions, namely:
• Higher update rates when it comes to the horizontal position measurements. Clearly, higher sensor update rates yield better performance, as it can be veri�ed in the experimental results regarding the heave and yaw movements. This evidence is corroborated by simulation results. While the update rates of the hydroacoustic positioning systems are currently low, there may be solutions in the pipeline, e.g. obtaining faster and more accurate position measurements through the geometry of the umbilical cable, e.g. Hiranandani et al. (2009); • More accurately identi�ed CPM parameters. Accurately identi�ed model parameters doubtlessly have a high, positive impact on the performance of 135
9. Concluding remarks model-based MCSs. The experimental results were in�uenced by the lower accuracy of the identi�ed model parameters that occurs because the ROV Minerva serves di�erent purposes when it comes to the di�erent research requirements and needs of the researchers at NTNU. Moreover, further insight about how to �ne-tune the HGSO could have been gained through the availability of a more detailed and accurately identi�ed CPM;
• Proper thruster modelling and control. Poor thruster modelling and control is certainly an important hindrance to better motion control performance. While it is very di�cult to model underwater thrusters accurately in practice, it seems reasonable to expect enhanced performance if the thruster servos of the ROV Minerva were able to deliver commanded torques rather than the commanded propeller shaft angular velocities. Propeller torque control is surely a goal to be pursued and attained for better motion control performance.
9.2 Future works Future works must seek to extend the �ndings and results found in Part III of the thesis, as well as to provide solutions to the unsolved problems. It is most important to:
• Improve the tuning of both the MIMO PID controller and the HGSO based on more analytical and experimental results. In particular, suggest gain intervals based on di�erent models and operating conditions; • Find means of accounting for the e�ects of unmodelled plant dynamics, plant parameter variations, and environmental disturbances, e.g. include bias estimators, if viable, in order to avoid divergences in the HGSO; • Include the dynamics of the propulsion system in both the PPM and the CPM in order to properly take it into account when the MCS is synthesised, simulated, and pre-tuned; • Use more sophisticated thrust allocation algorithms in order to extend the thrust availability along any preferred DoF, or along a DoF that has higher priority momentarily; • Use the vector τc (ν, νc , ν˙ c ) in (7.35) in conjunction with more sophisticated and accurate propulsion system and CPM to estimate the sea current νcNED . Currently, it does not seem to be possible to attain an accurate estimation due to the model simpli�cations and limitations. Once such estimation is eventually available, it can possibly be well comparable to the relative sea current velocity measurement provided by e.g. a DVL.
136
Appendices
137
Appendix A
Reference model: MATLABr-based, ready-made code examples A.1 Basic version Script A.1 furnishes a ready-made implementation example of the basic version of the RM introduced in Section 3.3. Script A.1: Basic version of the reference model 1 2 3 4 5 6 7 8 9 10 11 12 13 14 15 16 17 18 19 20 21 22 23 24
%% ====================== TUNING PARAMETERS ====================== % 1ST CATEGORY L = 500; % Path length (straight line) [m] V_d = 5; % Desired cruise velocity [m/s] T_a = 35; % Desired minimum time to reach V_d [s] T_d = 25; % Desired minimum time to stop moving from V_d [s] % 2ND CATEGORY epsilon_L = 0.05; % Min. frac. of L to be trav. at max. (min.) vel. theta_a = 0.90; % Function switching threshold (0.6 0 [rad/s] is the undamped natural frequency, and t ∈ R>0 [s] is the time. The FBRM in (B.1) supplies the position reference x1 (t) along with its derivad d2 tives with respect to time, namely x2 (t) := dt [x1 (t)] and x3 (t) := dt 2 [x1 (t)]. In case only the position reference is of interest, for instance, the FBRM can be reduced to a SISO system represented by the following TF
F (s) =
ω3 X(s) = 3 2 R(s) s + (2 ζ + 1) ω s + (2 ζ + 1) ω 2 s + ω 3
(B.3)
where X(s) and R(s) are respectively the frequency-domain counterparts of the output x1 (t) and the input r(t). An LTI FBRM can be naturally extended to decoupled multiple DoFs, where every DoF can have a distinct damping ratio ζk and a distinct undamped natural frequency ωk , where k ∈ N | k ∈ {1, 2, . . . , n}, and n is the total number of DoFs. Towards this end, the matrices A = ASISO and B = BSISO in (B.2) become
0n×n
AMIMO := 0n×n 3
In
0n×n
0n×n
In
2
−Ω
−(2 Z + In ) Ω
(B.4)
−(2 Z + In ) Ω
and
0n×n
(B.5)
BMIMO := 0n×n Ω3
where AMIMO ∈ R3 n×3 n , BMIMO ∈ R3 n×n , and 0n×n , In ∈ Rn×n are the null and the identity matrices of order n, respectively, and
Ω := diag(ω1 , ω2 , . . . , ωn )
and
Z := diag(ζ1 , ζ2 , . . . , ζn )
(B.6)
The interested reader is referred to e.g. Sørensen (2013) and Fossen (2011) for a more detailed description of LTI FBRMs.
B.2.1 Stability analysis The system matrix A in (B.2) is guaranteed to be Hurwitz ∀ ζ ∈ R>0 | ζ 6 1 ∧ ∀ ω ∈ R>0 , as the following Routh-Hurwitz stability test array (Franklin et al., 150
B.3. Nonlinear time varying FBRM 2009; Bishop et al., 1999; Ogata, 1995; Friedland, 1986) indicates, provided that there are no sign changes in the �rst column
s3
1
(2 ζ + 1) ω 2
s2
(2 ζ + 1) ω
ω3
s1
4 ω 2 ζ (ζ + 1)/(2 ζ + 1)
0
s0
ω3
0
(B.7)
where the elements of the �rst two rows are straightforwardly extracted from the denominator of F (s) in (B.3), which is the characteristic polynomial of the companion matrix A. Notice that λi (A) = −ω , i ∈ {1, 2, 3}, in the critically damped case, i.e. ζ = 1, as the denominator of F (s) is then reduced to (s + ω)3 .
B.3 Nonlinear time varying FBRM The LTI FBRM presented in the previous section may not be appropriate for some applications, in spite of its highly attractive simplicity. Its most unwelcome characteristic is perhaps the fact that the maximum � or minimum, depending on the algebraic sign of r(t) � velocity reference, in the 3rd-order case, and the maximum � or minimum, depending on the algebraic sign of r(t) � acceleration reference, in both 2nd- and 3rd-order cases, are proportional to the amplitude of r(t). To modify such inherent response characteristic, some state variables can be de�ned on compact sets. This measure is simpler than gain-scheduling ωk and ζk according to the amplitude of r(t). The desired response is then achieved through the use of saturation functions to limit the state variables of interest. Other convenient nonlinearities can also be used to shape the references generated by the FBRM, e.g. nonlinear damping. An example of a single DoF, 3rd-order NTV FBRM is given by x˙ 1 (t) = sat(x2 (t)) x˙ 2 (t) = sat(x3 (t)) (B.8) x˙ 3 (t) = −(2 ζ + 1) ω sat(x3 (t)) − (2 ζ + 1) ω 2 sat(x2 (t)) −δ | sat(x2 (t))| sat(x2 (t)) − ω 3 x1 (t) + ω 3 r(t) where δ ∈ R>0 is a quadratic damping coe�cient. The roles of xi (t), i ∈ {1, 2, 3}, r(t), ζ , and ω remain the same as in the LTI case. Find the de�nitions in Section B.2. The saturation functions constrain the generalised velocity x2 (t) and the generalised acceleration x3 (t) to respectively belong to the compact sets Xi ⊂ R | Xi := {xi ∈ R | xi ∈ [xmin , xmax ]}, i ∈ {2, 3}. The superscripts `min ' and `max ' dei i note the limit points of the compact sets Xi . 151
B. Filter-based reference models The following state space representation is obtained by excluding the saturation functions from (B.8)
(
x(t) ˙ = (A − X(x2 (t))) x(t) + B r(t)
(B.9)
y(t) = x(t) where A, B , x(t), y(t), and r(t) remain the same as in Section B.2, and
0
0
0
X(x2 (t)) := 0 0
0
0
such that
kX(x2 (t))k = δ |x2 (t)|
(B.10)
δ |x2 (t)| 0
As with the LTI FBRM, the NTV FBRMs in (B.8)�(B.9) can be extended to decoupled multiple DoFs, where every DoF can have a distinct damping ratio ζk , a distinct quadratic damping coe�cient δk , and a distinct undamped natural frequency ωk , where k ∈ N | k ∈ {1, 2, . . . , n}, and n is the total number of DoFs. The interested reader is referred to e.g. Fossen (2011) for further details.
B.3.1 Stability analysis The stability of the origin x∗ = 03 � the only equilibrium point � of the unforced NTV subsystem x(t) ˙ = (A − X(x2 (t))) x(t) of (B.9) can be assessed by treating such subsystem as a perturbed linear system (Slotine and Li, 2005, p. 115). Notice initially that (A − X(x2 (t))) 6= 03×3 ∀ δ ∈ R>0 ∧ ∀ t ∈ R>0 , where the Hurwitz matrix A is as in (B.2), and also that the sparse and time-varying perturbing matrix X(x2 (t)) → 03×3 as t → ∞, driven by A, since x2 (t) → 0 as t → ∞. In addition,
∞ ∞ ∞ Z Z Z kX(x2 (t))k dt = δ |x2 (t)| dt ≡ δ sgn(x2 (t)) x2 (t) dt 0
0
0
(B.11)
∞
= δ |[sgn(x2 (t)) x1 (t)]0 | 6 δ (|x1 (∞)| + |x1 (0)|) < ∞ i.e. the integral exists and results �nite ∀ t ∈ R>0 . The linearity of the equation d [x1 (t)] is used to draw the inference that |x1 (∞)| < ∞ as x2 (∞) → 0. x2 (t) = dt See Appendix D for details about the integration performed in (B.11). Therefore, x∗ can be concluded to be GES, according to (Slotine and Li, 2005, p. 115). Based on this conclusion, the origin � the only equilibrium point � of the unforced system (B.8) can be likewise concluded to be GES. 152
B.3. Nonlinear time varying FBRM
B.3.2 Qualitative performance analysis While it is impossible to ascertain the stability of x∗ based on the knowledge of λi (A − X(x2 (t))), i ∈ {1, 2, 3}, it is at least possible to infer from such knowledge some qualitative information about the behaviour of (B.9). Furthermore, some qualitative information about the behaviour of (B.8) can also be obtained from such analysis, due to the existing similarities between (B.8) and (B.9). To start o� notice that IRe(λi (A−X(x2 (t)))) < 0 ∀ ζ ∈ R>0 | ζ 6 1 ∧ ∀ ω, δ ∈ R>0 ∧ ∀ x2 (t) ∈ R, as the following Routh-Hurwitz stability test array (Franklin et al., 2009; Bishop et al., 1999; Ogata, 1995; Friedland, 1986) indicates, provided that there are no sign changes in the �rst column
s3
1
(2 ζ + 1) ω 2 + δ |x2 (t)|
s2
(2 ζ + 1) ω
ω3
s1
4 ω 2 ζ (ζ + 1)/(2 ζ + 1) + δ |x2 (t)|
0
(B.12)
ω3 0 s0 where the elements of the �rst two rows are extracted from the characteristic polynomial det(s I3 − (A − X(x2 (t)))) of the matrix (A − X(x2 (t))). Then, by using the result of (B.12), in conjunction with the root locus method (Franklin et al., 2009; Yang et al., 1999; Ogata, 1995; Friedland, 1986; Åström and Wittenmark, 1997; Kailath, 1980), to study how λi (·), i ∈ {1, 2, 3}, change under the in�uence of δ |x2 (t)|, it can be veri�ed that λi (·) are split farther and farther apart as δ |x2 (t)| → ∞, so that λ1 (·) % 0, i.e. λ1 (·) tends to zero from the left, whereas λ2,3 (·) → −σ ± ∞, where σ ∈ R>0 | σ < ∞, as δ |x2 (t)| → ∞. Figure B.1 provides a numerical example to illustrate this point. In addition, Figures B.2�B.4 show examples of references generated by the FBRMs in (B.1), (B.8), and (B.9) for the purpose of comparison. Figure B.2 concerns the FBRM in (B.8), whereas Figures B.3�B.4 concern the FBRM in (B.9). The conclusions drawn from the qualitative analysis are the following: • The NTV FBRM in (B.8) is the best option among (B.1), (B.8), and (B.9), because of the steadier references it generates; • The higher δ , the slower the generalised position reference, and the higher the tendency of the generalised velocity and acceleration references to exhibit more pronounced initially oscillatory behaviour, in comparison with the references generated by the LTI FBRM in (B.1), in which case δ = 0. However, the amplitude of the oscillations decay exponentially fast, because A is Hurwitz. It is worthwhile to realise that the use of saturation functions as in (B.8) can help to attenuate the oscillations; • The use of saturation functions may slow down the generalised position reference as a consequence of the fact that the generalised velocity and acceleration references may reach the corresponding saturation limits. 153
B. Filter-based reference models
IIm(λi (A−X(x2 (t))))
30
λ1 (·) λ2 (·) λ3 (·) λ1,2,3 (·) when δ |x2 (t)| = 0 λ1,2,3 (·) when δ |x2 (t)| = 1000
20 10 0 −10 −20 −30 −1.5
−1 −0.5 IRe(λi (A−X(x2 (t))))
0
Figure B.1: Root locus for det(s I3 −(A−X(x2 (t)))) = 0 as a function of δ |x2 (t)| ∈ [0, 1000]. The constant matrix A is as in (B.2), where ζ = 1 and ω = 1 rad/s.
x1 (t)
15
Position
10
LTI NTV with sat. Input
5
x2 (t)
2 0 −2
Velocity
2 0 −2
Acceleration
x3 (t)
0
0
10
20
30 Time [s]
40
50
Figure B.2: References generated based on (B.1) (blue solid lines) and (B.8) (red dashed lines) for r(t) = 15 (H(t − 5) − H(t − 35)) (green dash-dot line), where H(·) is the unit step function, see Appendix D, ω = 1 rad/s, ζ = 1, δ = 0.5, and x3 (t) ∈ [−0.5, 0.5] and x2 (t) ∈ [−1, 1], when it comes to the FBRM in (B.8).
154
B.3. Nonlinear time varying FBRM
x1 (t)
15
Position
10
LTI NTV without sat. Input
5 0
Velocity
2 0 −2
Acceleration
x3 (t)
x2 (t)
2 0 −2
0
10
20
30 Time [s]
40
50
Figure B.3: References generated based on (B.1) (blue solid lines) and (B.9) (red dashed lines) for r(t) = 15 (H(t−5)−H(t−35)) (green dash-dot line), ω = 1 rad/s, and ζ = δ = 1.
x1 (t)
15
Position
10
LTI NTV without sat. Input
5 0
Velocity
2 0 −2
Acceleration
x3 (t)
x2 (t)
2 0 −2
0
10
20
30 Time [s]
40
50
Figure B.4: References generated based on (B.1) (blue solid lines) and (B.9) (red dashed lines) for r(t) = 15 (H(t−5)−H(t−35)) (green dash-dot line), ω = 1 rad/s, ζ = 1, and δ = 5.
155
Appendix C
NTNU's ROV Minerva
Figure C.1: ROV Minerva being deployed in Trondheimsfjorden, Norway.
Minerva is a SUB-�ghter 7500 ROV manufactured by Sperre AS in 2003. The NTNU's Research Vessel (R/V) Gunnerus is the support vessel used to operate Minerva. The ROV is powered from, and communicates with, R/V Gunnerus through a 600 m-long umbilical cable. Minerva has �ve thrusters with �xed pitch propellers. The starboard and port thrusters are oriented 10◦ towards the longi157
C. NTNU's ROV Minerva tudinal axis. The lateral thruster is the only that has one propeller at each end of its shaft, whereas the other four thrusters have a single propeller each. Figure C.2 shows her thruster installation con�guration. Table C.1 keeps on the speci�cations. Further information is available in Dukan (2014), Sørensen et al. (2012), and Dukan et al. (2011). Table C.1: Basic speci�cations of Minerva (four DoF CPM1 ) Dimensions (overall)
1.44 × 0.82 × 0.81 [m] (L×W×H)
Weight (air)
485 kg
Maximum payload
20 kg
Maximum depth
700 m
Thrusters (see Figure C.2)
Horizontally installed: 3 × 2 kW Vertically installed: 2 × 2 kW
Thrust capacity2 (minimum / maximum)
Surge: −220 / 480 [N] Sway: −195 / 195 [N] Heave: −180 / 390 [N] Yaw: −300 / 300 [Nm]
Maximum velocities
Surge: 1 m/s Sway: 0.6 m/s Heave: 0.6 m/s Yaw: 60◦/s
The nominal values of the parameters of the four DoF CPM of Minerva are
M = diag(485, 485, 485, 50) RB MA = diag(293, 302, 326, 57) DL = diag(29, 41, 64, 25) DQ = diag(292, 584, 635, 100) � �T τhs = 0 0 −100 0
(C.1)
see Chapter 7 for the de�nitions of these parameters. A high-precision hydroacoustic positioning system model HiPAP 500 by Kongsberg Maritime AS determines the north and east position coordinates of
The four DoFs of the CPM (see Section 7.3) are surge, sway, heave, and yaw. The minimum and maximum horizontal forces and moment � surge, sway, and yaw � cannot be all simultaneously delivered by the propulsion system, as they are produced through the cooperative work of all horizontal thrusters. The heave force is independently produced. 1 2
158
Figure C.2: Top view of Minerva's frame: thruster installation con�guration (Legend: L = Lateral, P = Port, S = Starboard, T = Thruster, and V = Vertical).
Minerva relative to R/V Gunnerus with accuracy better than 0.1 m at update rates 6 1 Hz. The depth, or down position coordinate, of Minerva is determined based on the measurements provided by the precision, temperature compensated, piezo-resistive underwater pressure sensor model miniIPS 0760001-100 by Valeport Ltd. It has full-scale span 100 bar, accuracy ±10 mbar, and resolution 1 mbar. Its maximum output update rate is 8 Hz. The heading angle and yaw rate are both determined through the use of a dedicated complementary �lter (Mahony et al., 2008, 2005) that treats the measurements provided by the Micro-ElectroMechanical System (MEMS)-based Inertial Measurement Unit (IMU) model MTi100 by Xsens Technologies B.V. The gyroscopes of the IMU have typical full-scale spans 450◦/s, maximum bias repeatability 0.2◦/s (1 year), and typical in-run bias stability 10◦/h. Its accelerometers have typical full-scale spans 50 m/s2 , maximum bias repeatability 30 mm/s2 (1 year), and typical in-run bias stability 40 µg. The maximum output update rate is 2 kHz with latency < 2 ms. The surge, sway, and heave velocities are simultaneously measured by a 1200 kHz Workhorse Navigator DVL by Teledyne RD Instruments, Inc. It has full-scale spans 10 m/s, long-term accuracy ±0.2 % ±1 mm/s, and resolution 1 mm/s. Its typical output update rate is 1 Hz. The MCS used to operate Minerva is implemented on a cRIO module model NI-9074, and programmed via LabVIEWr 2012 � SP1 for Microsoft Windows, both by National Instruments. Further details can be found in Dukan (2014), Sørensen et al. (2012), and Dukan et al. (2011). 159
Appendix D
Topics in mathematics revisited D.1 Useful functions D.1.1 Absolute value function or modulus function The absolute value function, also known as the modulus function, is de�ned as ( −φ(t), if φ(t) < 0 |φ(t)| := (D.1) φ(t), if φ(t) > 0 such that ψ(t) := |ϕ(t)| ∈ R>0 , where ϕ(t) ∈ R, and t ∈ R>0 [s] is the time. The relation |ϕ(t)| ≡ sgn(ϕ(t)) ϕ(t) ⇔ ϕ(t) ∈ R \ {0} (notice the domain set), where the signum function sgn(·) is de�ned ahead in (D.6), can be employed to replace the de�nition given in (D.1), when doing so is deemed convenient. For instance, the inde�nite integral of | · | can be derived as Z Z ˙ ˙ ˙ dt = sgn(ϑ(t)) ˙ |ϑ(t)| dt ≡ sgn(ϑ(t)) ϑ(t) ϑ(t) + C (D.2)
˙ := d [ϑ(t)] ∈ R \ {0} is an integrable function, and C ∈ R is an arbitrary where ϑ(t) dt constant of integration. The �nal result seen in (D.2) is obtained by integrating d ˙ ˙ ˙ the integrand sgn(ϑ(t)) ϑ(t) by parts, where dt [sgn(ϑ(t))] = 0.
D.1.2 Heaviside step function or unit step function The Heaviside step function, also known as the unit step function, is conveniently de�ned in this work as ( 0, if θ < 0 H(θ) := (D.3) 1, if θ > 0 161
D. Topics in mathematics revisited such that
( φ(t) H(t − τ ) :=
0, if
tτ
(D.4)
for some arbitrarily chosen function φ(t) ∈ C, where t ∈ R>0 [s] is the time, and for some arbitrarily chosen time instant τ ∈ R>0 [s]. Rigorously, H(·) is a discontinuous function which is equal to: i) zero, for negative values of its argument; and ii) one, for positive values of its argument. The convention adopted in (D.3), through which H(0) := 1, aims at guaranteeing the right-continuity of H(0), i.e. it ensures that H(0) is the characteristic function of the closed semi-in�nite interval [0, ∞). This convention is fundamental to represent a function that switches on exactly at t = τ [s], and then remains switched on henceforward, as it is desired to occur e.g. in (D.4). There are also other possibilities when it comes to de�ning H(0), namely either H(0) = 0, or H(0) = 0.5. Nonetheless, both possibilities are of less interest with regard to the matters dealt with in this thesis. Further information on H(·), including application examples, can be found in e.g. Chaparro (2011), Adams and Essex (2009), Kreyszig (2006), Råde and Westergren (2004), Egeland and Gravdahl (2002), Kamen (1999), Lathi (1999), Kailath (1980), and Abramowitz and Stegun (1972).
D.1.3 Saturation function The saturation function φmin , if φ(t), if sat(φ(t)) := φmax , if
is de�ned as
φ(t) 6 φmin φmin < φ(t) < φmax
(D.5)
φ(t) > φmax
such that the compact set C ⊂ R | C := {sat(φ(t)) ∈ R | sat(φ(t)) ∈ [φmin , φmax ]} holds, where φ(t) ∈ R, t ∈ R>0 [s] is the time, and φmax , φmin ∈ R are constants.
D.1.4 Signum function The signum function is de�ned as −1, φ(t) sgn(φ(t)) := = Undefined, |φ(t)| 1,
if
φ(t) < 0
if
φ(t) = 0
if
φ(t) > 0
(D.6)
such that ψ(t) := sgn(ϕ(t)) ∈ Z | ψ(t) ∈ {−1, 1}, where ϕ(t) ∈ R\{0}, and t ∈ R>0 [s] is the time. Another reason why sgn(0) is unde�ned is because zero is neither a positive nor a negative number. See e.g. Adams and Essex (2009) for details. 162
D.2. Statistics
D.2 Statistics D.2.1 Root-Mean-Square (RMS) value The RMS value, also known as the quadratic mean, of a discrete distribution containing n numbers, or values, xi ∈ R, i ∈ {1, . . . , n}, is de�ned as !1/2 n 1X 2 (D.7) xrms := x n i=1 i
D.2.2 Standard Deviation (SD) The SD of a set X which contains n samples xi ∈ R, i ∈ {1, . . . , n}, of a larger population is de�ned as !1/2 n 1 X (xi − x ¯ )2 (D.8) σ := n − 1 i=1 where x ¯ is the arithmetic mean of the elements of X . The SD gives a measure that is useful to quantify the amount of variation, or dispersion, of X , provided that the distribution is normal, or Gaussian. For instance, an SD close to zero indicates that the elements of X are all close to x ¯. See e.g. Adams and Essex (2009), Kreyszig (2006), Råde and Westergren (2004), Meyer (2001), Brown and Hwang (1997), and Abramowitz and Stegun (1972) for further details.
D.3 Discrete-time approximation of continuous-time systems D.3.1 Tustin's approximation method or bilinear transformation Let Gc (s) be a TF that describes in the frequency-domain the input-output relationship � external model � of an LTI dynamical system whose dynamics is described in the continuous-time domain by a forced di�erential equation. Let, in addition, the input and the output of the continuous-time system be (ideally) simultaneously sampled, such that a stroboscopic model is obtained. If the sampled input is held constant until the next sampling instant, under the convention that such a signal is continuous from the right, then an LTI system, whose dynamics can be described in the discrete-time domain by a forced di�erence equation, can be obtained, i.e. a ZOH equivalent of the continuous-time system can be obtained. Lastly, let Gd (z) be a TF that describes in the frequency-domain the input-output relationship of the derived equivalent discrete-time system. In the general case, if 163
D. Topics in mathematics revisited the sampling period h ∈ R>0 [s] of the discrete-time system associated to Gd (z) is su�ciently small, then the dynamics described by Gd (z) is very close to that originally described by Gc (s). The complex variables s = σs ± ωs and z = σz ± ωz relate to each other through the relation z = exp(sh), which yields ( IRe(z) : σz = exp(h σs ) cos(h ωs + 2 κ π) (D.9) IIm(z) : ωz = exp(h σs ) sin(h ωs + 2 κ π) where κ ∈ Z. This means that the stable continuous-time poles, which lie in the closed left-hand s-plane, are mapped onto the unit circle in the z -plane, as a direct consequence of the Euler's formula (Chaparro, 2011; Kreyszig, 2006; Råde and Westergren, 2004; Abramowitz and Stegun, 1972). Therefore, the subset Z|1| ⊂ C | Z|1| := {z ∈ C | |z| 6 1} is the closed region of the z -plane that keeps the stable discrete-time poles. In particular, the marginally stable continuous-time poles s ∈ C | IRe(s) = 0 are mapped as z ∈ C | |z| = 1, i.e. these poles lie on the unit circle in the z -plane. The unstable continuous-time poles s ∈ C | IRe(s) > 0 are mapped as z ∈ C \ Z|1| , i.e. they lie outside the unit circle in the z -plane. The frequency distortion phenomenon causing ωz to di�er from ωs is known as frequency warping. Figure D.1 provides an elucidating example of how stable continuous-time poles are mapped onto the z -plane as stable discrete-time poles. The reader is referred to e.g. Franklin et al. (2009), Santina et al. (1999a,b), Åström and Wittenmark (1997), Ogata (1995), and Franklin et al. (1990) for a comprehensive treatment of the matter. The Tustin's approximation method1 , also known as the bilinear transformation, consists of employing the approximation � � 2 z−1 Gd (z) := Gc (˜ s) where s˜ := (D.10) h z+1 The expression of s˜ ∈ C in (D.10) stems from the use of the (rational) Padé approximant [1/1] = S(sh) + O(s3 h3 ) (Baker, Jr. and P∞Graves-Morris, 1996) to the (complex) in�nite power series expansion S(sh) := q=0 (hq /q!) sq that represents the transcendental function exp(sh), such that � � ∞ � q� X h 1 + (sh/2) 2 z−1 q z = exp(sh) = s ≈ [1/1] = ⇔ s≈ (D.11) q! 1 − (sh/2) h z+1 q=0 under the condition that O(s3 h3 ) → 0 as either h → 0, or s → 0. Notice that the 1 There are other approximation methods available in the literature, e.g. Euler methods, Runge-Kutta methods, and Simpson method, which can be found in e.g. Franklin et al. (2009), Santina et al. (1999a,b), Råde and Westergren (2004), Åström and Wittenmark (1997), Ogata (1995), and Franklin et al. (1990).
164
D.3. Discrete-time approximation of continuous-time systems
Figure D.1: Pole correspondence between s-plane (left) and z -plane (right). The ×-marks of matched size and colour indicate corresponding poles through (D.9).
rightmost expression in (D.11) is directly obtained through the manipulation of the expression z ≈ (1 + (sh/2))/(1 − (sh/2)). It is thus immediate to conclude that the Tustin's approximation method:
• preserves the stability properties of the mapping z = exp(sh), i.e. (un)stable continuous-time poles are always mapped as (un)stable discrete-time poles; • yields accurate approximations for su�ciently small sampling periods.
Application example: Trapezoidal method for numerical integration Consider initially the TF
Gc (s) =
y(s) 1 = u(s) s
(D.12)
that represents an integrator de�ned in the continuous-time domain, where u(s) and y(s) are respectively the input and the output of the integrator. Then, by employing the approximation indicated in (D.10), the following result is obtained � � � � y(z) h z+1 y(z) h z+1 := Gc (˜ Gd (z) = s) = ⇔ = (D.13) u(z) 2 z−1 u(z) 2 z−1 Lastly, by cross-multiplying the terms in the rightmost equation in (D.13), reorganising the result conveniently after that, and then utilising the formal relations existing between the calculations with the z -transform and the shift-oper165
D. Topics in mathematics revisited ator calculus (Franklin et al., 2009; Santina et al., 1999a,b; Åström and Wittenmark, 1997; Ogata, 1995; Franklin et al., 1990), although under a slight abuse of notation, it yields
y(k + 1) = y(k) + (h/2) (u(k) + u(k + 1))
with
y(0) = y0
(D.14)
where u(·) and y(·) are respectively the input and the output of the integrator in the discrete-time domain, y0 ∈ R is the initial condition, and k ∈ N (causal system). The equation (D.14) can be straightforwardly extended from its current scalar form to a vector form by just replacing the scalars u(·), y(·), and y0 with n-dimensional vectors u(·), y(·), and y0 . Figure D.2 sketches out a manner of implementing (D.14) in a digital computer in practice. The blocks named z −1 represent memory units which store the current values for use during the next iteration step. The initial and reset conditions are set through the inputs located on the top side of the memory unit blocks. An application example where such an integrator would be used is the implementation of the classical PID control law, as seen in Subsection 8.5.2. Another example is found in Script A.2 in Appendix A.
Figure D.2: Block diagram of a (scalar) numerical integrator based on the trapezoidal method. The blocks named z −1 represent memory units.
Another application example: Dynamical system Consider the following LTI dynamical system ( x(t) ˙ = A x(t) + B u(t)
y(t) = C x(t)
(D.15)
where x(t) ∈ Rn , u(t) ∈ Rm , and y(t) ∈ Rp are the state, input, and output d vectors, respectively, x(t) ˙ = dt [x(t)], t ∈ R>0 [s] is the time, and A ∈ Rn×n , B ∈ n×m p×n R , and C ∈ R are the system, input, and output matrices, respectively. The initial condition of the system is x0 = x(0). 166
D.3. Discrete-time approximation of continuous-time systems The Laplace transform of (D.15) is equal to
(
s x(s) = A x(s) + B u(s) + x0
(D.16)
y(s) = C x(s)
By applying the approximation indicated in (D.10) to the �rst equation in (D.16), under the zero initial condition x0 = 0, the following result is obtained � � 2 z−1 x(z) = A x(z) + B u(z) (D.17) h z+1 Then, after some elementary manipulation of (D.17) is performed in order to isolate the terms exclusively involving the product z x(z) on the left-hand side of its minus sign, the following equation is obtained
(In − (h/2) A) z x(z) = (In + (h/2) A) x(z) + (h/2) B (z + 1) u(z)
(D.18)
where In ∈ Rn×n is an identity matrix. Finally, by pre-multiplying (D.18) by the matrix (In − (h/2) A)−1 , if and only if det(In − (h/2) A) 6= 0, i.e. it is nonsingular, and then utilising the formal relations existing between the calculations with the z -transform and the shiftoperator calculus (Franklin et al., 2009; Santina et al., 1999a,b; Åström and Wittenmark, 1997; Ogata, 1995; Franklin et al., 1990), although under a slight abuse of notation, the approximate discrete-time counterpart of the dynamical system (D.15) is found to be equal to ( x(k + 1) = Φ x(k) + Γ (u(k) + u(k + 1)) with x(0) = x0 (D.19) y(k + 1) = C x(k + 1) where x(·), u(·), and y(·) are respectively the state, input, and output vectors in the discrete-time domain, x0 is the initial condition of the system, k ∈ N (causal system), and the matrices Φ ∈ Rn×n and Γ ∈ Rn×m are de�ned as
� �−1� � h h Φ := In − A In + A 2 2
and
� �−1� � h h Γ := In − A B (D.20) 2 2
Figure D.3 sketches out a manner of implementing (D.19) in a digital computer in practice. The blocks named z −1 represent memory units which store the current values for use during the next iteration step. The initial and reset conditions are set through the inputs located on the top side of the memory unit blocks. An application example where such a discrete-time dynamical system would be used is the implementation of a state observer, as seen in Subsection 8.5.3. 167
D. Topics in mathematics revisited
Figure D.3: Block diagram of the discrete-time dynamical system (D.19). The blocks named z −1 represent memory units.
D.1. NTV dynamical systems which admit well-behaved stroboscopic model representations (Franklin et al., 2009; Santina et al., 1999a,b; Åström and Wittenmark, 1997; Ogata, 1995; Franklin et al., 1990) can also be approximated by the discrete-time dynamical system (D.19). An example can be seen in Section 8.5. Remark
168
References M. A. Abkowitz. Stability and motion control of ocean vehicles. MIT Press, Cambridge, 2nd edition, 1972. M. Abramowitz and I. A. Stegun. Handbook of mathematical functions with formulas, graphs, and mathematical tables. Dover Publications, Inc., Mineola, 1972. R. A. Adams and C. Essex. Calculus: a complete course. Pearson Education Canada, Toronto, Canada, 7th edition, 2009. A. Aguiar and A. Pascoal. Modeling and control of an autonomous underwater shuttle for the transport of benthic laboratories. In IEEE OCEANS 1997 � Canada, pages 888�895, October 1997. M. Aicardi, G. Cannata, G. Casalino, and G. Indiveri. Guidance of 3D underwater non-holonomic vehicle via projection on holonomic solutions. In SURT 2000 / WAC 2000 � USA, pages 11�16, June 2000. G. M. Amado-Filho, G. H. Pereira-Filho, R. G. Bahia, D. P. Abrantes, P. C. Veras, and Z. Matheus. Occurrence and distribution of rhodolith beds on the Fernando de Noronha Archipelago of Brazil. Aquatic Botany, 101(0):41�45, August 2012. G. Antonelli. Underwater robots, volume 96 of STAR � Springer Tracts in Advanced Robotics. Springer, London, UK, 3rd edition, 2014. G. Antonelli, S. Chiaverini, N. Sarkar, and M. West. Adaptive control of an autonomous underwater vehicle: experimental results on ODIN. IEEE Transactions on Control Systems Technology, 9(5):756�765, September 2001. K. J. Åström and T. Hägglund. PID controllers: theory, design, and tuning. Instrument Society of America, North Carolina, 2nd edition, 2011. K. J. Åström and B. Wittenmark. Computer-controlled systems: theory and design. Prentice Hall, Inc., Upper Saddle River, 2nd edition, 1997. 169
References A. N. Atassi and H. K. Khalil. Separation results for the stabilization of nonlinear systems using di�erent high-gain observer designs. Systems & Control Letters, 39(3):183�191, March 2000. M. Athans. Kalman �ltering. In W. S. Levine, editor, The control handbook (in two volumes), volume I, chapter 35, pages 589�594. Jaico Publishing House, Mumbai, India, 1999. G. A. Baker, Jr. and P. R. Graves-Morris. Padé approximants (Encyclopedia of mathematics and its applications � Volume 59). Cambridge University Press, New York, 2nd edition, 1996. F. P. Beer and E. R. Johnston, Jr. Vector mechanics for engineers: statics and dynamics. McGraw-Hill, Inc., New York, 5th edition, 1988. S. Bennett. A brief history of automatic control. IEEE Control Systems, 16(3): 17�25, June 1996. D. S. Bernstein. Matrix mathematics: theory, facts and formulas. Princeton University Press, Princeton, 2nd edition, 2009. R. H. Bishop, R. C. Dorf, C. E. Rohrs, M. Mansour, and R. T. Stefani. Stability tests. In W. S. Levine, editor, The control handbook (in two volumes), volume I, chapter 9, pages 131�156. Jaico Publishing House, Mumbai, India, 1999. M. Blanke, K. P. Lindegaard, and T. I. Fossen. Dynamic model for thrust generation of marine propellers. In IFAC MCMC 2000 � Denmark, pages 363�368, September 2000. E. Børhaug, K. Y. Pettersen, and A. Pavlov. An optimal guidance scheme for cross-track control of underactuated underwater vehicles. In IEEE MED 2006 � Italy, pages 1�5, June 2006. M. Breivik. Topics in guided motion control of marine vessels. PhD thesis, Norwegian University of Science and Technology, Department of Engineering Cybernetics, June 2010. M. Breivik and T. I. Fossen. Guidance laws for autonomous underwater vehicles. In A. V. Inzartsev, editor, Underwater vehicles, chapter 4, pages 51�76. I-Tech, Vienna, Austria, 2009. R. G. Brown and P. Y. C. Hwang. Introduction to random signals and applied Kalman �ltering: with MATLABr exercises and solutions. John Wiley & Sons, Inc., Chichester, UK, 3rd edition, 1997. 170
References M. Caccia. Low-cost high-precision motion control for ROVs. In G. N. Roberts and R. Sutton, editors, Advances in unmanned marine vehicles, volume 69 of IEE Control Series, chapter 9, pages 187�215. IEE � The Institution of Electrical Engineers, Stevenage, UK, 2006. M. Caccia and G. Veruggio. Guidance and control of a recon�gurable unmanned underwater vehicle. IFAC Control Engineering Practice, 8(1):21�37, January 2000. M. Caccia, G. Casalino, R. Cristi, and G. Veruggio. Acoustic motion estimation and control for an unmanned underwater vehicle in a structured environment. IFAC Control Engineering Practice, 6(5):661�670, May 1998. M. Caccia, G. Bruzzone, and G. Veruggio. Guidance of unmanned underwater vehicles: experimental results. In IEEE ICRA 2000 � USA, volume 2, pages 1799�1804, April 2000a. M. Caccia, G. Indiveri, and G. Veruggio. Modeling and identi�cation of openframe variable con�guration unmanned underwater vehicles. IEEE Journal of Oceanic Engineering, 25(2):227�240, April 2000b. M. Caccia, R. Bono, G. Bruzzone, and G. Veruggio. Bottom-following for remotely operated vehicles. IFAC Control Engineering Practice, 11(4):461�470, April 2003. M. Caccia, M. Bibuli, G. Bruzzone, and L. Lapierre. Vehicle-following for unmanned surface vehicles. In G. N. Roberts and R. Sutton, editors, Further advances in unmanned marine vehicles, volume 77 of IET Control Engineering Series, chapter 10, pages 201�230. IET � The Institution of Engineering and Technology, Stevenage, UK, 2012. A. Ca�az, A. Caiti, V. Calabrò, G. Casalino, P. Guerrini, A. Maguer, A. Munafò, J. R. Potter, H. Tay, and A. Turetta. The enhanced Folaga: a hybrid AUV with modular payloads. In G. N. Roberts and R. Sutton, editors, Further advances in unmanned marine vehicles, volume 77 of IET Control Engineering Series, chapter 14, pages 309�330. IET � The Institution of Engineering and Technology, Stevenage, UK, 2012. W. Caharija. Integral line-of-sight guidance and control of underactuated marine vehicles. PhD thesis, Norwegian University of Science and Technology, Department of Engineering Cybernetics, November 2014. W. Caharija, K. Y. Pettersen, A. J. Sørensen, M. Candeloro, and J. T. Gravdahl. Relative velocity control and integral line of sight for path following of autonomous surface vessels: merging intuition with theory. Journal of Engineering for the Maritime Environment (Part M), 228(2):180�191, May 2014. 171
References M. Candeloro. Design of observers for DP and tracking of ROV "Minerva" with experimental results. Master's thesis, Università Politecnica delle Marche & Norwegian University of Science and Technology, Dipartimento di Ingegneria Informatica, Gestionale e dell'Automazione & Department of Engineering Cybernetics, June 2011. M. Candeloro, F. Dezi, A. J. Sørensen, and S. Longhi. Analysis of a multi-objective observer for UUVs. In IFAC NGCUV 2012 � Portugal, pages 343�348, April 2012a. M. Candeloro, A. J. Sørensen, S. Longhi, and F. Dukan. Observers for dynamic positioning of ROVs with experimental results. In IFAC MCMC 2012 � Italy, pages 85�90, September 2012b. M. Candeloro, A. M. Lekkas, A. J. Sørensen, and T. I. Fossen. Continuous curvature path planning using Voronoi diagrams and Fermat's spirals. In IFAC CAMS 2013 � Japan, pages 132�137, September 2013. L. F. Chaparro. Signals and systems using MATLABr . Academic Press, Burlington, 2011. R. D. Christ and R. L. Wernli. The ROV manual: a user guide for observation class remotely operated vehicles. Butterworth-Heinemann, Oxford, UK, 2007. R. D. Christ and R. L. Wernli. The ROV manual: a user guide for remotely operated vehicles. Butterworth-Heinemann, Oxford, UK, 2nd edition, 2014. M. Chyba, T. Haberkorn, R. N. Smith, and S. K. Choi. Design and implementation of time e�cient trajectories for autonomous underwater vehicles. Ocean Engineering, 35(1):63�76, January 2008. M. Chyba, T. Haberkorn, S. B. Singh, R. N. Smith, and S. K. Choi. Increasing underwater vehicle autonomy by reducing energy consumption. Ocean Engineering, 36(1):62�73, January 2009. G. Conte and A. Serrani. Robust control of a remotely operated underwater vehicle. IFAC Automatica, 34(2):193�198, February 1998. A. R. Dahl. Path planning and guidance for marine surface vessels. Master's thesis, Norwegian University of Science and Technology, Department of Engineering Cybernetics, June 2013. S. Dasgupta. Kharitonov's theorem revisited. Systems & Control Letters, 11(5): 381�384, November 1988. 172
References K. D. Do and J. Pan. Control of ships and underwater vehicles: design for underactuated and nonlinear marine systems. Advances in Industrial Control Series. Springer-Verlag, London, UK, 2009. D. C. Donha, D. S. Desanj, M. R. Katebi, and M. J. Grimble. H∞ adaptive controllers for auto-pilot applications. International Journal of Adaptive Control and Signal Processing, 12(8):623�648, December 1998. L. E. Dubins. On curves of minimal length with a constraint on average curvature, and with prescribed initial and terminal positions and tangents. American Journal of Mathematics, 79(3):497�516, July 1957. F. Dukan. ROV motion control systems. PhD thesis, Norwegian University of Science and Technology, Department of Marine Technology, October 2014. F. Dukan and A. J. Sørensen. Joystick in closed-loop control of ROVs with experimental results. In IFAC NGCUV 2012 � Portugal, pages 293�300, April 2012. F. Dukan, M. Ludvigsen, and A. J. Sørensen. Dynamic positioning system for a small size ROV with experimental results. In IEEE OCEANS 2011 � Spain, pages 1�10, June 2011. O. Egeland and J. T. Gravdahl. Modeling and simulation for automatic control. Marine Cybernetics, Trondheim, Norway, 2002. O. Egeland, M. Dalsmo, and O. J. Sørdalen. Feedback control of a nonholonomic underwater vehicle with constant desired con�guration. The International Journal of Robotics Research, 15(1):24�35, February 1996. P. Encarnação and A. Pascoal. Combined trajectory tracking and path following for marine craft. In MED 2001 � Croatia, pages 1�8, June 2001a. P. Encarnação and A. Pascoal. Combined trajectory tracking and path following for underwater vehicles. In IFAC CAMS 2001 � Scotland, pages 303�310, July 2001b. P. Encarnação and A. Pascoal. Combined trajectory tracking and path following: an application to the coordinated control of autonomous marine craft. In IEEE CDC 2001 � USA, pages 964�969, December 2001c. F. Esfandiari and H. K. Khalil. Output feedback stabilization of fully linearizable systems. International Journal of Control, 56(5):1007�1037, April 1992. M. B. Estrada, M. F. Garcia, M. Malabre, and J. C. M. García. Left invertibility and duality for linear systems. Linear Algebra and its Applications, 425(2�3): 345�373, September 2007. 173
References Z. Fabekovi¢, Z. E²kinja, and Z. Vuki¢. Micro ROV simulator. In IEEE ELMAR 2007 � Croatia, pages 97�101, September 2007. O. M. Faltinsen. Sea loads on ships and o�shore structures. Cambridge Ocean Technology Series. Cambridge University Press, Cambridge, UK, 1990. R. T. Farouki. Pythagorean-hodograph quintic transition curves of monotone curvature. Computer-Aided Design, 29(9):601�606, September 1997. R. T. Farouki. Pythagorean-hodograph curves: algebra and geometry inseparable, volume 1 of Geometry and Computing. Springer-Verlag, Berlin, Germany, 2008. R. T. Farouki. The Bernstein polynomial basis: a centennial retrospective. Computer-Aided Geometric Design, 29(6):379�419, August 2012. R. T. Farouki and T. Sakkalis. Pythagorean hodographs. IBM Journal of Research and Development, 34(5):736�752, September 1990. D. A. Fernandes and D. C. Donha. Optimal control system for a semi-autonomous underwater vehicle. In IFAC MCMC 2009 � Brazil, pages 255�260, September 2009. D. A. Fernandes and D. C. Donha. Optimal control system for a semi-autonomous underwater vehicle: modeling, synthesis, simulation and analysis. VDM Verlag Dr. Müller, Saarbrücken, Germany, 2010. Originally published as a Master's thesis, Polytechnic School of the University of São Paulo, São Paulo, Brazil, 2008. D. A. Fernandes, F. Dukan, and A. J. Sørensen. Reference model for high performance and low energy consumption motions. In IFAC NGCUV 2012 � Portugal, pages 217�222, April 2012. D. A. Fernandes, A. J. Sørensen, and D. C. Donha. Trajectory tracking motion control system for observation class ROVs. In IFAC CAMS 2013 � Japan, pages 251�256, September 2013. D. A. Fernandes, A. J. Sørensen, and D. C. Donha. Full-scale sea trials of a motion control system for ROVs based on a high-gain state observer. In IFAC WC 2014 � South Africa, pages 5157�5162, August 2014. D. A. Fernandes, A. J. Sørensen, and D. C. Donha. Path generation for highperformance motion of ROVs based on a reference model. Modeling, Identi�cation and Control, 36(2):81�101, April 2015a. 174
References D. A. Fernandes, A. J. Sørensen, K. Y. Pettersen, and D. C. Donha. Output feedback motion control system for observation class ROVs based on a high-gain state observer: theoretical and experimental results. IFAC Control Engineering Practice, 39:90�102, June 2015b. L. Fillinger and T. Funke. A new 3D modelling method to extract subtransect dimensions from underwater videos. Ocean Science, 9(2):461�476, April 2013. A. R. Forsyth. Calculus of variations. Dover Publications, Inc., New York, 1960. Originally published: Cambridge University Press, 1927. New York. T. I. Fossen. Handbook of marine craft hydrodynamics and motion control. John Wiley & Sons Ltd., Chichester, UK, 2011. T. I. Fossen and M. Blanke. Nonlinear output feedback control of underwater vehicle propellers using feedback from estimated axial �ow velocity. IEEE Journal of Oceanic Engineering, 25(2):241�255, April 2000. T. I. Fossen and O.-E. Fjellstad. Robust adaptive control of underwater vehicles: a comparative study. In IFAC CAMS 1995 � Norway, pages 66�74, May 1995. T. I. Fossen and B. A. Foss. Sliding control of MIMO nonlinear systems. Modeling, Identi�cation and Control, 12(3):129�138, November 1991. T. I. Fossen and K. Y. Pettersen. On uniform semiglobal exponential stability (USGES) of proportional line-of-sight guidance laws. IFAC Automatica, 50(11): 2912�2917, November 2014. T. I. Fossen and A. Ross. Nonlinear modelling, identi�cation and control of UUVs. In G. N. Roberts and R. Sutton, editors, Further advances in unmanned marine vehicles, volume 77 of IET Control Engineering Series, chapter 6, pages 113� 128. IET � The Institution of Engineering and Technology, Stevenage, UK, 2012. T. I. Fossen and S. I. Sagatun. Adaptive control of nonlinear systems: a case study of underwater robotic systems. Journal of Robotic Systems, 8(3):393�412, June 1991. T. I. Fossen, T. A. Johansen, and T. Perez. A survey of control allocation methods for underwater vehicles. In A. V. Inzartsev, editor, Underwater vehicles, chapter 7, pages 109�128. I-Tech, Vienna, Austria, 2009. G. F. Franklin, J. D. Powell, and M. L. Workman. Digital control of dynamic systems. Addison-Wesley Publishing Company, Cambridge, 2nd edition, 1990. 175
References G. F. Franklin, J. D. Powell, and A. Emami-Naeini. Feedback control of dynamic systems. Prentice Hall, Inc., Upper Saddle River, 6th edition, 2009. B. Friedland. Control system design: an introduction to state-space methods. McGraw-Hill, Inc., New York, 1986. B. Friedland. Observers. In W. S. Levine, editor, The control handbook (in two volumes), volume I, chapter 37, pages 607�618. Jaico Publishing House, Mumbai, India, 1999. D. Fryxell, P. Oliveira, A. Pascoal, C. Silvestre, and I. Kaminer. Navigation, guidance and control of AUVs: an application to the MARIUS vehicle. IFAC Control Engineering Practice, 4(3):401�409, March 1996. A. Gelb, J. F. Kasper, Jr., R. A. Nash, Jr., C. F. Price, and A. A. Sutherland, Jr. Applied optimal estimation. MIT Press, Cambridge, 1974. R. Goebel, R. G. Sanfelice, and A. R. Teel. Hybrid dynamical systems: modeling, stability, and robustness. Princeton University Press, Princeton, 2012. K. R. Goheen and E. R. Je�erys. Multivariable self-tuning autopilots for autonomous and remotely operated underwater vehicles. IEEE Journal of Oceanic Engineering, 15(3):144�151, July 1990. D. E. Goldberg. Genetic algorithms in search, optimization and machine learning. Addison-Wesley Longman Publishing Co., Inc., Boston, 1989. D. Graham and R. C. Lathrop. The synthesis of optimum transient response: criteria and standard forms. AIEE Transactions � Part II: Applications and Industry, 72(5):273�288, November 1953. J. Guo, F.-C. Chiu, and C.-C. Huang. Design of a sliding mode fuzzy controller for the guidance and control of an autonomous underwater vehicle. Ocean Engineering, 30(16):2137�2155, November 2003. G. Harary and A. Tal. 3D Euler spirals for 3D curve completion. Computational Geometry, 45(3):115�126, April 2012. J. Hauser and R. Hindman. Maneuver regulation from trajectory tracking: feedback linearizable systems. In IFAC NCSD 1995 � USA, pages 595�600, June 1995. A. J. Healey and D. Lienard. Multivariable sliding-mode control for autonomous diving and steering of unmanned underwater vehicles. IEEE Journal of Oceanic Engineering, 18(3):327�339, July 1993. 176
References D. Hiranandani, C. White, C. M. Clark, T. Gambin, and K. Buhagiar. Underwater robots with sonar and smart tether for underground cistern mapping and exploration. In The 10th International Symposium on Virtual Reality, Archaeology and Cultural Heritage (VAST'09) � Malta, page n.a., September 2009. Short and project papers. G. Ho, N. Pavlovic, and R. Arrabito. Human factors issues with operating unmanned underwater vehicles. Proceedings of the Human Factors and Ergonomics Society Annual Meeting, 55(1):429�433, September 2011. N. Q. Hoang and E. Kreuzer. Adaptive PD-controller for positioning of a remotely operated vehicle close to an underwater structure: theory and experiments. IFAC Control Engineering Practice, 15(4):411�419, April 2007. R. A. Horn and C. R. Johnson. Matrix analysis. Cambridge University Press, London, UK, 2nd edition, 2013. L. Hsu, R. R. Costa, F. Lizarralde, and J. P. V. S. da Cunha. Dynamic positioning of remotely operated underwater vehicles. IEEE Robotics and Automation Magazine, 7(3):21�31, September 2000. D. E. Humphreys and K. W. Watkinson. Prediction of the acceleration hydrodinamic coe�cients for underwater vehicles from geometric parameters. Technical report NCSL-TR-327-78, Naval Coastal System Center, Panama City, 1978. F. Huo and A.-N. Poo. Improving contouring accuracy by using generalized crosscoupled control. International Journal of Machine Tools & Manufacture, 63(0): 49�57, July 2012. F. H. Imlay. The complete expressions for added mass of a rigid body moving in an ideal �uid. Technical report DTMB 1528, David Taylor Model Basin, Washington D.C., 1961. H. Ishidera, Y. Tsusaka, Y. Ito, T. Oishi, S. Chiba, and T. Maki. Simulation and experiment of automatic controlled ROV. In ASME OMAE 1986 � Japan, volume 3, pages 260�267, April 1986. G. Johnsen, Z. Volent, E. Sakshaug, F. Sigernes, and L. H. Pettersson. Remote sensing in the Barents Sea. In E. Sakshaug, G. Johnsen, and K. Kovacs, editors, Ecosystem Barents Sea, chapter 6, pages 139�166. Tapir Academic Press, Trondheim, Norway, 2009. C. D. Johnson. Process control instrumentation technology. Prentice Hall, Inc., Upper Saddle River, 8th edition, 2006. T. Kailath. Linear systems. Prentice Hall, Inc., Upper Saddle River, 1980. 177
References R. E. Kalman. A new approach to linear �ltering and prediction problems. ASME Journal of Basic Engineering, 82(Series D):35�45, March 1960. R. E. Kalman and R. S. Bucy. New results in linear �ltering and prediction theory. ASME Journal of Basic Engineering, 83(Series D):95�108, March 1961. E. W. Kamen. The Fourier, Laplace, and z -transforms. In W. S. Levine, editor, The control handbook (in two volumes), volume I, chapter 2, pages 17�31. Jaico Publishing House, Mumbai, India, 1999. V. Kanakakis, K. P. Valavanis, and N. C. Tsourveloudis. Fuzzy-logic based navigation of underwater vehicles. Intelligent & Robotic Systems, 40(1):45�88, May 2004. L. E. Kavraki and S. M. LaValle. Motion planning. In B. Siciliano and O. Khatib, editors, Springer handbook of robotics, chapter 5, part A, pages 109�131. Springer-Verlag, Berlin, Germany, 2008. H. K. Khalil. Nonlinear systems. Prentice Hall, Inc., Upper Saddle River, 3rd edition, 2002. H. K. Khalil and L. Praly. High-gain observers in nonlinear feedback control. International Journal of Robust and Nonlinear Control, 24(6):993�1015, July 2013. H. K. Khalil and L. Praly. High-gain observers in nonlinear feedback control. International Journal of Robust and Nonlinear Control, 24(6):991�992, February 2014. V. L. Kharitonov. Asymptotic stability of an equilibrium position of a family of systems of linear di�erential equations. Di�erential Equations, 14:1483�1485, 1979. K. Kim and T. Ura. Fuel-optimally guided navigation and tracking control of AUV under current interaction. In IEEE OCEANS 2003 � USA, volume 2, pages 663�670, September 2003. J. C. Kinsey, R. M. Eustice, and L. L. Whitcomb. A survey of underwater vehicle navigation: recent advances and new challenges. In IFAC MCMC 2006 � Portugal, pages 1�12, September 2006. D. E. Kirk. Optimal control theory: an introduction. Dover Publications, Inc., Mineola, 13th edition, 2004. 178
References P. V. Kokotovi¢, H. K. Khalil, and J. O'Relly. Singular perturbation methods in control: analysis and design (Classics in applied mathematics). SIAM � Society for Industrial and Applied Mathematics, Philadelphia, 1999. Originally published: Academic Press, 1986. London, UK. W. R. Kolk and R. A. Lerman. Nonlinear system dynamics. Van Nostrand Reinhold, New York, 16th edition, 1992. E. Kreyszig. Advanced engineering mathematics. John Wiley & Sons, Inc., Hoboken, 9th edition, 2006. R. P. Kumar, A. Dasgupta, and C. S. Kumar. Real-time optimal motion planning for autonomous underwater vehicles. Ocean Engineering, 32(11�12):1431�1447, August 2005. H. Kwakernaak and R. Sivan. Linear optimal control systems. John Wiley & Sons, Inc., Hoboken, 1972. LabVIEWr 2012 SP1 � Version 12.0.1f5. National Instruments, Austin, December 2012. URL http://www.ni.com/labview/. X. C. Lai, A. Al-Mamun, and S. S. Ge. Polar polynomial curve for smooth, collision-free path generation between two arbitrary con�gurations for nonholonomic robots. In IEEE ISIC 2007 � Singapore, pages 59�64, October 2007. H. Lamb. Hydrodynamics. Cambridge University Press, London, UK, 1932. I. D. Landau. A survey of model reference adaptive techniques � theory and applications. IFAC Automatica, 10(4):353�379, January 1974. B. P. Lathi. Ordinary linear di�erential and di�erence equations. In W. S. Levine, editor, The control handbook (in two volumes), volume I, chapter 1, pages 3�15. Jaico Publishing House, Mumbai, India, 1999. S. M. LaValle. Planning algorithms. Cambridge University Press, New York, 2006. A. M. Lekkas. Guidance and path-planning systems for autonomous vehicles. PhD thesis, Norwegian University of Science and Technology, Department of Engineering Cybernetics, April 2014. A. M. Lekkas, A. R. Dahl, M. Breivik, and T. I. Fossen. Continuous-curvature path generation using Fermat's spiral. Modeling, Identi�cation and Control, 34 (4):183�198, December 2013. 179
References A. Levant. Chattering analysis. IEEE Transactions on Automatic Control, 55(6): 1380�1389, June 2010. R. Levien. The Euler spiral: a mathematical history. Technical report UCB/EECS-2008-111, EECS Department, University of California, Berkeley, Berkeley, September 2008. E. M. Lewandowski. The dynamics of marine craft: maneuvering and seakeeping, volume 22 of Advanced Series on Ocean Engineering. World Scienti�c Publishing, Arlington, 2004. X. Liang, Y. Li, Y. Xu, L. Wan, and Z. Qin. Fuzzy neural network control of underwater vehicles based on desired state programming. Marine Science and Application, 5(3):1�4, September 2006. C.-F. Lin. Modern navigation, guidance, and control processing. Prentice Hall Series in Advanced Navigation, Guidance, and Control, and Their Applications. Prentice Hall, Inc., Upper Saddle River, 1991. Ø. A. G. Loe. Collision avoidance for unmanned surface vehicles. Master's thesis, Norwegian University of Science and Technology, Department of Engineering Cybernetics, June 2008. D. Loebis, W. Naeem, R. Sutton, J. Chudley, and A. Tiano. Navigation, guidance and control of the Hammerhead autonomous underwater vehicle. In G. N. Roberts and R. Sutton, editors, Advances in unmanned marine vehicles, volume 69 of IEE Control Series, chapter 7, pages 127�157. IEE � The Institution of Electrical Engineers, Stevenage, UK, 2006. A. Loría and E. Panteley. Cascaded nonlinear time-varying systems: analysis and design. In F. Lamnabhi-Lagarrigue, A. Loría, and E. Panteley, editors, Advanced topics in control systems theory, LNCIS 311, chapter 2, pages 23�64. Springer-Verlag, London, UK, 2005. R. Lozano, B. Brogliato, O. Egeland, and B. Maschke. Dissipative systems analysis and control: theory and applications. Springer-Verlag, London, UK, 2000. M. Ludvigsen. An ROV toolbox for optical and acoustical seabed investigations. PhD thesis, Norwegian University of Science and Technology, Department of Marine Technology, April 2010. M. Ludvigsen and Ø. T. Ødegaard. Fullskala thrust-test av Minerva (in Norwegian). Technical report, Department of Marine Technology - Norwegian University of Science and Technology, Trondheim, Norway, November 2004. 180
References M. Ludvigsen and Ø. T. Ødegaard. Friprøveforsøk med ROV-thruster (in Norwegian). Technical report, Department of Marine Technology - Norwegian University of Science and Technology, Trondheim, Norway, March 2005. M. Ludvigsen, B. Sortland, G. Johnsen, and H. Singh. Applications of georeferenced underwater photomosaics in marine biology and archaeology. Oceanography, 20(4):140�149, December 2007. J. M. Maciejowski. Predictive control: with constraints. Pearson Education Ltd., Harlow, UK, 2002. R. Mahony, T. Hamel, and J.-M. P�imlin. Complementary �lter design on the special orthogonal group SO(3). In IEEE CDC 2005 � Spain, pages 1477�1484, December 2005. R. Mahony, T. Hamel, and J.-M. P�imlin. Nonlinear complementary �lters on the special orthogonal group. IEEE Transactions on Automatic Control, 53(5): 1203�1218, June 2008. M. Mansour and B. D. O. Anderson. Kharitonov's theorem and the second method of Lyapunov. Systems & Control Letters, 20(1):39�47, January 1993. D. B. Marco and A. J. Healey. Command, control, and navigation experimental results with the NPS ARIES AUV. IEEE Journal of Oceanic Engineering, 26 (4):466�476, October 2001. L. Marsh, J. T. Copley, V. A. I. Huvenne, P. A. Tyler, and the Isis ROV facility. Getting the bigger picture: using precision Remotely Operated Vehicle (ROV) videography to acquire high-de�nition mosaic images of newly discovered hydrothermal vents in the southern ocean. Deep Sea Research � Part II: Topical Studies in Oceanography, 92(0):124�135, August 2013. S. C. Martin and L. L. Whitcomb. Preliminary results in experimental identi�cation of 3-DOF coupled dynamical plant for underwater vehicles. In IEEE OCEANS 2008 � Canada, pages 1�9, September 2008. S. C. Martin and L. L. Whitcomb. Preliminary experiments in underactuated nonlinear model-based tracking control of underwater vehicles with three degree-offreedom fully-coupled dynamical plant models: theory and experimental evaluation. In IEEE OCEANS 2012 � USA, pages 1�7, October 2012. MATLABr � Version 8.2.0.701 (R2013b). The MathWorks, Inc., Natick, August 2013. URL http://www.mathworks.com. 181
References A. Matsubara, K. Nagaoka, and T. Fujita. Model-reference feedforward controller design for high-accuracy contouring control of machine tool axes. CIRP Annals � Manufacturing Technology, 60(1):415�418, January 2011. C. D. Meyer. Matrix analysis and applied linear algebra. SIAM � Society for Industrial and Applied Mathematics, Philadelphia, 2001. J. Minguez, F. Lamiraux, and J.-P. Laumond. Motion planning and obstacle avoidance. In B. Siciliano and O. Khatib, editors, Springer handbook of robotics, chapter 35, part E, pages 827�852. Springer-Verlag, Berlin, Germany, 2008. W. Naeem, R. Sutton, S. M. Ahmad, and R. S. Burns. A review of guidance laws applicable to unmanned underwater vehicles. The Journal of Navigation, 56 (1):15�29, January 2003. W. Naeem, R. Sutton, J. Chudley, F. R. Dalgleish, and S. Tetlow. A genetic algorithm-based model predictive control autopilot design and its implementation in an autonomous underwater vehicle. Journal of Engineering for the Maritime Environment, 218(3):175�188, September 2004. W. Naeem, R. Sutton, and T. Xu. An automatic control and fault-tolerant multisensor navigation system design for an unmanned maritime vehicle. In G. N. Roberts and R. Sutton, editors, Further advances in unmanned marine vehicles, volume 77 of IET Control Engineering Series, chapter 11, pages 231�253. IET � The Institution of Engineering and Technology, Stevenage, UK, 2012. W. Nelson. Continuous-curvature paths for autonomous vehicles. In IEEE ICRA 1989 � USA, volume 3, pages 1260�1264, May 1989. J. N. Newman. Marine hydrodynamics. MIT Press, Cambridge, 1977. K. Ogata. Discrete-time control systems. Prentice Hall, Inc., Upper Saddle River, 2nd edition, 1995. P. Oliveira, C. Silvestre, P. Aguiar, and A. Pascoal. Guidance and control of the SIRENE underwater vehicle: from system design to tests at sea. In IEEE OCEANS 1998 � France, pages 1043�1048, September 1998. E. Omerdic, D. Toal, S. Nolan, and H. Ahmad. ROV LATIS: next generation smart underwater vehicle. In G. N. Roberts and R. Sutton, editors, Further advances in unmanned marine vehicles, volume 77 of IET Control Engineering Series, chapter 2, pages 9�44. IET � The Institution of Engineering and Technology, Stevenage, UK, 2012. 182
References M. Pachter, C. H. Houpis, V. T. Coppola, N. H. McClamroch, S. M. Joshi, A. G. Kelkar, and D. Haessig. Aerospace controls. In W. S. Levine, editor, The control handbook (in two volumes), volume I, chapter 75, pages 1287�1338. Jaico Publishing House, Mumbai, India, 1999. B. Paden and R. Panja. Globally asymptotically stable PD+ controller for robot manipulators. International Journal of Control, 47(6):1697�1712, June 1988. J. Park, W. Chung, and J. Yuh. Nonlinear H∞ optimal PID control of autonomous underwater vehicles. In IEEE UT 2000 � Japan, pages 193�198, May 2000. T. Perez. Ship motion control: course keeping and roll stabilisation using rudder and �ns. Advances in Industrial Control Series. Springer-Verlag, London, UK, 2005. T. Perez and T. I. Fossen. Kinematic models for manoeuvring and seakeeping of marine vessels. Modeling, Identi�cation and Control, 28(1):19�30, January 2007. M. Perrier and C. Canudas-de-Wit. Experimental comparison of PID vs. PID plus nonlinear controller for subsea robots. Autonomous Robots, 3(2):195�212, June 1996. N. J. Pioch, B. Roberts, and D. Zeltzer. A virtual environment for learning to pilot remotely operated vehicles. In IEEE VSMM 1997 � Switzerland, pages 218�226, September 1997. M. Quintana. Espelho mágico (in Portuguese). Editora Globo, São Paulo, Brazil, 1951. M. Quintana. Prosa & Verso (in Portuguese). Editora Globo, São Paulo, Brazil, 1978. L. Råde and B. Westergren. Mathematics handbook for science and engineering. Studentlitteratur, Lund, Sweden, 5th edition, 2004. A. Rantzer. Stability conditions for polytopes of polynomials. IEEE Transactions on Automatic Control, 37(1):79�89, January 1992. J. E. G. Refsnes. Nonlinear model-based control of slender body AUVs. PhD thesis, Norwegian University of Science and Technology, Department of Marine Technology, March 2008. J. E. G. Refsnes and A. J. Sørensen. Hydrodynamic modelling for dynamic positioning and maneuvering controller design. In ASME OMAE 2012 � Brazil, volume 5, pages 355�361, July 2012. 183
References G. N. Roberts, R. Sutton, A. Zirilli, and A. Tiano. Intelligent ship autopilots � A historical perspective. Mechatronics, 13(10):1091�1103, December 2003. M. S. Santina, A. R. Stubberud, and G. H. Hostetter. Discrete-time systems. In W. S. Levine, editor, The control handbook (in two volumes), volume I, chapter 11, pages 239�251. Jaico Publishing House, Mumbai, India, 1999a. M. S. Santina, A. R. Stubberud, and G. H. Hostetter. Discrete-time equivalents to continuous-time systems. In W. S. Levine, editor, The control handbook (in two volumes), volume I, chapter 13, pages 265�279. Jaico Publishing House, Mumbai, India, 1999b. M. S. Santina, A. R. Stubberud, and G. H. Hostetter. Design methods for discretetime, linear time-invariant systems. In W. S. Levine, editor, The control handbook (in two volumes), volume I, chapter 14, pages 281�300. Jaico Publishing House, Mumbai, India, 1999c. H.-P. Seidel. An introduction to polar forms. IEEE Computer Graphics and Applications, 13(1):38�46, January 1993. M. E. Sezer and D. D. iljak. Decentralized control. In W. S. Levine, editor, The control handbook (in two volumes), volume I, chapter 49, pages 779�793. Jaico Publishing House, Mumbai, India, 1999. B. F. Silveira. Mecânica geral (in Portuguese). Livraria Nobel S.A., São Paulo, Brazil, 7th edition, 1978. C. Silvestre and A. Pascoal. Control of the INFANTE AUV using gain scheduled static output feedback. IFAC Control Engineering Practice, 12(12):1501�1509, December 2004. H. Singh, C. Roman, O. Pizarro, R. M. Eustice, and A. Can. Towards highresolution imaging from underwater vehicles. The International Journal of Robotics Research, 26(1):55�74, January 2007. R. Skjetne. The maneuvering problem. PhD thesis, Norwegian University of Science and Technology, Department of Engineering Cybernetics, March 2005. R. Skjetne, I.-A. F. Ihle, and T. I. Fossen. Formation control by synchronizing multiple maneuvering systems. In IFAC MCMC 2003 � Spain, pages 280�285, September 2003. R. Skjetne, T. I. Fossen, and P. V. Kokotovi¢. Robust output maneuvering for a class of nonlinear systems. IFAC Automatica, 40(3):373�383, March 2004a. 184
References R. Skjetne, Ø. N. Smogeli, and T. I. Fossen. A nonlinear ship maneuvering model: identi�cation and adaptive control with experiments for a model ship. Modeling, Identi�cation and Control, 25(1):3�27, January 2004b. R. Skjetne, Ø. N. Smogeli, and T. I. Fossen. Modeling, identi�cation, and adaptive maneuvering of cybership II: a complete design with experiments. In IFAC CAMS 2004 � Italy, pages 191�196, July 2004c. R. Skjetne, T. I. Fossen, and P. V. Kokotovi¢. Adaptive output maneuvering, with experiments, for a model ship in a marine control laboratory. IFAC Automatica, 41(2):289�298, February 2005. S. Skogestad. Simple analytic rules for model reduction and PID controller tuning. Modeling, Identi�cation and Control, 25(2):85�120, April 2004. S. Skogestad. Feedback: still the simplest and best solution. Modeling, Identi�cation and Control, 30(3):149�155, July 2009. S. Skogestad and I. Postlethwaite. Multivariable feedback control: analysis and design. John Wiley & Sons Ltd., Chichester, UK, 6th edition, 2001. J.-J. E. Slotine and W. Li. Applied nonlinear control. Pearson Education Taiwan Ltd., Taipei, Taiwan, 2005. D. A. Smallwood and L. L. Whitcomb. Model-based dynamic positioning of underwater robotic vehicles: theory and experiment. IEEE Journal of Oceanic Engineering, 29(1):169�186, January 2004. SNAME. The Society of Naval Architects and Marine Engineers. Nomenclature for treating the motion of a submerged body through a �uid. In Technical and research bulletin No. 1�5 � New York, pages 1�15, April 1950. A. J. Sørensen. Structural issues in the design and operation of marine control systems. Annual Reviews in Control, 29(1):125�149, April 2005. A. J. Sørensen. Marine control systems: propulsion and motion control of ships and ocean structures. Lecture notes. Marine Technology Centre, Trondheim, Norway, 3rd edition, 2013. A. J. Sørensen, F. Dukan, M. Ludvigsen, D. A. Fernandes, and M. Candeloro. Development of dynamic positioning and tracking system for the ROV Minerva. In G. N. Roberts and R. Sutton, editors, Further advances in unmanned marine vehicles, volume 77 of IET Control Engineering Series, chapter 6, pages 113� 128. IET � The Institution of Engineering and Technology, Stevenage, UK, 2012. 185
References A. Tsourdos, B. White, and M. Shanmugavel. Cooperative path planning of unmanned aerial vehicles. Aerospace Series. John Wiley & Sons Ltd., Chichester, UK, 2011. B. van Brunt. The calculus of variations. Springer-Verlag, New York, 2004. R. van der Merwe. Sigma-point Kalman �lters for probabilistic inference in dynamic state-space models. PhD thesis, Oregon Health & Science University, OGI School of Science & Engineering, April 2004. A. Vasilijevi¢, N. Mi²kovi¢, and Z. Vuki¢. Comparative assessment of human machine interfaces for ROV guidance with di�erent levels of secondary visual workload. In IEEE MED 2013 � Greece, pages 1292�1297, June 2013. Z. Vuki¢, L. Kulja£a, D. Ðonlagi¢, and S. Te²njak. Nonlinear control systems. Control Engineering Series. Marcel Dekker, Inc., New York, 2003. S. Wadoo and P. Kachroo. Autonomous underwater vehicles: modeling, control design, and simulation. CRC Press, New York, 2011. WAMIT, Inc. WAMIT � User manual � Version 7.062. Online, October 2013. URL http://www.wamit.com/manual.htm. K. Wendel. Hydrodynamic masses and hydrodynamic moments of inertia. TMB translation 260, July 1956. L. L. Whitcomb, D. R. Yoerger, and H. Singh. Advances in Doppler-based navigation of underwater robotic vehicles. In IEEE ICRA 1999 � USA, volume 1, pages 399�406, May 1999. J.-S. Yang, W. S. Levine, R. C. Dorf, R. H. Bishop, J. J. D'Azzo, C. H. Houpis, K. J. Åström, T. Hägglund, K. Ogata, R. D. Braatz, and Z. J. Palmor. Design methods. In W. S. Levine, editor, The control handbook (in two volumes), volume I, chapter 10, pages 157�237. Jaico Publishing House, Mumbai, India, 1999. D. R. Yoerger and J.-J. E. Slotine. Robust trajectory control of underwater vehicles. IEEE Journal of Oceanic Engineering, 10(4):462�470, October 1985. D. R. Yoerger and J.-J. E. Slotine. Adaptive sliding control of an experimental underwater vehicle. In IEEE ICRA 1991 � USA, volume 3, pages 2746�2751, April 1991. D. R. Yoerger, J. B. Newman, and J.-J. E. Slotine. Supervisory control system for the JASON ROV. IEEE Journal of Oceanic Engineering, 11(3):392�400, July 1986. 186
References D. R. Yoerger, A. M. Bradley, B. B. Walden, H. Singh, and R. Bachmayer. Surveying a subsea lava �ow using the Autonomous Benthic Explorer (ABE). International Journal of Systems Science, 29(10):1031�1044, October 1998. J. Yuh. Modeling and control of underwater robotic vehicles. IEEE Transactions on Systems, Man and Cybernetics, 20(6):1475�1483, November 1990. K. Zhou, J. C. Doyle, and K. Glover. Robust and optimal control. Prentice-Hall, Inc., Upper Saddle River, 1996.
187
Previous PhD theses published at the Department of Marine Technology (earlier: Faculty of Marine Technology) NORWEGIAN UNIVERSITY OF SCIENCE AND TECHNOLOGY Report No. Author
. .
Kavlie, Dag Hansen, Hans R.
.
Gisvold, Kaare M.
.
Lund, Sverre
.
Vinje, Tor
.
Lorentz, Jan D.
.
Carlsen, Carl A.
.
Larsen, Carl M.
UR-79-01
Brigt Hatlestad, MK
UR-79-02
Erik Pettersen, MK
UR-79-03
Sverre Valsgård, MK
UR-79-04
Nils T. Nordsve, MK
UR-79-05
Ivar J. Fylling, MK
Title
Optimization of Plane Elastic Grillages, 1967 Man-Machine Communication and DataStorage Methods in Ship Structural Design, 1971 A Method for Non-Linear Mixed-Integer Programming and its Application to Design Problems, 1971 Tanker Frame Optimalization by Means of SUMT-Transformation and Behaviour Models, 1971 On Vibration of Spherical Shells Interacting with Fluid, 1972 Tank Arrangement for Crude Oil Carriers in Accordance with the New Anti-Pollution Regulations, 1975 Computer-Aided Design of Tanker Structures, 1975 Static and Dynamic Analysis of O�shore Pipelines during Installation, 1976 The Finite Element Method Used in a Fatigue Evaluation of Fixed O�shore Platforms. (Dr.Ing. Thesis) Analysis and Design of Cellular Structures. (Dr.Ing. Thesis) Finite Di�erence and Finite Element Methods Applied to Nonlinear Analysis of Plated Structures. (Dr.Ing. Thesis) Finite Element Collapse Analysis of Structural Members considering Imperfections and Stresses due to Fabrication. (Dr.Ing. Thesis) Analysis of Towline Forces in Ocean Towing Systems. (Dr.Ing. Thesis)
UR-80-06
Nils Sandsmark, MM
UR-80-09
Sverre Haver, MK
UR-81-15
Odland, Jonas
UR-82-17
Engesvik, Knut
UR-82-18 UR-83-30
Rye, Henrik Eide, Oddvar Inge
UR-83-33
Mo, Olav
UR-83-34 UR-84-37
Amdahl, Jørgen Mørch, Morten
UR-84-38
Soares, C. Guedes
UR-84-39 UR-84-40
Aarsnes, Jan V. Czujko, Jerzy
UR-85-46
Alf G. Engseth, MK
UR-86-47
Dengody Sheshappa, MP
UR-86-48
Vidar Aanesland, MH
UR-86-49
Heinz-Joachim Wessel, MK
UR-86-50
Jon Taby, MK
Analysis of Stationary and Transient Heat Conduction by the Use of the Finite Element Method. (Dr.Ing. Thesis) Analysis of Uncertainties Related to the Stochastic Modeling of Ocean Waves. (Dr.Ing. Thesis) On the Strength of Welded Ring Sti�ened Cylindrical Shells Primarily Subjected to Axial Compression Analysis of Uncertainties in the Fatigue Capacity of Welded Joints Ocean Wave Groups On Cumulative Fatigue Damage in Steel Welded Joints Stochastic Time Domain Analysis of Slender O�shore Structures Energy Absorption in Ship-Platform Impacts Motions and Mooring Forces of Semi Submersibles as Determined by Full-Scale Measurements and Theoretical Analysis Probabilistic Models for Load E�ects in Ship Structures Current Forces on Ships Collapse Analysis of Plates Subjected to Biaxial Compression and Lateral Load Finite Element Collapse Analysis of Tubular Steel O�shore Structures. (Dr.Ing. Thesis) A Computer Design Model for Optimizing Fishing Vessel Designs Based on Techno-Economic Analysis. (Dr.Ing. Thesis) A Theoretical and Numerical Study of Ship Wave Resistance. (Dr.Ing. Thesis) Fracture Mechanics Analysis of Crack Growth in Plate Girders. (Dr.Ing. Thesis) Ultimate and post-Ultimate Strength of Dented Tubular Members. (Dr.Ing. Thesis)
UR-86-51
Walter Lian, MH
UR-86-52
Bjørn Sortland, MH
UR-86-53
Kurt Strand, MM
UR-86-54
Arne Edvin Løken, MH
UR-86-55
Sigurd Falch, MH
UR-87-56
Arne Braathen, MH
UR-87-57
Bernt Leira, MK
UR-87-58
Magnus Småvik, MM
MTA-88-59 Bernt Arild Bremdal, MP MTA-88-60 Xu Jun, MK MTA-89-61 Gang Miao, MH MTA-89-62 Martin Greenhow, MH MTA-89-63 Chang Li, MH
A Numerical Study of Two-Dimensional Separated Flow past Blu� Bodies at Moderate KCNumbers. (Dr.Ing. Thesis) Force Measurements in Oscillating Flow on Ship Sections and Circular Cylinders in a U-Tube Water Tank. (Dr.Ing. Thesis) A System Dynamic Approach to OneDimensional Fluid Flow. (Dr.Ing. Thesis) Three Dimensional Second Order Hydrodynamic E�ects on Ocean Structures in Waves. (Dr.Ing. Thesis) A Numerical Study of Slamming of TwoDimensional Bodies. (Dr.Ing. Thesis) Application of a Vortex Tracking Method to the Prediction of Roll Damping of a Two-Dimension Floating Body. (Dr.Ing. Thesis) Gaussian Vector Processes for Reliability Analysis Involving Wave-Induced Load E�ects. (Dr.Ing. Thesis) Thermal Load and Process Characteristics in a Two-Stroke Diesel Engine with Thermal Barriers (in Norwegian). (Dr.Ing. Thesis) An Investigation of Marine Installation Processes � A Knowledge-Based Planning Approach. (Dr.Ing. Thesis) Non-Linear Dynamic Analysis of Space-Framed O�shore Structures. (Dr.Ing. Thesis) Hydrodynamic Forces and Dynamic Responses of Circular Cylinders in Wave Zones. (Dr.Ing. Thesis) Linear and Non-Linear Studies of Waves and Floating Bodies. Part I and Part II. (Dr.Techn. Thesis) Force Coe�cients of Spheres and Cubes in Oscillatory Flow with and without Current. (Dr.Ing. Thesis)
MTA-89-64 Hu Ying, MP MTA-89-65 Arild Jæger, MH MTA-89-66 Chan Siu Hung, MM MTA-89-67 Kim Wikstrøm, MP MTA-89-68 Jiao Guoyang, MK MTA-89-69 Arnt Olufsen, MK MTA-89-70 Wu Yu-Lin, MR MTA-90-71 Jan Roger Ho�, MH MTA-90-72 Rong Zhao, MH MTA-90-73 Atle Minsaas, MP MTA-90-74 Knut-Aril Farnes, MK MTA-90-75 Torbjørn Sotberg, MK MTA-90-76 Zeuthen, Ste�en, MP MTA-91-77 Haagensen, Sven, MM
A Study of Marketing and Design in Development of Marine Transport Systems. (Dr.Ing. Thesis) Seakeeping, Dynamic Stability and Performance of a Wedge Shaped Planing Hull. (Dr.Ing. Thesis) The Dynamic Characteristics of Tilting-Pad Bearings Analysis av Projekteringen for ett O�shore Projekt. (Licenciat-avhandling) Reliability Analysis of Crack Growth under Random Loading considering Model Updating. (Dr.Ing. Thesis) Uncertainty and Reliability Analysis of Fixed O�shore Structures. (Dr.Ing. Thesis) System Reliability Analyses of O�shore Structures Using Improved Truss and Beam Models. (Dr.Ing. Thesis) Three-Dimensional Green Function of a Vessel with Forward Speed in Waves. (Dr.Ing. Thesis) Slow-Drift Motions of a Moored TwoDimensional Body in Irregular Waves. (Dr.Ing. Thesis) Economical Risk Analysis. (Dr.Ing. Thesis) Long-Term Statistics of Response in Non-Linear Marine Structures. (Dr.Ing. Thesis) Application of Reliability Methods for Safety Assessment of Submarine Pipelines. (Dr.Ing. Thesis) SEAMAID. A Computational Model of the Design Process in a Constraint-Based Logic Programming Environment. An Example from the O�shore Domain. (Dr.Ing. Thesis) Fuel Dependant Cyclic Variability in a Spark Ignition Engine � An Optical Approach. (Dr.Ing. Thesis)
MTA-91-78 Løland, Geir, MH MTA-91-79 MTA-91-80 MTA-91-81 MTA-91-82 MTA-91-83 MTA-91-84 MTA-91-85 MTA-92-86 MTA-92-87 MTA-92-88 MTA-92-89 MTA-92-90 MTA-92-91
Current Forces on and Flow through Fish Farms. (Dr.Ing. Thesis) Hoen, Christopher, MK System Identi�cation of Structures Excited by Stochastic Load Processes. (Dr.Ing. Thesis) Haugen, Stein, MK Probabilistic Evaluation of Frequency of Collision between Ships and O�shore Platforms. (Dr.Ing. Thesis) Sødahl, Nils, MK Methods for Design and Analysis of Flexible Risers. (Dr.Ing. Thesis) Ormberg, Harald, MK Non-Linear Response Analysis of Floating Fish Farm Systems. (Dr.Ing. Thesis) Marley, Mark J., MK Time Variant Reliability under Fatigue Degradation. (Dr.Ing. Thesis) Krokstad, Jørgen R., MH Second-Order Loads in Multidirectional Seas. (Dr.Ing. Thesis) Molteberg, Gunnar A., MM The Application of System Identi�cation Techniques to Performance Monitoring of Four Stroke Turbocharged Diesel Engines. (Dr.Ing. Thesis) Mørch, Hans Jørgen Bjelke, MH Aspects of Hydrofoil Design with Emphasis on Hydrofoil Interaction in Calm Water. (Dr.Ing. Thesis) Chan Siu Hung, MM Nonlinear Analysis of Rotor Dynamic Instabilities in High-Speed Turbomachinery. (Dr.Ing. Thesis) Bessason, Bjarni, MK Assessment of Earthquake Loading and Response of Seismically Isolated Bridges. (Dr.Ing. Thesis) Langli, Geir, MP Improving Operational Safety through Exploitation of Design Knowledge � An Investigation of O�shore Platform Safety. (Dr.Ing. Thesis) Sævik, Svein, MK On Stresses and Fatigue in Flexible Pipes. (Dr.Ing. Thesis) Ask, Tor Ø., MM Ignition and Flame Growth in Lean GasAir Mixtures. An Experimental Study with a Schlieren System. (Dr.Ing. Thesis)
MTA-86-92 Hessen, Gunnar Peter, MK MTA-93-93 Steinebach, Christian, MM MTA-93-94 Dalane, Jan Inge, MK MTA-93-95 Steen, Sverre, MH MTA-93-96 Karunakaran, Daniel, MK MTA-93-97 Hagen, Arnulf, MP MTA-93-98 Nordrik, Rune, MM
MTA-94-99 Passano, Elizabeth, MK MTA-94-100 Kvålsvold, Jan, MH MTA-94-102 Bech, Sidsel M., MK MTA-95-103 Paulsen, Hallvard, MM MTA-95-104 Hovde, Geir Olav, MK MTA-95-105 Wang, Xiaozhi, MK MTA-95-106 Ulstein, Tore, MH
Fracture Mechanics Analysis of Sti�ened Tubular Members. (Dr.Ing. Thesis) Knowledge Based Systems for Diagnosis of Rotating Machinery. (Dr.Ing. Thesis) System Reliability in Design and Maintenance of Fixed O�shore Structures. (Dr.Ing. Thesis) Cobblestone E�ect on SES. (Dr.Ing. Thesis) Nonlinear Dynamic Response and Reliability Analysis of Drag-Dominated O�shore Platforms. (Dr.Ing. Thesis) The Framework of a Design Process Language. (Dr.Ing. Thesis) Investigation of Spark Ignition and Autoignition in Methane and Air Using Computational Fluid Dynamics and Chemical Reaction Kinetics. A Numerical Study of Ignition Processes in Internal Combustion Engines. (Dr.Ing. Thesis) E�cient Analysis of Nonlinear Slender Marine Structures. (Dr.Ing. Thesis) Hydroelastic Modelling of Wetdeck Slamming on Multihull Vessels. (Dr.Ing. Thesis) Experimental and Numerical Determination of Sti�ness and Strength of GRP/PVC Sandwich Structures. (Dr.Ing. Thesis) A Study of Transient Jet and Spray Using a Schlieren Method and Digital Image Processing. (Dr.Ing. Thesis) Fatigue and Overload Reliability of O�shore Structural Systems considering the E�ect of Inspection and Repair. (Dr.Ing. Thesis) Reliability Analysis of Production Ships with Emphasis on Load Combination and Ultimate Strength. (Dr.Ing. Thesis) Nonlinear E�ects of a Flexible Stern Seal Bag on Cobblestone Oscillations of an SES. (Dr.Ing. Thesis)
MTA-95-107 Solaas, Frøydis, MH MTA-95-108 Hellan, Øyvind, MK MTA-95-109 Hermundstad, Ole A., MK MTA-96-110 Bratland, Anne K., MH MTA-96-111 Herfjord, Kjell, MH MTA-96-112 Æsøy, Vilmar, MM MTA-96-113 Eknes, Monika L., MK MTA-96-114 Erikstad, Stein O., MP MTA-96-115 Pedersen, Egil, MH MTA-97-116 Moksnes, Paul O., MM MTA-97-117 Halse, Karl H., MK MTA-97-118 Igland, Ragnar T., MK MTA-97-119 Pedersen, Hans-P., MP MTA-98-120 Vikestad, Kyrre, MK
Analytical and Numerical Studies of Sloshing in Tanks. (Dr.Ing. Thesis) Nonlinear Pushover and Cyclic Analyses in Ultimate Limit State Design and Reassessment of Tubular Steel O�shore Structures. (Dr.Ing. Thesis) Theoretical and Experimental Hydroelastic Analysis of High Speed Vessels. (Dr.Ing. Thesis) Wave-Current Interaction E�ects on LargeVolume Bodies in Water of Finite Depth. (Dr.Ing. Thesis) A Study of Two-Dimensional Separated Flow by a Combination of the Finite Element Method and Navier-Stokes Equations. (Dr.Ing. Thesis) Hot Surface Assisted Compression Ignition in a Direct Injection Natural Gas Engine. (Dr.Ing. Thesis) Escalation Scenarios Initiated by Gas Explosions on O�shore Installations. (Dr.Ing. Thesis) A Decision Support Model for Preliminary Ship Design. (Dr.Ing. Thesis) A Nautical Study of Towed Marine Seismic Streamer Cable Con�gurations. (Dr.Ing. Thesis) Modelling Two-Phase Thermo-Fluid Systems Using Bond Graphs. (Dr.Ing. Thesis) On Vortex Shedding and Prediction of VortexInduced Vibrations of Circular Cylinders. (Dr.Ing. Thesis) Reliability Analysis of Pipelines during Laying considering Ultimate Strength under Combined Loads. (Dr.Ing. Thesis) Levende�skteknologi for Fiskefartøy. (Dr.Ing. Thesis) Multi-Frequency Response of a Cylinder Subjected to Vortex Shedding and Support Motions. (Dr.Ing. Thesis)
MTA-98-121 Azadi, Mohammad R. E., MK Analysis of Static and Dynamic Pile-Soil-Jacket Behaviour. (Dr.Ing. Thesis) MTA-98-122 Ulltang, Terje, MP A Communication Model for Product Information. (Dr.Ing. Thesis) MTA-98-123 Torbergsen, Erik, MM Impeller/Di�user Interaction Forces in Centrifugal Pumps. (Dr.Ing. Thesis) MTA-98-124 Hansen, Edmond, MH A Discrete Element Model to Study Marginal Ice Zone Dynamics and the Behaviour of Vessels Moored in Broken Ice. (Dr.Ing. Thesis) MTA-98-125 Videiro, Paulo M., MK Reliability Based Design of Marine Structures. (Dr.Ing. Thesis) MTA-99-126 Mainçon, Philippe, MK Fatigue Reliability of Long Welds Application to Titanium Risers. (Dr.Ing. Thesis) MTA-99-127 Haugen, Elin M., MH Hydroelastic Analysis of Slamming on Sti�ened Plates with Application to Catamaran Wetdecks. (Dr.Ing. Thesis) MTA-99-128 Langhelle, Nina K., MK Experimental Validation and Calibration of Nonlinear Finite Element Models for Use in Design of Aluminium Structures Exposed to Fire. (Dr.Ing. Thesis) MTA-99-129 Berstad, Are J., MK Calculation of Fatigue Damage in Ship Structures. (Dr.Ing. Thesis) MTA-99-130 Andersen, Trond M., MM Short Term Maintenance Planning. (Dr.Ing. Thesis) MTA-99-131 Tveiten, Bård Wathne, MK Fatigue Assessment of Welded Aluminium Ship Details. (Dr.Ing. Thesis) MTA-99-132 Søreide, Fredrik, MP Applications of Underwater Technology in Deep Water Archaeology. Principles and Practice. (Dr.Ing. Thesis) MTA-99-133 Tønnessen, Rune, MH A Finite Element Method Applied to Unsteady Viscous Flow around 2D Blunt Bodies with Sharp Corners. (Dr.Ing. Thesis) MTA-99-134 Elvekrok, Dag R., MP Engineering Integration in Field Development Projects in the Norwegian Oil and Gas Industry. The Supplier Management of Norne. (Dr.Ing. Thesis)
MTA-99-135 Fagerholt, Kjetil, MP MTA-99-136 MTA-2000137 MTA-2000138 MTA-2000139 MTA-2000140 MTA-2000141 MTA-2001142 MTA-2001143 MTA-2001144 MTA-2001145 MTA-2001146 MTA-2001147 MTA-2001148
Optimeringsbaserte Metoder for Ruteplanlegging innen Skipsfart. (Dr.Ing. Thesis) Bysveen, Marie, MM Visualization in Two Directions on a Dynamic Combustion Rig for Studies of Fuel Quality. (Dr.Ing. Thesis) Storteig, Eskild, MM Dynamic Characteristics and Leakage Performance of Liquid Annular Seals in Centrifugal Pumps. (Dr.Ing. Thesis) Sagli, Gro, MK Model Uncertainty and Simpli�ed Estimates of Long Term Extremes of Hull Girder Loads in Ships. (Dr.Ing. Thesis) Tronstad, Harald, MK Nonlinear Analysis and Design of Cable Net Structures like Fishing Gear Based on the Finite Element Method. (Dr.Ing. Thesis) Kroneberg, André, MP Innovation in Shipping by Using Scenarios. (Dr.Ing. Thesis) Haslum, Herbjørn Alf, MH Simpli�ed Methods Applied to Nonlinear Motion of Spar Platforms. (Dr.Ing. Thesis) Samdal, Ole Johan, MM Modelling of Degradation Mechanisms and Stressor Interaction on Static Mechanical Equipment Residual Lifetime. (Dr.Ing. Thesis) Baarholm, Rolf Jarle, MH Theoretical and Experimental Studies of Wave Impact underneath Decks of O�shore Platforms. (Dr.Ing. Thesis) Wang, Lihua, MK Probabilistic Analysis of Nonlinear WaveInduced Loads on Ships. (Dr.Ing. Thesis) Kristensen, Odd H. Holt, MK Ultimate Capacity of Aluminium Plates under Multiple Loads considering HAZ Properties. (Dr.Ing. Thesis) Greco, Marilena, MH A Two-Dimensional Study of Green-Water Loading. (Dr.Ing. Thesis) Heggelund, Svein E., MK Calculation of Global Design Loads and Load E�ects in Large High Speed Catamarans. (Dr.Ing. Thesis) Babalola, Olusegun T., MK Fatigue Strength of Titanium Risers � Defect Sensitivity. (Dr.Ing. Thesis)
MTA-2001- Mohammed, Abuu K., MK 149 MTA-2002150 MTA-2002151 MTA-2002152 MTA-2002153 MTA-2002154
Holmedal, Lars E., MH Rognebakke, Olav F., MH Lader, Pål Furset, MH Yang, Qinzheng, MH Melhus, Øyvin, MM
MTA-2002- Ronæss, Marit, MH 155 MTA-2002- Økland, Ole D., MK 156 MTA-2002- Ge, Chunhua, MK 157 MTA-2002- Byklum, Eirik, MK 158 IMT-2003-1 Chen, Haibo, MK IMT-2003-2 Skaugset, Kjetil Bjørn, MK IMT-2003-3 Chezhian, Muthu IMT-2003-4 Buhaug, Øyvind IMT-2003-5 Tregde, Vidar
Nonlinear Shell Finite Elements for Ultimate Strength and Collapse Analysis of Ship Structures. (Dr.Ing. Thesis) Wave-Current Interactions in the Vicinity of the Sea Bed. (Dr.Ing. Thesis) Sloshing in Rectangular Tanks and Interaction with Ship Motions. (Dr.Ing. Thesis) Geometry and Kinematics of Breaking Waves. (Dr.Ing. Thesis) Wash and Wave Resistance of Ships in Finite Water Depth. (Dr.Ing. Thesis) Utilization of VOC in Diesel Engines. Ignition and Combustion of VOC Released by Crude Oil Tankers. (Dr.Ing. Thesis) Wave Induced Motions of Two Ships Advancing on Parallel Course. (Dr.Ing. Thesis) Numerical and Experimental Investigation of Whipping in Twin Hull Vessels Exposed to Severe Wet Deck Slamming. (Dr.Ing. Thesis) Global Hydroelastic Response of Catamarans due to Wet Deck Slamming. (Dr.Ing. Thesis) Nonlinear Shell Finite Elements for Ultimate Strength and Collapse Analysis of Ship Structures. (Dr.Ing. Thesis) Probabilistic Evaluation of FPSO-Tanker Collision in Tandem O�oading Operation. (Dr.Ing. Thesis) On the Suppression of Vortex Induced Vibrations of Circular Cylinders by Radial Water Jets. (Dr.Ing. Thesis) Three-Dimensional Analysis of Slamming. (Dr.Ing. Thesis) Deposit Formation on Cylinder Liner Surfaces in Medium Speed Engines. (Dr.Ing. Thesis) Aspects of Ship Design: Optimization of Aft Hull with Inverse Geometry Design. (Dr.Ing. Thesis)
IMT-2003-6 Wist, Hanne Therese IMT-2004-7 Ransau, Samuel IMT-2004-8 Soma, Torkel IMT-2004-9 Ersdal, Svein IMT-2005-10 Brodtkorb, Per Andreas IMT-2005-11 Yttervik, Rune IMT-2005-12 Fredheim, Arne IMT-2005-13 Heggernes, Kjetil IMT-2005-14 Fouques, Sebastien IMT-2006-15 Holm, Håvard IMT-2006-16 Bjørheim, Lars G. IMT-2006-17 Hansson, Lisbeth IMT-2006-18 Zhu, Xinying IMT-2006-19 Reite, Karl Johan IMT-2006-20 Smogeli, Øyvind Notland
Statistical Properties of Successive Ocean Wave Parameters. (Dr.Ing. Thesis) Numerical Methods for Flows with Evolving Interfaces. (Dr.Ing. Thesis) Blue-Chip or sub-Standard. A Data Interrogation Approach of Identity Safety Characteristics of Shipping Organization. (Dr.Ing. Thesis) An Experimental Study of Hydrodynamic Forces on Cylinders and Cables in near Axial Flow. (Dr.Ing. Thesis) The Probability of Occurrence of Dangerous Wave Situations at Sea. (Dr.Ing. Thesis) Ocean Current Variability in Relation to O�shore Engineering. (Dr.Ing. Thesis) Current Forces on Net-Structures. (Dr.Ing. Thesis) Flow around Marine Structures. (Dr.Ing. Thesis) Lagrangian Modelling of Ocean Surface Waves and Synthetic Aperture Radar Wave Measurements. (Dr.Ing. Thesis) Numerical Calculation of Viscous Free Surface Flow around Marine Structures. (Dr.Ing. Thesis) Failure Assessment of Long through Thickness Fatigue Cracks in Ship Hulls. (Dr.Ing. Thesis) Safety Management for Prevention of Occupational Accidents. (Dr.Ing. Thesis) Application of the CIP Method to Strongly Nonlinear Wave-Body Interaction Problems. (Dr.Ing. Thesis) Modelling and Control of Trawl Systems. (Dr.Ing. Thesis) Control of Marine Propellers. From Normal to Extreme Conditions. (Dr.Ing. Thesis)
IMT-2007-21 Storhaug, Gaute IMT-2007-22 Sun, Hui IMT-2007-23 Rustad, Anne Marthine IMT-2007-24 Johansen, Vegar IMT-2007-25 Wroldsen, Anders Sunde IMT-2007-26 Aronsen, Kristo�er Høye IMT-2007-27 Gao, Zhen IMT-2007-28 Thorstensen, Tom Anders IMT-2008-29 Berntsen, Per Ivar B. IMT-2008-30 Ye, Naiquan IMT-2008-31 Radan, Damir IMT-2008-32 Thomassen, Paul IMT-2008-33 Pákozdi, Csaba IMT-2008-34 Grytøyr, Guttorm
Experimental Investigation of Wave Induced Vibrations and their E�ect on the Fatigue Loading of Ships. (Dr.Ing. Thesis) A Boundary Element Method Applied to Strongly Nonlinear Wave-Body Interaction Problems. (PhD Thesis, CeSOS) Modelling and Control of Top Tensioned Risers. (PhD Thesis, CeSOS) Modelling Flexible Slender System for RealTime Simulations and Control Applications Modelling and Control of Tensegrity Structures. (PhD Thesis, CeSOS) An Experimental Investigation of in-Line and Combined in-Line and Cross Flow Vortex Induced Vibrations. (Dr.Avhandling, IMT) Stochastic Response Analysis of Mooring Systems with Emphasis on Frequency-Domain Analysis of Fatigue due to Wide-Band Response Processes (PhD Thesis, CeSOS) Lifetime Pro�t Modelling of Ageing Systems Utilizing Information about Technical Condition. (Dr.Ing. Thesis, IMT) Structural Reliability Based Position Mooring. (PhD Thesis, IMT) Fatigue Assessment of Aluminium Welded BoxSti�ener Joints in Ships. (Dr.Ing. Thesis, IMT) Integrated Control of Marine Electrical Power Systems. (PhD Thesis, IMT) Methods for Dynamic Response Analysis and Fatigue Life Estimation of Floating Fish Cages. (Dr.Ing. Thesis, IMT) A Smoothed Particle Hydrodynamics Study of Two-Dimensional Nonlinear Sloshing in Rectangular Tanks. (Dr.Ing. Thesis, IMT/CeSOS) A Higher-Order Boundary Element Method and Applications to Marine Hydrodynamics. (Dr.Ing. Thesis, IMT)
IMT-2008-35 Drummen, Ingo IMT-2008-36 Skejic, Renato IMT-2008-37 Harlem, Alf IMT-2008-38 Alsos, Hagbart S. IMT-2008-39 Graczyk, Mateusz IMT-2008-40 Taghipour, Reza IMT-2008-41 Ruth, Eivind IMT-2008-42 Nystad, Bent Helge IMT-2008-43 Soni, Prashant Kumar IMT-2009-43 Amlashi, Hadi K. K. IMT-2009-44 Pedersen, Tom Arne IMT-2009-45 Kristiansen, Trygve IMT-2009-46 Ong, Muk Chen
Experimental and Numerical Investigation of Nonlinear Wave-Induced Load E�ects in Containerships considering Hydroelasticity. (PhD Thesis, CeSOS) Maneuvering and Seakeeping of a Single Ship and of Two Ships in Interaction. (PhD Thesis, CeSOS) An Age-Based Replacement Model for Repairable Systems with Attention to High-Speed Marine Diesel Engines. (PhD Thesis, IMT) Ship Grounding. Analysis of Ductile Fracture, Bottom Damage and Hull Girder Response. (PhD Thesis, IMT) Experimental Investigation of Sloshing Loading and Load E�ects in Membrane LNG Tanks Subjected to Random Excitation. (PhD Thesis, CeSOS) E�cient Prediction of Dynamic Response for Flexible and Multi-Body Marine Structures. (PhD Thesis, CeSOS) Propulsion Control and Thrust Allocation on Marine Vessels. (PhD Thesis, CeSOS) Technical Condition Indexes and Remaining Useful Life of Aggregated Systems. PhD Thesis, IMT Hydrodynamic Coe�cients for Vortex Induced Vibrations of Flexible Beams. PhD Thesis, CeSOS Ultimate Strength and Reliability-Based Design of Ship Hulls with Emphasis on Combined Global and Local Loads. PhD Thesis, IMT Bond Graph Modelling of Marine Power Systems. PhD Thesis, IMT Two-Dimensional Numerical and Experimental Studies of Piston-Mode Resonance. PhD Thesis, CeSOS Applications of a Standard High Reynolds Number Model and a Stochastic Scour Prediction Model for Marine Structures. PhD Thesis, IMT
IMT-2009-47 Hong, Lin IMT-2009-48 Koushan, Kamran IMT-2009-49 Korsvik, Jarl Eirik IMT-2009-50 Lee, Jihoon IMT-2009-51 Vestbøstad, Tone Gran IMT-2009-52 Bruun, Kristine IMT-2009-53 Holstad, Anders IMT-2009-54 Ayala-Uraga, Efren IMT-2009-55 Kong, Xiangjun IMT-2010-56 Kristiansen, David IMT-2010-57 Ludvigsen, Martin IMT-2010-58 Hals, Jørgen IMT-2010-59 Shu, Zhi IMT-2010-60 Shao, Yanlin IMT-2010-61 Califano, Andrea
Simpli�ed Analysis and Design of Ships Subjected to Collision and Grounding. PhD Thesis, IMT Vortex Induced Vibrations of Free Span Pipelines. PhD Thesis, IMT Heuristic Methods for Ship Routing and Scheduling. PhD Thesis, IMT Experimental Investigation and Numerical in Analyzing the Ocean Current Displacement of Longlines. PhD Thesis, IMT A Numerical Study of Wave-in-Deck Impact Using a Two-Dimensional Constrained Interpolation Pro�le Method. PhD Thesis, CeSOS Bond Graph Modelling of Fuel Cells for Marine Power Plants. PhD Thesis, IMT Numerical Investigation of Turbulence in a Skewed Three-Dimensional Channel Flow. PhD Thesis, IMT Reliability-Based Assessment of Deteriorating Ship-Shaped O�shore Structures. PhD Thesis, IMT A Numerical Study of a Damaged Ship in Beam Sea Waves. PhD Thesis, IMT/CeSOS Wave Induced E�ects on Floaters of Aquaculture Plants. PhD Thesis, CeSOS An ROV-Toolbox for Optical and Acoustic Scienti�c Seabed Investigation. PhD Thesis, IMT Modelling and Phase Control of Wave-Energy Converters. PhD Thesis, CeSOS Uncertainty Assessment of Wave Loads and Ultimate Strength of Tankers and Bulk Carriers in a Reliability Framework. PhD Thesis, IMT/CeSOS Numerical Potential-Flow Studies on WeaklyNonlinear Wave-Body Interactions with/without Small Forward Speed. PhD Thesis, CeSOS Dynamic Loads on Marine Propellers due to Intermittent Ventilation. PhD Thesis, IMT
IMT-2010-62 El Khoury, George
Numerical Simulations of Massively Separated Turbulent Flows. PhD Thesis, IMT IMT-2010-63 Seim, Knut Sponheim Mixing Process in Dense Over�ows with Emphasis on the Faroe Bank Channel Over�ow. PhD Thesis, IMT IMT-2010-64 Jia, Huirong Structural Analysis of Intact and Damaged Ships in a Collision Risk Analysis Perspective. PhD Thesis, CeSOS IMT-2010-65 Jiao, Linlin Wave-Induced E�ects on a Pontoon-Type Very Large Floating Structure (VLFS). PhD Thesis, CeSOS IMT-2010-66 Abrahamsen, Bjørn Christian Sloshing Induced Tank Roof with Entrapped Air Pocket. PhD Thesis, CeSOS IMT-2011-67 Karimirad, Madjid Stochastic Dynamic Response Analysis of SparType Wind Turbines with Catenary or Taut Mooring Systems. PhD Thesis, CeSOS IMT-2011-68 Erlend Meland Condition Monitoring of Safety Critical Valves. PhD Thesis, IMT IMT-2011-69 Yang, Limin Stochastic Dynamic System Analysis of Wave Energy Converter with Hydraulic Power Takeo�, with Particular Reference to Wear Damage Analysis. PhD Thesis, CeSOS IMT-2011-70 Visscher, Jan Application of Particle Image Velocimetry on Turbulent Marine Flows. PhD Thesis, IMT IMT-2011-71 Su, Biao Numerical Predictions of Global and Local Ice Loads on Ships. PhD Thesis, CeSOS IMT-2011-72 Liu, Zhenhui Analytical and Numerical Analysis of Iceberg Collision with Ship Structures. PhD Thesis, IMT IMT-2011-73 Aarsæther, Karl Gunnar Modeling and Analysis of Ship Tra�c by Observation and Numerical Simulation. PhD Thesis, IMT IMT-2011-74 Wu, Jie Hydrodynamic Force Identi�cation from Stochastic Vortex Induced Vibration Experiments with Slender Beams. PhD Thesis, IMT IMT-2011-75 Amini, Hamid Azimuth Propulsors in o�-Design Conditions. PhD Thesis, IMT
IMT-2011-76 Nguyen, Tan-Hoi IMT-2011-77 Tavakoli, Mohammad T. IMT-2011-78 Guo, Bingjie IMT-2011-79 Chen, Qiaofeng IMT-2012-80 Kota, Ravikiran S. IMT-2012-81 Sten, Ronny IMT-2012-82 Berle, Øyvind IMT-2012-83 Fang, Shaoji IMT-2012-84 You, Jikun IMT-2012-85 Xiang, Xu IMT-2012-86 Dong, Wenbin IMT-2012-87 Zhu, Suji IMT-2012-88 Zhou, Li IMT-2012-90 Ushakov, Sergey IMT-2013-1 Yin, Decao
Toward a System of Real-Time Prediction and Monitoring of Bottom Damage Conditions during Ship Grounding. PhD Thesis, IMT Assessment of Oil Spill in Ship Collision and Grounding. PhD Thesis, IMT Numerical and Experimental Investigation of Added Resistance in Waves. PhD Thesis, IMT Ultimate Strength of Aluminium Panels considering HAZ E�ects, IMT Wave Loads on Decks of O�shore Structures in Random Seas, CeSOS Dynamic Simulation of Deep Water Drilling Risers with Heave Compensating System, IMT Risk and Resilience in Global Maritime Supply Chains, IMT Fault Tolerant Position Mooring Control Based on Structural Reliability, CeSOS Numerical Studies on Wave Forces and Moored Ship Motions in Intermediate and Shallow Water, CeSOS Maneuvering of Two Interacting Ships in Waves, CeSOS Time-Domain Fatigue Response and Reliability Analysis of O�shore Wind Turbines with Emphasis on Welded Tubular Joints and Gear Components, CeSOS Investigation of Wave-Induced Nonlinear Load E�ects in Open Ships considering Hull Girder Vibrations in Bending and Torsion, CeSOS Numerical and Experimental Investigation of Station-Keeping in Level Ice, CeSOS Particulate Matter Emission Characteristics from Diesel Engines Operating on Conventional and Alternative Marine Fuels, IMT Experimental and Numerical Analysis of Combined in-Line and Cross-Flow Vortex Induced Vibrations, CeSOS
IMT-2013-2 Kurniawan, Adi
Modelling and Geometry Optimisation of Wave Energy Converters, CeSOS IMT-2013-3 Al Ryati, Nabil A. M. Technical Condition Indexes for Auxiliary Marine Diesel Engines, IMT IMT-2013-4 Firoozkoohi, Reza Experimental, Numerical and Analytical Investigation of the E�ect of Screens on Sloshing, CeSOS IMT-2013-5 Ommani, Babak Potential-Flow Predictions of a SemiDisplacement Vessel including Applications to Calm Water Broaching, CeSOS IMT-2013-6 Xing, Yihan Modelling and Analysis of the Gearbox in a Floating Spar-Type Wind Turbine, CeSOS IMT-7-2013 Balland, Océane Optimization Models for Reducing Air Emissions from Ships, IMT IMT-8-2013 Yang, Dan Transitional Wake Flow behind an Inclined Flat Plate � Computation and Analysis, IMT IMT-9-2013 Abdillah, Suyuthi Prediction of Extreme Loads and Fatigue Damage for a Ship Hull due to Ice Action, IMT IMT-10-2013 Ramírez, Pedro Agustín Pérez Ageing Management and Life Extension of Technical Systems � Concepts and Methods Applied to Oil and Gas Facilities, IMT IMT-11-2013 Chuang, Zhenju Experimental and Numerical Investigation of Speed Loss due to Seakeeping and Maneuvering, IMT IMT-12-2013 Etemaddar, Mahmoud Load and Response Analysis of Wind Turbines under Atmospheric Icing and Controller System Faults with Emphasis on Spar Type Floating Wind Turbines, IMT IMT-13-2013 Lindstad, Haakon Strategies and Measures for Reducing Maritime CO Emissons, IMT IMT-14-2013 Haris, Sabril Damage Interaction Analysis of Ship Collisions, IMT IMT-15-2013 Shainee, Mohamed Conceptual Design, Numerical and Experimental Investigation of a SPM Cage Concept for O�shore Mariculture, IMT IMT-16-2013 Gansel, Lars Flow past Porous Cylinders and E�ects of Biofouling and Fish Behavior on the Flow in and around Atlantic Salmon Net Cages, IMT 2
IMT-17-2013 Gaspar, Henrique M. IMT-18-2013 Thys, Maxime IMT-19-2013 Aglen, Ida IMT-1-2014 Song, An IMT-2-2014 Rogne, Øyvind Ygre IMT-3-2014 Dai, Lijuan IMT-4-2014 Bachynski, Erin Elizabeth IMT-5-2014 Wang, Jingbo IMT-6-2014 Kim, Ekaterina IMT-7-2014 Tan, Xiang IMT-8-2014 Muliawan, Made Jaya IMT-9-2014 Jiang, Zhiyu IMT-10-2014 Dukan, Fredrik IMT-11-2014 Grimsmo, Nils I. IMT-12-2014 Kvittem, Marit I.
Handling Aspects of Complexity in Conceptual Ship Design, IMT Theoretical and Experimental Investigation of a Free Running Fishing Vessel at Small Frequency of Encounter, CeSOS VIV in Free Spanning Pipelines, CeSOS Theoretical and Experimental Studies of Wave Di�raction and Radiation Loads on a Horizontally Submerged Perforated Plate, CeSOS Numerical and Experimental Investigation of a Hinged 5-Body Wave Energy Converter, CeSOS Safe and E�cient Operation and Maintenance of O�shore Wind Farms, IMT Design and Dynamic Analysis of Tension Leg Platform Wind Turbines, CeSOS Water Entry of Freefall Wedged � Wedge motions and Cavity Dynamics, CeSOS Experimental and Numerical Studies Related to the Coupled Behavior of Ice Mass and Steel Structures during Accidental Collisions, IMT Numerical Investigation of Ship's ContinuousMode Icebreaking in Level Ice, CeSOS Design and Analysis of Combined Floating Wave and Wind Power Facilities, with Emphasis on Extreme Load E�ects of the Mooring System, CeSOS Long-Term Response Analysis of Wind Turbines with an Emphasis on Fault and Shutdown Conditions, IMT ROV Motion Control Systems, IMT Dynamic Simulations of Hydraulic Cylinder for Heave Compensation of Deep Water Drilling Risers, IMT Modelling and Response Analysis for Fatigue Design of a Semisubmersible Wind Turbine, CeSOS
IMT-13-2014 Akhtar, Juned
The E�ects of Human Fatigue on Risk at Sea, IMT IMT-14-2014 Syahroni, Nur Fatigue Assessment of Welded Joints Taking into Account E�ects of Residual Stress, IMT IMT-1-2015 Bøckmann, Eirik Wave Propulsion of Ships, IMT IMT-2-2015 Wang, Kai Modelling and Dynamic Analysis of a SemiSubmersible Floating Vertical Axis Wind Turbine, CeSOS IMT-3-2015 Fredriksen, Arnt Gunvald Numerical Studies of Viscous Flow around Blu� Bodies IMT-4-2015 José Patrício Gallardo Canabes A Numerical and Experimental Study of a TwoDimensional Body with Moonpool in Waves and Current IMT-5-2015 Vegard Longva Formulation and Application of Finite Element Techniques for Slender Marine Structures Subjected to Contact Interactions IMT-6-2015 Jacobus B. De Vaal Aerodynamic Modelling of Floating Wind Turbines IMT-7-2015 Fachri Nasution Fatigue Performance of Copper Power Conductors IMT-8-2015 Oleh I. Karpa Development of Bivariate Extreme Value Distributions for Applications in Marine Technology IMT-9-2015 Daniel de Almeida Fernandes An Output Feedback Motion Control System for ROVs � Guidance, Navigation, and Control