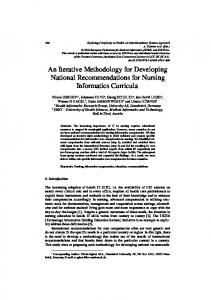
Qualitative Market Research: An International Journal An RQDA-based constructivist methodology for qualitative research Yanto Chandra Liang Shang
Downloaded by CITY UNIVERSITY OF HONG KONG, Doctor Yanto Chandra At 17:42 09 January 2017 (PT)
Article information: To cite this document: Yanto Chandra Liang Shang , (2017),"An RQDA-based constructivist methodology for qualitative research ", Qualitative Market Research: An International Journal, Vol. 20 Iss 1 pp. 90 - 112 Permanent link to this document: http://dx.doi.org/10.1108/QMR-02-2016-0014 Downloaded on: 09 January 2017, At: 17:42 (PT) References: this document contains references to 132 other documents. To copy this document:
[email protected] The fulltext of this document has been downloaded 2 times since 2017*
Access to this document was granted through an Emerald subscription provided by emeraldsrm:364597 []
For Authors If you would like to write for this, or any other Emerald publication, then please use our Emerald for Authors service information about how to choose which publication to write for and submission guidelines are available for all. Please visit www.emeraldinsight.com/authors for more information.
About Emerald www.emeraldinsight.com Emerald is a global publisher linking research and practice to the benefit of society. The company manages a portfolio of more than 290 journals and over 2,350 books and book series volumes, as well as providing an extensive range of online products and additional customer resources and services. Emerald is both COUNTER 4 and TRANSFER compliant. The organization is a partner of the Committee on Publication Ethics (COPE) and also works with Portico and the LOCKSS initiative for digital archive preservation. *Related content and download information correct at time of download.
The current issue and full text archive of this journal is available on Emerald Insight at: www.emeraldinsight.com/1352-2752.htm
Downloaded by CITY UNIVERSITY OF HONG KONG, Doctor Yanto Chandra At 17:42 09 January 2017 (PT)
QMR 20,1
An RQDA-based constructivist methodology for qualitative research
90
Yanto Chandra and Liang Shang Department of Public Policy, City University of Hong Kong, Hong Kong, Hong Kong
Received 11 February 2016 Revised 8 September 2016 21 November 2016 Accepted 21 November 2016
Abstract Purpose – Qualitative research suffers from “contestation” and a lack of “boilerplate” problems to assessing and presenting qualitative data, which have hampered its development and the broader acceptance of qualitative research. This paper aims to address this gap by marrying the constructivist methodology and RQDA, a relatively new open-source computer-assisted qualitative data analysis (CAQDAS)-based R extension and demonstrate how the software can increase the rigor, transparency and validity of qualitative research. Design/methodology/approach – This paper highlights the constructivist approach as an important paradigm in qualitative research and demonstrates how it can be operationalized and enhanced using RQDA. It provides a technical and methodological review of RQDA, along with its main strengths and weaknesses, in relation with two popular CAQDAS tools, ATLAS.ti and NVivo. Using samples of customer-generated e-complaints and e-praises in the electronics/computer sector, this paper demonstrates the development of a process model of customer e-complaint rhetoric. Findings – This study offers step-by-step instructions for installing and using RQDA for data coding, aggregation, plotting and theory building. It emphasizes the importance of techniques for sharing coding outputs among researchers and journal gatekeepers to better disseminate and share research findings. It also describes the authors’ use of RQDA in classrooms of undergraduates and graduate students. Research limitations/implications – This paper addresses the “contestation” and “boilerplate” gaps, offering practical, step-by-step instructions to operationalize and enhance the constructivist approach using the RQDA-based approach. This opens new opportunities for existing R users to “cross over” to analyzing textual data as well as for computer-savvy scholars, analysts and research students in academia and industry who wish to transition to CAQDAS-based qualitative research because RQDA is free and can leverage the strengths of the R computing platform. Originality/value – This study offers the first published review and demonstration of the RQDA-based constructivist methodology that provide the processes needed to enhance the rigor, transparency and validity of qualitative research. It demonstrates the systematic development of a data structure and a process model of customer e-complaint rhetoric using RQDA. Keywords Qualitative research, CAQDAS, Constructivist, RQDA Paper type Technical paper
Qualitative Market Research: An International Journal Vol. 20 No. 1, 2017 pp. 90-112 © Emerald Publishing Limited 1352-2752 DOI 10.1108/QMR-02-2016-0014
Introduction Qualitative research is one of the most popular methods used in the business and social sciences journals. It is a diverse collection of tools and approaches that deal with predominantly “non-numerical” data and span from interpretive textual analysis (Thompson, 1997), grounded theory (Eisenhardt, 1989a, 1989b), case study (Yin, 2003), discourse analysis (Paulus and Lester, 2016), ethnography (Arnould and Wallendorf, 1994), to netnography (Kozinets, 2002). The styles of theorizing (reasoning and writing) in the qualitative research enterprise are also diverse, from the so-called thick description, pattern description, narration (Cornelissen, 2016), process theorizing (Langley, 1999; Giesler and
Downloaded by CITY UNIVERSITY OF HONG KONG, Doctor Yanto Chandra At 17:42 09 January 2017 (PT)
Thompson, 2016) and complex theorizing (Tsoukas, 2016). Scholars also agree that there are different logics and model of writing qualitative papers (Coviello, 2014; Hunt, 1991; Goulding, 2005; Langley and Abdallah, 2011). The methodological diversity of the qualitative research enterprise is a two-edge sword (Hunt, 1991; Cornelissen, 2016); it leads scholars to the paths of discovery that push the frontiers of scholarship, while at the same time, it often creates confusion as to what qualifies or characterizes a high-quality qualitative research. Given the diversity of the nature of qualitative research, we argue that qualitative research enterprise may suffer from a “contested concept” problem (Choi and Majumdar, 2014; Gallie, 1955) – just like a work of art where there is no agreement on what constitutes a “work of art” (Gallie, 1956, p. 167) – which makes it difficult for stakeholders to judge qualitative research. We argue that this “work of art” problem is hampering the legitimacy of the qualitative research enterprise as a whole and may explain why qualitative research remains the minority in top-tier journals in the business fields (Hanson and Grimmer, 2007; Pratt, 2008; Short et al., 2009). This echoes scholars’ critiques that qualitative research is lacking in rigor and validity. As Pratt argued, qualitative research is often challenging because of “no accepted boilerplate” (Pratt, 2009, p. 856) in helping readers or gatekeepers understand how a researcher assesses and presents qualitative data. Assume that a qualitative scholar found the evidence of a “talking dog” that constitutes a groundbreaking concept and that this makes a major contribution worthy of a Noble Prize. The challenge is how the author can demonstrate and persuade readers of the existence of a “talking dog”. Qualitative scholars trying to submit their work to the best journals in their field are often confronted by this type of problem. Our extensive reviews[1] of top-tier and important journals in marketing reveal that although qualitative scholars have used both the constructivist (theory building and exploration; Belk et al., 2003; Gebhardt et al., 2006) and positivist (theory testing and refinement; Grayson and Shulman, 2000) qualitative research approaches, theory-building remains the more popular approach in qualitative research, as it helps scholars discover new concepts, mechanisms, processes and turning them into models or theories to describe and explain social reality. Although theory-building characterizes the bulk of qualitative papers in marketing, there is a lack of review papers that provide “how to guide” in doing rigorous, transparent and credible steps in building theory from scratch and in a step-by-step manner. Importantly, the constructivist approach was used “almost like an art”, without a step-by-step demonstration of how the qualitative data were turned into a model, mechanism or theory (Malshe, 2009; Malshe et al., 2013; Reficco and Jaén, 2015). The majority of qualitative scholars preferred “manual analysis” approach (Basit, 2003; Commuri, 2009; Coviello, 2014), and only a minority used computing technologies (i.e. software) to facilitate a rigorous and transparent data analysis (i.e. NVivo software, see Coviello and Joseph, 2012; Homburg et al., 2014). Arguably, the major differences in the conduct of research activities in the twenty-first century as opposed to those in the previous century are the advancement of computing technologies, particularly the widespread diffusion of open source software (Daniel and Stewart, 2016; Phipps, 2015), and the prevalence of technology savvy scholars and students (Weller, 2011) and the greater demand for transparency in publishing due to rising cases of scientific misconduct (Altman and Moher, 2013; Corbyn, 2012). These trends are irreversible and present new opportunities for methods-oriented scholars to experiment with new (and hopefully better) ways of doing qualitative research. Technology, particularly software, is a powerful tool to facilitate qualitative research and can enhance (and impede) the transparency in doing qualitative research (i.e. researcher agency; Woods et al., 2015a) through data sharing, articulation of decisions made during data analysis and presentation.
Methodology for qualitative research
91
QMR 20,1
Downloaded by CITY UNIVERSITY OF HONG KONG, Doctor Yanto Chandra At 17:42 09 January 2017 (PT)
92
The increasing retraction of papers in top tier journals in the field of sciences (Fang et al., 2012; Gewin, 2014) is a serious concern and calls for more transparency and ethically driven qualitative research scholarship including those in the social sciences (Karabag and Berggren, 2016). In this paper, we seek to enhance the legitimacy of and address the “contestation” and “transparency” problems in qualitative research enterprise by proposing generally accepted qualitative research techniques as a way of building a common language and understanding about the nature and process of doing qualitative research. We do not advocate a standardized approach to doing qualitative research but rather propose a set of processes that can help qualitative (and quantitative) scholars appreciate and take into account the issues of rigor, transparency and credibility as important traits of qualitative research (Sinkovics and Alfoldi, 2012; Woods et al., 2015a). Specifically, we seek to make methodological contributions to the qualitative research enterprise by fusing the widely accepted constructivist paradigm and a new open source computer-assisted qualitative data analysis (CAQDAS) software to enhance the rigor, transparency and credibility of qualitative research. Our methodological demonstration by combining constructivism and a new open source CAQDAS to offer “rigor and systematization” may resonate with a critical realist approach to qualitative research (Easton, 2010; Sobh and Perry, 2006; Tsang, 2014). In doing so, we first conducted a review of the major paradigms in qualitative research and their key ontological and epistemological differences. We then discussed CAQDAS literature and focused on two main (proprietary) CAQDAS software and how they fared with RQDA, the new open source CAQDAS of interest. Next, we reviewed the strengths and limitations of RQDA and articulated a step-by-step constructivist research approach and how to operationalize it using RQDA. We demonstrated how we conducted data collection and analysis and, finally, how we translated the findings into a process model. We concluded this article with our reflection on the benefits and potential benefits of our RQDA-enabled constructivist qualitative research, its limitations and future research opportunities. To the best of our knowledge, this is the first paper that provides a “how to” guide in conducting an RQDA-enabled constructivist approach in doing qualitative research. Major paradigms in qualitative research methodology Qualitative research is a challenging research enterprise, which is particularly true with respect to scholars aiming to publish in top-tier journals, as there is often “no accepted boilerplate” (Pratt, 2009, p. 856) in terms of the rules (investigation processes), formats and norms that are involved. Although some qualitative scholars prefer “no boilerplate” in the conduct of qualitative research (Friese, 2011; Cornelissen, 2016), there are several paradigms that have gained legitimacy in recent years. Perhaps the most identifiable ones are constructivism and positivism (Table I). Constructivism – which views social reality as subjective and co-constructed through human experience (Peters et al., 2013; Ramoglou and Tsang, 2015) – emphasizes the role of qualitative methods as a means to interpret, explore and discover new concepts, constructs, theories and frameworks or models – and tends to promote a “flexible” way in how qualitative research is conducted (Coviello, 2014). Positivism – which views social reality as objective and “exist out there” for verification (Hunt, 1994; Peters et al., 2013) – emphasizes qualitative methods as a way of validating constructs, propositions or hypotheses using qualitative and quantitative data (Dubé and Paré, 2003; Langley and Abdallah, 2011) – and therefore promotes “rigor and systemization” in how qualitative research is performed; it is inspired by the dominant hypothetico-deductive paradigm in the social sciences. The former
Qualitative (e.g. interviews, observations, secondary data) and quantitative (e.g. questionnaire) data Interview protocol is akin to a measurement device to capture reality systematically
Types of data collected
Primarily use manual data analysis (i.e. using pens/pencils, paper, highlighter, folders, etc.) A model of fast decision-making (Eisenhardt, 1989); possessions as irreplaceable or replaceable (Grayson and Shulman, 2000)
Approach in data analysis
Key papers
Eisenhardt (1989a, 1989b), Eisenhardt and Graebner (2007)
Start with propositions, then tables of evidence (with short quotes, some numerical data, other constructs observed), finally a “box and arrows” model
Style of the presentation of research findings
Examples of important findings
Start with within-case and cross-case analysis; develop tabulation of evidence to refine constructs; end with testable propositions
Analytical process and final product
Flexibility of interview protocol
Preference for multiple cases (6 to 10 cases) to increase variations on dependent variable (e.g. firm performance)
Number of cases
Sampling rationale
Theoretical sampling that seeks maximum variation (e.g. polar types sampling of high vs low performing firms); representativeness is important
Empiricism (reality exists “out there” waiting to be captured, described and explained) Yin’s (2003) case-study-as-experiment logic; one case is (dis)confirmed by other cases to reach theoretical saturation Theory testing, refinement, replication, elimination of alternative explanation Both are needed at the outset of the study
Philosophical underpinnings of social reality Methodological foundation
Purpose of use The role of research question; a priori constructs
The positivist approach
Aspects of comparison Constructivism (reality is socially constructed and interpreted) Strauss and Corbin’s (1990) grounded theory by open and axial coding Theory building, exploration, discovery Research question is needed at the outset of the study; consult but not dictated by a priori constructs or theory Revelatory and richness driven sampling (e.g. critical case to test a theory; extreme or revelatory case that offers new insights); representativeness is not crucial Single case and multiple cases (up to 4 cases); not seeking variations but explaining rich, interesting cases Primarily qualitative (e.g. interviews collected at multiple rounds) data Preserve the flexibility in adjusting interview protocol; backtrack to informants based on insights in subsequent interviews Start by developing data structure (aggregating first-order concept, second-order categories, aggregate dimensions); leading to a process model and new concept development No fixed style. But tend to start with the data structure and process model (consisting concepts and their relationships), then present the power quotes in “data tables” Mostly use manual data analysis, but a few uses CAQDAS (Nag et al., 2007) The discovery of “sense giving” concept; “identity ambiguity”, “transitional identity” concepts (Gioia et al. 2013) Gioia et al. (2013), Nag et al. (2007); Vaccaro and Palazzo (2015)
The constructivist approach
Downloaded by CITY UNIVERSITY OF HONG KONG, Doctor Yanto Chandra At 17:42 09 January 2017 (PT)
Methodology for qualitative research
93
Table I. A comparison of positivist and constructivist approach in qualitative research
QMR 20,1
Downloaded by CITY UNIVERSITY OF HONG KONG, Doctor Yanto Chandra At 17:42 09 January 2017 (PT)
94
is often used for theory-building and discovery research, while the latter for theory-testing and refinement research. Some scholars argue that the two might be complementary (Hunt, 1991; Lin, 1998; Sobh and Perry, 2006) because the social reality is partly real, partly co-constructed and interpreted and hence structured in various levels; thus, both camps can be combined to better study the social reality. This gives rise to what some called critical realism (Easton, 2010; Sobh and Perry, 2006; Tsang, 2014). As shown in Table I, where we compared the two paradigms, the positivism and constructivism approaches differ in 11 dimensions (for the sake of parsimony, we only discussed the two polar types and did not discuss critical realism). The positivist approach primarily focuses on theory/construct validation, refinement or disconfirmation, typically involving one or more dependent variables (e.g. firm performance) and using multiple cases (usually the more the better). For example, in their study of the speed of decision-making in high velocity environment, Eisenhardt (1989a) used qualitative and quantitative data to provide numerical estimate of the speed of decision-making (i.e. using decision durations as data, number of meetings and classification of active versus passive conflict resolution to see variations among cases) and used very limited informants quotes in the data presentation. In another example, Grayson and Shulman (2000) used interview data by transforming the data into categories (the presence or absence) of constructs which were then tested quantitatively using chi-square analysis. In both examples, qualitative data and method were used in a quantitative sense. In contrast, the constructivist approach focuses on exploring and discovering new concepts, mechanisms or processes and ultimately building a process model or theory by using open and axial coding (Strauss and Corbin, 1990) of a small number of cases (e.g. from 1 to 4). As an example, Gebhardt et al. (2006) studied how two organizations changed to become more market oriented and developed a four-stage process of creating market orientation: initiation, reconstruction, institutionalization and maintenance. What these scholars did was to enrich our understanding of the market orientation by focusing on its adoption process by organizations (Jaworski and Kohli, 1993) that had been primarily used in a quantitative sense in the past two decades of research on the topic. In a similar fashion, Gioia et al. (2013) used qualitative research to unravel new concepts about organizational identity such as “sense giving”, “identity ambiguity” and “transitional identity”. As such, under the positivist approach, researchers conduct extensive literature reviews and derive a priori constructs or theory prior to data collection; under the constructivist approach, researchers are not dictated by a priori constructs or theory. The positivist approach relies on theoretical sampling that seeks maximum variation of the data, while the constructivist approach focuses on revelatory- and richness-driven sampling. Another key difference is the approach to wrap up a qualitative research or “reach closure”. The positivist approach focuses on tabulating evidence to refine constructs, paying attention to variables that influence a dependent variable (e.g. decision durations, type of decisions, types of stakeholders that influence high vs low firm performance (Eisenhardt, 1989a), using a few short informants’ quotes, and developing testable propositions and representing the findings in a box-and-arrow model to demonstrate causality. For instance, Eisenhardt (1989a) above offered “closure” by developing a model of strategic decision in high velocity environments along with propositions as the summary. The constructivist approach has no precise style of presenting the findings but tends to demonstrate the coded qualitative data (or sometimes called “data structure”) that contains first-order, second-order and aggregate theoretical dimensions; and a process model that demonstrates the mechanisms or processes of a phenomenon under investigation. An example includes the study of young activists who successfully challenged mafia organizations from the practice
Downloaded by CITY UNIVERSITY OF HONG KONG, Doctor Yanto Chandra At 17:42 09 January 2017 (PT)
of paying protection money (Vaccaro and Palazzo, 2015). These scholars gradually coded various first-order interview data into six second-order themes (i.e. values, hooking, anchoring, activating, securing and uniting) and finally aggregating them into two major dimensions (i.e. moralizing and integrating). Researchers using the constructivist approach present “power quotes” (i.e. the most revelatory examples of informants’ speeches or statements) in the text and data tables. For example, Vaccaro and Palazzo (2015) creatively inserted short informants’ quotes in the text and used tables to summarize various important themes and the corresponding informants’ quotes to portray the data and their abstraction. An overview of computer-assisted qualitative data analysis literature CAQDAS has been used for about 30 years with NVivo and ATLAS.ti being its earliest software applications. CAQDAS-based qualitative research has been used widely across different fields, from arts and humanities, business, to nursing and medicine, and has been highly popular in the health sciences (Woods et al., 2015a, 2015b). Scholars have published numerous articles that discuss the advantages and disadvantages of various CAQDAS software that supports qualitative research such as NVivo, Atlas.ti to MaxQDA (Franzosi et al., 2013; Friese, 2011; Saillard, 2011; Woods et al., 2015a, 2015b), as well as the methodological foundations behind CAQDAS-based qualitative research (Leech and Onwuegbuzie, 2011; Muhr, 1991; Sinkovics and Alfoldi, 2012; Sinkovics et al., 2005). Our review of the CAQDAS literature reveals a consensus among researchers who view CAQDAS positively as a resource to enhance: the transparency, validity, rigor and trustworthiness of qualitative research projects (Sinkovics and Alfoldi, 2012; Woods et al., 2015a); the efficiency in coding and in code comparisons (Bazeley, 2007; Saillard, 2011); the efficient handling and management of relatively large data sets (Morse and Richards, 2002); the management of the “messiness” of data collection during fieldwork (Sinkovics and Alfoldi, 2012, p. 817). Qualitative scholars are also becoming aware of the pitfalls (potential and actual) of CAQDAS including “reflexive blindness” (i.e. lack of awareness of the software’s influence on how researchers conduct research (Woods et al., 2015b), rigid and inflexible analysis (MacMillan, 2005), using a technique/tool simply because the software allows it (García-Horta and Guerra-Ramos, 2009), incorrect code label naming (Davis and Meyer, 2009), contextually distancing the researcher from his/her the data (Sotiriadou et al., 2014) and “coding trap” (being too close to the data; Gilbert, 2002), among others. These pitfalls provide opportunities to improve the use of CAQDAS in qualitative research. We argue that CAQDAS is like a sword (i.e. researcher agency; Woods et al., 2015b): its usefulness depends on the user’s goals, how it is used and, like in the quantitative fields, what its community of users believe about what it stands for and how it should be used (or not). It is also subject to the legitimization process as qualitative scholars writing in leading scholarly journals have legitimized CAQDAS as a preferred research tool. With rapid advancement in computing technologies, there are new avenues to further advance the constructivist qualitative research methodology by marrying it with CAQDAS-based tool that increases the rigor, transparency, validity and replicability of qualitative research. In the past decade, we see the rapid growth of the open source (i.e. “free”) computing tools (e.g. from R, Perl to Python) in the industry and academia as highly promising resources that will support the growth of qualitative research in the future. Despite its popularity as a programming platform, R has mostly been applied to quantitative research (e.g. multiple linear regression, Nimon and Oswald, 2013; topic modeling analysis, Chandra et al., 2016; analysis of co-authorship networks, Wang et al., 2016). To date, very little research has examined ways of using R to perform CAQDAS. Given the large number of researchers who are familiar with R worldwide (i.e. 2 million
Methodology for qualitative research
95
QMR 20,1
Downloaded by CITY UNIVERSITY OF HONG KONG, Doctor Yanto Chandra At 17:42 09 January 2017 (PT)
96
users worldwide, Vance, 2009a, 2009b), there are plenty of opportunities for these R users to “cross over” to analyzing textual, qualitative data as a primary or secondary research tool. RQDA, an R extension for CAQDAS-based research, provides a new methodological arsenal for the current computer-savvy young scholars and students who use CAQDAS or have an interest in using it. Based on our experience, we are aware that some scholars prefer to use “manual approach” (not using any technology or software to facilitate data storage, analysis, retrieval and visualization, but rather using colored pens, highlighters, stickers, different folders and containers to classify the data; Basit, 2003; Coviello, 2014) in doing qualitative research. This practice has its own value and works well when the research data are small and research team members work in adjacent locations. However, problems arise when the research data are large (e.g. involving hundreds of interviews or more, thousands of news articles as data) and researchers work collaboratively across the globe. In other situations, authors may like to openly share the qualitative data and the processes of transforming them into the final product (i.e. a process model or theory) to better persuade journal editors and reviewers to demonstrate the rigor and comprehensiveness of how they carry out research – which can be done using online platforms (e.g. github.com, stackoverflow.com). These, in our experience, are important arguments for why CAQDAS is beneficial for qualitative research. RQDA as a new open source computer-assisted qualitative data analysis capabilities and resources RQDA is a relatively unknown yet powerful CAQDAS tool that emerged alongside the development and popularity of the open source R computing platform (Ihaka and Gentleman, 1996; Jackson, 2014). Open source software is an important intellectual movement (Daniel and Stewart, 2016; Phipps, 2015) in the recent decades, as programmers and scholars understood the value of sharing and making their computing work available for upgrade and further extension by others, which will ultimately benefit the society as a whole. RQDA offers new capabilities compared to existing CAQDAS tools and is thus a new way of seeing and doing qualitative research. One way to better understand RQDA is to contrast it with two of the most widely used CAQDAS tools: NVivo and ATLAS.ti (Woods et al., 2015a, 2015b). As shown in Table II, the three CAQDAS tools can be contrasted along their technical specifications, computing capabilities and methodological orientation. We highlight several key differences, and the rest are shown in Table II. Unlike NVivo or ATLAS.ti, RQDA is open-source software and therefore is free, but, like most open software, it does not come with technical support (e.g. “how to” on the software or a hotline center) from its developer. RQDA supports only text (.txt) files and does not support multimedia files as the other two do. But it supports text data in various non-English languages, including Mandarin, Japanese, Korean, Arabic, German, French, Spanish, Indonesian and other major languages. In terms of its main CAQDAS capabilities, RQDA offers similar capabilities as the other two software programs do, such as data coding and aggregation, but it offers only a simple (two-level) code aggregation to support theory-building research. This was designed to enable researchers to be the main driver of the theory-building process by designing simple yet efficient data aggregation function (Denzin and Lincoln, 2005). RQDA users need to know basic programming language in R to launch RQDA, which is not a requirement for NVivo and ATLAS.ti users. However, the actual use of RQDA is similar to the other two software programs via “point and click” in a graphical user interface (GUI). Therefore, existing R users and computer-savvy researchers will likely find RQDA easy to launch and use.
Aspects of comparison
RQDA
ATLAS.ti
NVivo
Technical specification Year of first release
2008
1993 (prototype in 1989)
Free Free and open source, but no technical support available Win, OSX, Linux Text (.txt) only Allow import data in several foreign languages
Proprietary Paid version and technical support is available Win, OSX, iPad, Android Audio, graphic, text, video Allow import data in several foreign languages
1999 (preceded by NUD*IST, 1989) Proprietary Paid version and technical support is available Win, OSX Audio, graphic, text, video Allow import data in several foreign languages
Need some knowledge of R programming language, also have point and click function Enables users to write R commands for statistical analysis and apply various R packages for statistical analysis “under one platform” No simultaneous use of software by multiple users Coding, Aggregation, Query, Memo, Visualization Up to two levels of hierarchical structure of coding Export to a HTML file
No programming language skills needed, it is a point and click program Enable data attributes to be transformed into tabulations or crosstabulations (matrix) for further statistical analysis in SPSS Lack of simultaneous use of software by multiple users Coding, Aggregation, Query, Memo, Visualization Limited to no function for hierarchical structure of coding Export to SPSS and XML
Allow for complex Boolean search
Allow for complex Boolean search
No programming language skills needed, it is a point and click program Enable data attributes to be transformed into tabulations or crosstabulations (matrix) for further statistical analysis in SPSS Allows simultaneous use of software by multiple users Coding, Aggregation, Query, Memo, Visualization Good function for hierarchical structure of coding Export to RTF, Excel and HTML table Allow for complex Boolean search
Yes, only .txt files
Yes, all types of files
Yes, all types of files
Yes
Yes
Yes
Yes, via file sharing Yes Yes Yes
Yes, real-time team collaboration Yes Yes Yes
Yes, real-time team collaboration Yes Yes Yes
Yes
Yes
Yes
Yes Yes Yes
Yes Yes Yes
Yes Yes Yes
Yes Yes
Yes Yes
Yes Yes
Downloaded by CITY UNIVERSITY OF HONG KONG, Doctor Yanto Chandra At 17:42 09 January 2017 (PT)
License Technical support
OS supported File compatibility Languages Capabilities Programming language skills
Statistical functions
Mode of use
Main CAQDAS functions
Code aggregation
Output sharing Boolean search Methodological Treatment of all materials as one hermeneutic unit Large data set recording, storage, indexing, sorting Cross-border collaboration Coding flexibility Codes comparison Exhaustive coding schemes Researcher reflexivity needed Closeness to data Data attributes addition Transparency and credibility of data analysis Efficient, accurate retrieval Visualization of codes
Methodology for qualitative research
97
Table II. A comparison of RQDA, ATLAS.ti and NVivo CAQDAS programs
QMR 20,1
Downloaded by CITY UNIVERSITY OF HONG KONG, Doctor Yanto Chandra At 17:42 09 January 2017 (PT)
98
Perhaps one of the key strengths of RQDA is that it enables users to write R syntax to conduct statistical analysis of hundreds to tens of thousands of textual files, thus enabling mixed method research in a single platform. One of the most useful features of RQDA is the transformation of its coded outputs into HTML files, which enables data sharing among researchers across geographical borders and eases keyword search on any codes or key words of interest loaded into RQDA. RQDA shares very similar methodological abilities with NVivo and ATLAS.ti, including the treatment of all loaded textual data (e.g. interview transcripts, news articles, company prospectuses) as a single entity for analysis or “one hermeneutic unit” (Muhr, 1991); the ability to record, store, index, sort and retrieve large data sets; flexible coding; audit trails so that other researchers or journal reviewers can check how data were analyzed; data attributes (e.g. source of data, year of data, demographic variables of interviewees) and visible codes (see Table II for more details). An RQDA-based constructivist approach in qualitative research To extend and enrich the constructivist approach using the open source RQDA as a CAQDAS tool, we create the so-called “RQDA-Based Constructivist Approach”. Before we demonstrate the application of a constructivist approach using RQDA, we summarize the constructivist approach step by step (Table III). We posed a clear research question: RQ1. What are the characteristics of customers’ e-complaints in an electronics/computer products setting, and how can they inform organizations to better serve the customers? These questions reflect the rise of online consumer review platforms (Chevalier and Mayzlin, 2006; Chen et al., 2011) (e.g. Amazon, Yelp, TripAdvisor), which makes it easy for consumers to publicize complaints about products they purchase, and the ubiquity of “smart” devices (e.g. smartphones, tablets, laptops), which makes it easy for consumers to share their dissatisfaction with products. Second, we conducted an initial literature review on e-complaints of electronics and computer products. We found a dearth of empirical studies on e-complaints in this product category and those that exist primarily focus on the hospitality industry (e.g. hotels, cruises and tour businesses; Buhalis and Law, 2008; Ekiz et al., 2012; Mattila and Mount, 2003; Robertson, 2012; Ye et al., 2011). This dearth of empirical studies on electronics and computer products e-complaints provides an opportunity to demonstrate how to develop a process model of consumer e-complaints in a new context and to offer practical advice to managers/CEOs in the sector on how to avoid and manage such complaints. We selected www.customerservicescoreboard.com/index.php as our sampling site because this platform offers a myriad of user-generated (UG) reviews on various types of electronics and computer products. The site classifies all UG reviews as either “negative” (e-complaints) or “positive” (e-praises). We chose an electronics and computer company based in Silicon Valley from this site for the demonstration and carefully read various e-complaints and e-praises written by users before sampling the e-complaints and including them in our study. We did not interview customers, as we could have if following the usual constructivist approach, because our study of e-complaints naturally takes place inside an electronic medium and therefore the best way to study e-complaints is to study UG-generated complaints found in the electronic medium. This is similar to the netnography method that primarily uses naturalistic and unobstrusive approach to collecting data on online communities (Kozinets, 2002). We relied on revelatory sampling by choosing five e-complaints and five e-praises (n ⫽ 10) of 845 e-complaints and 127 e-praises on the
Downloaded by CITY UNIVERSITY OF HONG KONG, Doctor Yanto Chandra At 17:42 09 January 2017 (PT)
Process
Meaning
(1) Research question
Articulate a clear research question at the outset of the study
(2) Initial literature review
Consult the literature lightly at the outset of the study, not to be dictated by it. Refine the research question after initial literature review as necessary
(3) Case selection
Choose a case or cases that offer revelatory and rich qualities (i.e. critical, extreme, revelatory case(s))
(4) Interview protocol
Develop an interview protocol; adjust the interview questions as the research evolves to capture new, important themes or constructs
(5) Data collection
Conduct interviews, collect additional data through documents and observations; data collection and analysis overlaps in time
(6) Data analysis
Code the first-order terms, aggregate them to the second-order categories, and finally the aggregate dimensions; assemble all these into a “data structure”
(7) Theory articulation
Construct dynamic relationships among secondorder or aggregate dimensions; develop a process model by consulting the literature
Relevance to the current RQDA demonstration “What are the characteristics of customers’ e-complaint in a electronics and computer products setting?”, “How can they inform organizations to better serve the customers” Literature review on e-complaints conducted. Found a dearth of studies on e-complaint in the electronics and computer products category; most focus on online hotel bookings, and a dearth of a theory building research on e-complaints Picked an online user-generated (UG) review platform that contains ecomplaints and e-praises on a well-known smart gadget Determined by the research question. No interview protocol was developed here as the data were collected from online UG reviews Sampled 5 negative and 5 positive UG reviews (to create a contrast of customer views) from a UG review platform on Step 3 above. Transformed each UG review into separate ASCII or .txt files for entry into RQDA Loaded the five e-complaints .txt files into RQDA, then the other five e-praises .txt files Conducted constructivist coding process on all e-complaints and then e-praises; created first-level codes using RQDA and aggregated them to second-level code categories using Plots function, and finally created a data structure using Microsoft Visio (for high-quality visuals) Developed a process model of customer e-complaint rhetoric in the electronics and computer product sector
company. We copied, pasted and saved all e-complaints and e-praises as individual “.txt” files. Next, we loaded them into RQDA, conducted open and axial coding and created a two-order code aggregation. Based on this, we developed a data structure and a process model. In the next section, we describe the steps to install RQDA through to the creation of a process model (Table IV). Step 1: preparation RQDA, a package that is installable from and runs within the R system (Ihaka and Gentleman, 1996), has a separate window running on the GUI (using RGtk2) that was developed by Huang Ronggui in 2008 as a free CAQDAS application (Huang, 2014). RQDA relies primarily on GUI – a user interface that enables users to communicate with electronic devices via graphical icons and visual indicator, rather than syntax-based user interfaces. Users must first install R or RStudio and then RQDA. Instructions and resources for
Methodology for qualitative research
99
Table III. A step-by-step process of the constructivist qualitative research approach
#6. One or more coder performs inductive data analysis together, by highlighting the text and clicking “Mark” (“Unmark”) to do (undo) the coding #7. Other analyst(s) critiques the coding results; reconcile differences in interpretation
#8. Click “Attributes” and record key data attributes (e.g. data sources, informants’ demographics, dependent variables) #9. Click “Memo” to write memos for each case #10. Use “Add To” button to assign all firstorder codes to second-order code categories To create third-order code categories, copy and paste all codes and re-arrange them using color font with Excel
#11. Select all second-order using cursor, click on “right mouse” and press “Plot Selected Code Categories”
#12. Identify the relationships among themes/ concepts/variables that emerged to create a process model
Coding (cf. process 6 in Table II)
Data attributes (cf. process 6 in Table II)
Code plotting and sharing (cf. process 6 in Table II)
Theory building (cf. process 7 in Table II)
Codes abstraction (cf. process 6 in Table II)
#1. Install R, RSQLite, GTK⫹, RQDA #2. Transform textual data into individual ASCII or .txt files #3. Launch RQDA #4. Create a new project #5. Upload all .txt files into RQDA
Preparation (cf. process 1, 2, 3, 4 and 5 in Table II)
Table IV. An RQDA-based constructivist methodology for qualitative research
RQDA-based data analysis
Produce artistic, high-quality images of networks of codes Can re-arrange network codes using various network plot models (e.g. Fruchterman–Reingold, Kamada–Kawai, etc. This is a manual process that can only be done using human interpreter
A highly systematic way of aggregating codes to a higher level of meaning Challenging to aggregate too many first-order codes (thousands of codes) to second-order codes
Increased reliability and accuracy of data interpretation Ease of capturing new, unexpected insights through re-coding of data Possible mechanical errors for inexperienced users Possible loss of reflexivity or de-contextualizing data Allow easy capture of meta information of the data and attributes of informants Memos can be copied-and-pasted to a Word processor to aid data analysis
All data files are transportable online via emails, Dropbox, or using a device (e.g. USB stick) Ease of logistics handling when moving offices, involving multiple researchers Not all researchers are familiar with R
Advantages and disadvantages
Improve “transparency and credibility” (that results can be corroborated by others) (Friese, 2011) Enable “complex, exhaustive coding schemes” and “efficient and accurate retrieval” of coded data (Woods et al., 2015b) Enhance “systematization, trustworthiness, operational effectiveness” in data analysis (Sinkovics et al., 2008) Facilitate the “visualization” of findings (Friese, 2011) Enable “progressive focusing” via complex iteration between theory and data (Sinkovics and Alfoldi, 2012)
Allow “logistics and cognitive efficiency” by placing all research materials in one “hermeneutic unit” (Muhr, 1991) inside RQDA Ease of “recording, storing, indexing, and sorting” large sets of qualitative data (Morse and Richards, 2002) Allow “cross border collaboration” (Friese, 2011) Enable “coding flexibility” (Friese, 2011) Promote “researcher reflexivity”, but beware of “reflexive blindness” (Woods et al., 2015a) Ease “codes comparison” (Bazeley, 2007) A “labor intensive” process (Sotiriadou et al., 2014) but enable “closeness to the data” (Saillard, 2011) Attributes and memos might be written “all over the places” and not analyzed (Friese, 2011)
Relevant methodological concepts
100
Steps
Downloaded by CITY UNIVERSITY OF HONG KONG, Doctor Yanto Chandra At 17:42 09 January 2017 (PT)
QMR 20,1
Downloaded by CITY UNIVERSITY OF HONG KONG, Doctor Yanto Chandra At 17:42 09 January 2017 (PT)
installing R under different systems (i.e. Unix, Windows and OS X) are available online (https://cran.r-project.org/doc/manuals/R-admin.html). Users must first install R, which is available at https://cran.r-project.org/bin/windows/base/, or RStudio, which is available at www.rstudio.com/products/rstudio/download/, and choose the supported platforms (e.g. Mac OS, Windows, Ubuntu). Once R or RStudio is successfully installed, the user needs to launch the R or RStudio console and type the command (or syntax) for Windows or Linux to launch RQDA (Huang, 2014): install.packages [“RQDA”, dependencies⫽c(“Depends”, “Imports”)] install.packages (“RQDA”, repos⫽“http://R-Forge.R-project.org”) require(RQDA) or for Mac OSX users: install.packages(“RQDA”, type⫽“source”) The installation of RQDA can be quite complex, especially for users with no experience with R because it involves the installation of GTK⫹ and R and RQDA packages within R. To address this problem, Huang (2014) offers an alternative for non-R users who use Windows OS by providing an RQDA.bat file for download at (https://onedrive.live.com/?id⫽41C1EE 655922D297%21278&cid⫽41C1EE655922D297) or (http://pan.baidu.com/share/home?uk⫽ 3691332575#category/type⫽0) to launch RQDA directly. For more details on installation, see http://rqda.r-forge.r-project.org/. Once RQDA is launched, users can click the “New Project” button to create a new project and save the project file (.rqda file) in the right-hand directory. Next, all the files for analysis (i.e. the five e-complaints and five e-praises files in .txt format) are imported to RQDA. Go to the “Files” menu and click the “Import” button. Each case (e.g. in this study the “case” is an electronics and computer company) may consist of multiple data files, and once all relevant files are labeled (e.g. e-complaint file #1, #2, #3; e-praises file #1, #2, #3; or positive interview #1, #2, #3; negative interview #1, #2, #3; news article #1, #2, #3) and imported in RQDA, they form a single “hermeneutic unit” (Muhr, 1991) for a complete analysis. Once all files are imported, users are ready to start coding the data. For cross-border collaborations (Friese, 2011), users should use the same imported data files and share the coded outputs file in a Dropbox or share the file via email. Step 2: coding One of the most important functions of RQDA is coding. RQDA allows inductive and deductive coding; its operation is intuitive. Inductive coding or open coding, which is the preferred option under the constructivist approach (Strauss and Corbin, 1990; Gioia et al., 2013), allows a user to code a textual unit (e.g. paragraphs, sentences, words) that is close to (i.e. the basic or lowest level) the data without being predicated on any theory, construct or concept. For example, “they used my debit card to charge amounts I never authorized” is coded as “monetary loss”. In deductive coding (positivistic approach; Fereday and Muir-Cochrane, 2006; Bazeley and Jackson, 2013), categories are coded based on established concepts, variables or theories. For example, if a researcher has pre-conceived theory that “market orientation” (Jaworski and Kohli, 1993) will influence the presence or absence of customer e-complaints, then he/she can code any UG reviews that contain e-complaints (e.g. “the customer service department doesn’t work well with the technical support and that’s why they took six months to solve my technical problems”) or e-praises (e.g. “this company asked for my feedback and the services keeps getting better”) as evidence of the “market orientation” construct. When an imported .txt file is double-clicked, a new window appears on the upper right-hand corner; under the Codes menu, the user then clicks the mark button to apply a new code to a text passage (or unmark to cancel the code). Codes can be merged by right clicking in the Codes menu and clicking Merge Selected with […]. In addition, users can also add
Methodology for qualitative research
101
QMR 20,1
Downloaded by CITY UNIVERSITY OF HONG KONG, Doctor Yanto Chandra At 17:42 09 January 2017 (PT)
102
conditions (e.g. “with memo” or “with code category”) within the same menu. A sample of coded text containing themes of an e-complaint of an electronics and computer product is shown in Figure 1. In the constructivist approach, one or more coders perform the coding task, while another research team member(s) critiques the coded results and reconcile any differences in the interpretation of the data (Gioia et al., 2013). This is a good practice to ensure reliability and accuracy of data analysis. Coders need to pay attention to the process of “zooming in and zooming out” in the coding process to avoid de-contextualizing the data (Sotiriadou et al., 2014) also called “coding traps” (Gilbert, 2002) and remain reflexive of the influence of the RQDA on data analysis (Woods et al., 2015a). Users need to constantly compare code labels (Bazeley, 2007) and refine the code labels iteratively so the codes best represent the themes that emerged [i.e. coding flexibility (Friese, 2011)]. These processes may be quite time-consuming for novice users but can be efficient and effective with experience. Step 3: data attributes RQDA users assign attributes to each file. In fact, in most CAQDAS literature, scholars recommend that coders add data attributes or memos to enrich understanding (Friese, 2011; Paulus and Lester, 2016; Saillard, 2011). The “attribute” function basically enables users to add variables to individual files to show a subset of files and to perform statistical analysis on attributes. Attributes can be the type of files (e.g. interviews or news articles) or more detailed information (e.g. informant #1 vs #10). To review the attributes of an individual file, researchers can simply click the Attribute button in the File menu. In addition, researchers can record their thoughts during the coding process by using the “memo” and “journal” tools, which help them organize data and recall important information (e.g. “informants #2 and #6 expressed very negative feelings about their personal life, which may influence their online reviews”; or “informants #1, #3, #5, and #6 are all engineers by training and therefore they are more critical of the technical aspects of their online reviews”), in addition to helping them aggregate data and build theory. It is important for RQDA users to always remind themselves to ensure that the attributes and memos that are “all over the place” (Friese, 2011) are captured and analyzed to avoid information loss. Step 4: code abstraction After the coding process is completed, first-level codes can then be aggregated into higher-level code categories (called abstraction to second-level categories). To do this, a user clicks the Code Categories menu, then clicks the Add button and types a second-level category label (e.g. “they used my debit card to charge amounts that I never authorize” and “this faulty laptop means I couldn’t work for four days” can be aggregated to a higher-level concept called “monetary loss”). The user then places the cursor on a new second-level code category (e.g. “monetary loss”) and moves the first-level codes into it by clicking all first-level codes that share similar meaning using the Add To button. The user assigns all first-level codes to the second-level code categories until no first-level code remains. This process is consistent with the constructivist theory-building process (Strauss and Corbin, 1990; Gioia et al., 2013; Vaccaro and Palazzo, 2015). This process can be iterative, and a user can amend first-level codes and their assignment to second-level categories, if necessary. The coding (Step 2) and code abstraction (Step 4) processes enables other researchers to corroborate and/or check the results to see whether they arrive at the same coding and code aggregation (i.e. analytical triangulation, Yin, 2009); it also facilitates communication and sharing of the coding processes and coded outputs among researchers, and between researchers and gatekeepers (e.g. journal reviewers, editors), among others. In this way, these processes increase the transparency and credibility (Friese, 2011) of qualitative research.
Downloaded by CITY UNIVERSITY OF HONG KONG, Doctor Yanto Chandra At 17:42 09 January 2017 (PT)
Methodology for qualitative research
103
Figure 1. A sample screenshot of a coded text
QMR 20,1
Downloaded by CITY UNIVERSITY OF HONG KONG, Doctor Yanto Chandra At 17:42 09 January 2017 (PT)
104
Importantly, it facilitates complex and exhaustive coding schemes and efficient and accurate retrieval of coded data (Woods et al., 2015a). Figure 2 shows the 24 first-level categories or themes that were coded from the ten raw texts imported to RQDA (see Step 2 above). Each of the coded categories can be amended by clicking the Rename button or deleted by clicking the Delete button in the Codes menu. Figure 3 illustrates how we reduced and abstracted the 24 first-level codes to a higher level meaning by creating 11 second-order categories. As a research team, we interpreted, discussed and then combined the first-level codes with similar meaning (i.e. “feeling stressful”, “feeling sad”, “feeling powerless”, “feeling angry”, “feeling disappointed”) into a new second-order category (i.e. “customer dissatisfaction”) using the Add To button until all first-level codes were assigned to a second-level category. One of us acted as a “devil’s advocate” to challenge/review the aggregated codes (Gioia et al., 2013). Step 5: code plotting When the code abstraction or aggregation is completed (as shown in Figure 3), the user plots the coding results in two-dimensional outputs. This process allows users to visualize the coding results and thus enhance the data interpretation and analysis process (i.e. visual thinking; Arnheim, 1969). Another advantage of doing code plotting is that it produces aesthetic and publication ready visuals. To do this, the user points the cursor to all (or selected) second-level code categories shown in the console and right-clicking the mouse and simultaneously pressing the Plot Selected Code Categories button (Figure 3). This process automatically produces nodes and arrows in the form of networks, where each node represents first-level codes connected to second-level codes at the network’s center. The output can be modified using various network types (e.g. the Fruchterman-Reingold or Kamada Kawai layout) and is visually appealing. This code visualization process (Friese, 2011) enhances understanding and communication between researchers. In the language of the constructivist approach, during this code abstraction process, users can transition from an inductive to abductive theorizing process by moving back and forth between the emergent findings and the literature/theories to find new concepts within the data (Alvesson and Kärreman, 2007). A sample of first- and second-level category plots of the coded texts are shown in Figure 4. RQDA coding outputs can be exported as HTML files, rendering the analyses more accessible and enhancing the trustworthiness, transparency and credibility (Sinkovics et al., 2008; Woods et al., 2015a, 2015b) of the qualitative data analysis. In contrast to a platform-specific file format, which can be cumbersome to access and read, HTML files that show all first- and second-level codes can be shared with readers, particularly reviewers and editors, as well as other users and the open source community. To do this, the user applies the very helpful Export function. RQDA project data, which consists of codes, categories, attributes, memos and other information, are stored in .rqda files. Users can export the .rqda files to other data analysis software such as SPSS or the R program for further statistical analysis. Figure 5 offers a small part of first- and second-level codes in an HTML file. RQDA uses colors to highlight different codes; researchers can retrieve all coding under individual codes at any time. This function allows researchers to organize and keep track of many “messy” texts using certain color as the common denominator. Users simply double click the code, and a new window showing all coding appears. This allows the user to see all codes that were marked with a particular color or meaning. RQDA also enables conditional retrieval. For example, users can opt to retrieve codes with or without a coding category. In Figure 6, we demonstrate the selective retrieval of two second-level categories (i.e. customer dissatisfaction and communication problems) to zoom in on specific second-level codes.
Downloaded by CITY UNIVERSITY OF HONG KONG, Doctor Yanto Chandra At 17:42 09 January 2017 (PT)
Methodology for qualitative research
105
Figure 2. The first-level categories or themes coded from all coded data (24 codes)
Downloaded by CITY UNIVERSITY OF HONG KONG, Doctor Yanto Chandra At 17:42 09 January 2017 (PT)
QMR 20,1
106
Figure 3. Abstracting first-level code categories to second-level code categories
Methodology for qualitative research
Downloaded by CITY UNIVERSITY OF HONG KONG, Doctor Yanto Chandra At 17:42 09 January 2017 (PT)
107
Figure 4. A sample plot of first-level and second-level code categories
Another powerful feature of RQDA is that users can perform complex queries (e.g. Boolean searches) on coded data by typing syntax or commands in the R window. (For users who are familiar with and have SQL on their desktop, they can also use SQL to perform complex queries. SQL is designed for data management and is powerful in structured data computing, and can therefore supplement RQDA. For users who are well-versed in SQL and “think” in SQL but want to use R for additional statistical analysis or data visualization, there are two
QMR 20,1
Downloaded by CITY UNIVERSITY OF HONG KONG, Doctor Yanto Chandra At 17:42 09 January 2017 (PT)
108
Figure 5. An HTML file containing a few coded categories for sharing among researchers
useful R packages that optimized for convenience, which are sqldf and plyr (Anderson, 2012; Grothendieck, 2014). While this function appears trivial in the case of a few texts, it is effective and efficient with hundreds or thousands of texts. For example, if a user wants to see the coding for code 1 or code 2, he/she can enter the command RQDAQuery (“select seltext from coding where cid⫽1 or cid⫽2” ) in the R window (Huang, 2014). This function helps qualitative researchers further manage data and complex operations and meets the needs of various users (e.g. doing small N or large N studies) and project types (e.g. purely qualitative, mixed method research). Step 6: theory building Finally, we iteratively re-categorized all first- and second-level code categories in a “data structure” format (Gioia et al., 2013; Vaccaro and Palazzo, 2015) to refine codes to the best possible higher-level categories that describe and explain the empirical reality and the literature on e-complaints. After three iterations, we developed a data structure as shown in Figure 7. As shown in Figure 7, we provided two of the most representative quotes from each of the 24 first-level code categories created (i.e. company arrogance, booking problems, complicated diagnosis, helpful service, patient service, friendly service, customer’s lack of technical knowledge, feeling angry, feeling disappointed, feeling powerless, feeling sad, feeling stressful, great bargain, great service recovery, hardware malfunction, loss of productivity, miscommunication, misinformed, not caring about customers, service rep spoke too fast, slow response, sue the company, unauthorized charging and vendor mistakes). We then abstracted them to 11 second-level codes (i.e. communication problems, customer dissatisfaction, excellent service recovery, information asymmetry, love the bargains, malfunctions, monetary loss, negative image for company, poor customer service, quality customer service and vendor problems). Next, we developed five aggregate dimensions that help us explain the why’s and how’s of e-complaints in the electronics and computer sector: service quality, coordination, financial, technical and responsibility orientations. “Service quality” orientation refers to customers’ attention to the service quality provided by companies. While service quality and its
Downloaded by CITY UNIVERSITY OF HONG KONG, Doctor Yanto Chandra At 17:42 09 January 2017 (PT)
Methodology for qualitative research
109
Figure 6. A selected plot view of two second-level code categories
dimensions (e.g. reliability, responsiveness, empathy) have been studied for many years in marketing and psychology (Bolton and Drew, 1991; Parasuraman et al., 1985), the service quality orientation refers to the service quality perceived by customers, or a customer-centric side of the attention-based view theory (Chandra, 2016; Ocasio, 1997), which predicts the number of e-complaints and e-praises. “Coordination” orientation refers to customers’ attention to firm’s ability to coordinate its supply chain and service delivery units (external to internal and vice versa). This orientation extends the buyer–vendor coordination literature in marketing and operations management (Huq et al., 2016; Sarmah et al., 2006; Schmid et al., 2016) by highlighting the importance of customer perception of a firm’s service value chain as key to their e-complaints or e-praises.
QMR 20,1
First-level code categories G1. This company is the worst they take money but have NO interest at all in their customers. G2. I have been trying to talk to them about my problem for 6 months, they just stop answering B1. I am retired and 70 years old and they have increased my stress level immeasurably!
Downloaded by CITY UNIVERSITY OF HONG KONG, Doctor Yanto Chandra At 17:42 09 January 2017 (PT)
110
B2. I too plan on writing the CEO but it seems that will be a waste of time as well. But what can we do?
Second-level code categories
Aggregate theoretical dimensions
Poor customer service
Customer dissatisfaction Service quality orientation
I1. They replaced it even though we had gone past the 14 day dateline. They refunded us in full – they just want us to be happy I2. A simple apology would have worked but they went above and beyond to ensure customer satisfaction. K1. She was patient to wait on the phone for my phone to restore which took 25 mins, checking every 3 minutes how its going.
Excellent service recovery
Quality customer service
K2. the service was very painless and friendly.
C1. You as the ‘experts’ should have advised that photos are not automatically saved, must be backed up before we change over C2. They provide this service and assured me that if I moved up to the new phone, my call dropping would disappear. It doesn’t A1. This isn't booking. To book means to have a date to bring it in for attention. I was left without a computer for 4 days. A2. You have to get through like 15 computer questions and stuff to get to Costumer Support H1. I sent a letter of distress to (their reseller) and received no response. H2. Your connection to (a telco) will certainly continue to erode the confidence of the your product
E1. They used my debit card to charge amounts that I never authorized
Information asymmetry
Communication problems
Coordination orientation
Vendor problems
Monetary loss
E2. This means surrendering it for up to 4 days. What an outrage! Financial orientation J1. They seem to have set up a good bargain nonetheless, $310 flat rate and they will return the computer to original working condition. Great deal, it was done in one day
D1. Guess what!! No ring tone or alert when receiving a text. D2. Graphics processing unit (video card) died on my device. F1. They get away with treating customers like dirt because they thinks they are immune from any danger from irate customers.
Love the bargains
Malfunctions
Technical orientation
Negative Image
Responsibility orientation
F2. I am about to file a fraud charge against them with my bank. Figure 7. A data structure of customer e-complaints Note: This ‘data structure’ was drawn using Microsoft Visio for optimal visualization. The in the electronics and non-shaded boxes are quotes and codes from e-complaint samples; the shaded boxes are computer sector quotes and codes from e-praises samples
“Financial” orientation refers to customers’ attention to financial gains or losses in their interactions with a technology provider, or what the services marketing literature calls “distributive justice” (Liao, 2007; Mattila, 2001; Roschk and Gelbrich, 2014), which emphasizes the importance of customers’ perceived fairness of the complaint outcomes (e.g. that a firm repairs or replaces a faulty product or helps a customer use a product). This demonstration also suggests that customers attach great importance to financial incentives (e.g. money back guarantee, product replacement, discounts), following a service failure. “Technical” orientation refers to customers’ attention to technical matters including technical errors when making e-complaints and e-praises. Marketing and service
Downloaded by CITY UNIVERSITY OF HONG KONG, Doctor Yanto Chandra At 17:42 09 January 2017 (PT)
management scholars have studied various service recovery procedures (Dabholkar and Spaid, 2012; Oliveira and Roth, 2012) and highlight the negative influence of technology error (e.g. faulty products) on customer satisfaction. Our demonstration reveals the importance of the firm’s technical capabilities as a predictor of e-complaints or e-praises. Finally, “responsibility” orientation refers to customers’ attention to the firm’s sense of business responsibility (Garriga and Melé, 2004), particularly delivering its promises and treating customers with respect and fairness. It may also reveal and reflect customers’ expectation about service recovery as a part of firm’s corporate social responsibility, which has gained popularity in the past decade (Choi and La, 2013; Joireman et al., 2015). In “reaching closure” as per the constructivist approach, we went back and forth between our coded data and the emergent literature on e-complaints (Alvesson and Kärreman, 2007; Gioia et al., 2013) and saw an opportunity to extend the e-complaint literature by positioning our process model as a customer e-complaint rhetoric model (Figure 8). As shown in Figure 8, we theorize that e-complaints and e-praises are influenced and can be predicted by five customer rhetoric orientations: service quality, coordination, financial, technical and responsibility. We found that customers used e-complaints as a means of action to right a wrong; an e-complaint is a verbal act against the firm (e.g. publicly condemning the firm), and a means of coordination with others (e.g. persuading others to report the complaints to local news stations), and a means of thoughtful action to reflect about the world (e.g. What went wrong with this experience with the firm?). These three actions are parallel to the use of language as a social action, coordinated action and thoughtful action, respectively, according to the speech act theory (Austin, 1975; Chandra, 2016; Holtgraves, 2013). The verbalized thoughts in the form of e-comments or e-praises are aimed to change the e-commenter’s (i.e. the customer’s) as well as potential customers’ psychological and behavioral state (e.g. dissatisfaction, switch to other firms and/or spread negative reviews of the firm/product, punish the offending firm by drawing customers away). Ultimately, they can affect the firm’s performance (i.e. bottom line). The e-complaints, which could extend to customers launching negative campaigns or taking legal action against a firm, can also influence the firm’s performance, i.e. its bottom line. In this demonstration, we simplified the theorizing process leading to the process model (Figure 8); the actual theorizing process for a complete qualitative paper is usually much more elaborate and explains how the process model enriches and extends the literature.
Methodology for qualitative research
111
Service quality orientation
Coordination orientation
Financial orientation
Customers’ psychological and behavioral change E-complaints or e -praises as social action as coordinated action as thoughtful action Firm performance
Technical orientation
Responsibility orientation
Figure 8. A process model of customer e-complaint rhetoric in the electronics and computer sector
QMR 20,1
Downloaded by CITY UNIVERSITY OF HONG KONG, Doctor Yanto Chandra At 17:42 09 January 2017 (PT)
112
Discussion In the following, we reflect a few key insights gained from using the RQDA-based constructivist qualitative research in this study’s demonstration and our accumulated experience using RQDA since 2013 in research and teaching university-level research methodology classes. We are also experienced users of NVivo and ATLAS.ti, which qualify us to evaluate the relative merits and shortfalls of RQDA and to compare it with these two CAQDAS tools. Advantages of RQDA-based constructivist qualitative research Two of RQDA’s main advantages are that it is free and compatible with various operating systems (OS) including Windows, Mac and Linux. Based on our demonstration (Table II), RQDA seems to fare well in terms of OS compatibility compared to NVivo and ATLAS.ti. In the age of budget-cutting, universities, corporations and nonprofits can benefit from free CAQDAS software such as RQDA. Existing R users can easily “cross over” to RQDA to analyze textual data using RQDA as a primary or secondary analytical tool, and, in our view, they will be the early adopters of RQDA. Computer-savvy faculty, graduate students and independent researchers doing CAQDAS-based qualitative research will find RQDA a valuable new methodological tool. Although RQDA does not come with any official technical support from its developer, we have never found any bugs or faced any technical failures during our four years of experience with RQDA. However, we have maintained good communication with RQDA developers to ensure that our knowledge of RQDA is current. Additionally, we have found that RQDA’s capabilities meet most qualitative researchers’ needs and that its capabilities are comparable to fee-based CAQDAS software such as ATLAS.ti and NVivo for coding, attributes addition and code abstraction (Table I). RQDA use is simple and intuitive and therefore suitable for non-programmers and novice researchers, as the package uses a very straightforward “point, touch and click” (GUI-based) window. Extensive knowledge of R is not necessary to operate RQDA. However, basic programming skills using syntax in R can be helpful in launching RQDA. Based on our experience, one of RQDA’s most powerful features is its code plotting capability, which offers elegant and publication-ready images of node networks that no other CAQDAS tools offer. Moreover, RQDA also enables users to analyze data in different languages (nine languages, total), thus facilitating cross-cultural research, which can enhance various disciplines including linguistics, cross-cultural studies, psychology, marketing and organizational and managerial sciences. Furthermore, RQDA users can use R functions to import batches of files (e.g. hundreds or thousands) using a simple syntax. RQDA is supported by SQLite (a relational database management system; James and Falcon, 2011), and thus its functionality can be enhanced by writing R commands. Because RQDA seamlessly integrates with R, it enables statistical analysis of the coding and additional functions for data manipulation and analysis. NVivo and ATLAS.ti also can record attribute data in the form of categorical or ordinal variables (e.g. male/female, high/medium/low performance), which can be manually inserted into in the CAQDAS software or imported from a spreadsheet, which allows further statistical analysis [e.g. cluster or correspondence analysis (Bazeley, 2002, 2007; Friese, 2011)]. However, in our literature review, we found that very few researchers actually used the quantitative applications of NVivo or ATLAS.ti, and that qualitative data analysis was the primary application used. The uniqueness of RQDA is that it does not require the support of external applications (e.g. Excel spreadsheets or SPSS) to perform statistical analysis, which are needed for NVivo or ATLAS.ti (Bazeley, 2007; Friese, 2011). Rather, RQDA relies on more than 5,000
Downloaded by CITY UNIVERSITY OF HONG KONG, Doctor Yanto Chandra At 17:42 09 January 2017 (PT)
application packages available in the R platform to conduct statistical analysis on textual data or advanced statistical analysis. For example, Ye (2010) combined RQDA with tm, an R text-mining package that uses statistical probability techniques to categorize large bodies of words. It may also be possible to combine RQDA and topic modeling, a new computational technique that seeks to extract themes from large bodies of textual data using statistical techniques (Blei, 2012). Finally, we have used the above demonstration in our methodology courses at the undergraduate, master’s and PhD levels for the past three years. We have found that students with no experience in CAQDAS or qualitative research became competent users of the RQDA-based constructivist methodology in just nine-hour lessons. However, most of them required additional reading of specific substantive domain literature (e.g. services marketing, e-marketing or technology management literature) to proficiently transform the data structure into a “process model”. But no students experienced any technical challenges in operating and using RQDA. We argue that the current computer-savvy young people are well-equipped to use a light-weight programming platform such as RQDA with proper instruction, and no prior experience is necessary to learn RQDA. Constraints and opportunities for RQDA-based constructivist qualitative research We found that RQDA has certain shortcomings. First, RQDA supports only plain text (.txt) files. It neither does support multimedia (audio, videos) files, spreadsheets, tables, photos or other non-plain text formats nor does it support transcription of audio and video files, which are supported by NVivo and ATLAS.ti. Therefore, NVivo may be a better choice for ethnographers and visual methodologists who work with a large number of photo and video data. Future refinements of RQDA could accommodate these types of files. Another shortfall of RQDA is that the code-category relationships can only be established for one hierarchy – from the first- to second-level code category. That is, it does not provide a complex tree-like category structure to organize concepts as do NVivo and ATLAS.ti (Bazeley, 2007; Friese, 2011). The original purpose of RQDA was to simplify data aggregation structures and to help researchers avoid creating too many layers of data abstraction. As Huang (2014) argues, the tree structure may be too cumbersome to describe relationships between abstract concepts or to identify theories based on text patterns. Moreover, if a project has too many codes and categories, the plot map can become quite messy and indecipherable. However, based on our own experimentation and experience using RQDA in large-scale projects (e.g. developing a process model of entrepreneurial emancipation using over 50 interviews as data; studying the narratives of the emergence of social enterprises using 200 biographical profiles) in the past four years, users can overcome this limitation by exporting codes and categories using RQDA to other applications, such as spreadsheets (e.g. Excel) to create further “aggregate” coding hierarchies and develop “data structures” as per the constructivist approach. Therefore, there are rooms for improvisation and bricolage in using RQDA. Moreover, because RQDA is a package within R, users must have some basic knowledge of R language. Based on our experience in using and teaching RQDA (and R) in undergraduate and graduate methods courses, users can use some “shortcuts” to simplify the syntax use in RQDA. For instance, the R syntax required for a RQDA launch can be saved in a “notepad” (non-programmable) file, which can be simply copied and pasted directly to the R console. In this way, a user can launch RQDA very efficiently and without worrying about making a typo when typing in R syntax (which often occurs among novice users). For more complex statistical analysis of texts, a substantial amount of time is needed to learn the R language and other relevant R packages. This is both a constraint and an opportunity.
Methodology for qualitative research
113
QMR 20,1
Downloaded by CITY UNIVERSITY OF HONG KONG, Doctor Yanto Chandra At 17:42 09 January 2017 (PT)
114
Implications Our methodological demonstration offers at least two important implications to the discourse and literature in qualitative methodology. First, we unpacked the ontological and epistemological roots of two main paradigms in qualitative research – positivism and constructivism – and proposed the RQDA-based constructivist qualitative research methodology and the step-by-step procedures to transform a research question and qualitative data into a process model. Our proposed approach leverages the strengths of constructivism as a lens to study social reality and the relatively new open source CAQDAS software called RQDA. It will enable future qualitative researchers to conduct research with rigor, transparency and credibility. This fills in the “boilerplate”, operationalization and transparency gaps in the empirical and review papers on qualitative research methodology. Second, we offered an in-depth and critical review of RQDA, an R extension for qualitative data analysis, and grounded it within the broader CAQDAS literature and how it fared with two popular CAQDAS software, NVivo and Atlas.ti. By doing so, we provided the first official review of RQDA as a new methodological arsenal for qualitative scholars. Our review of the RQDA also provides a theoretically informed debate about the role of CAQDAS and how it can advance qualitative research scholarship. This fills in the theoretical gap about RQDA as a new CAQDAS tool and answers some of the methodological and practical questions behind it. Conclusion and implications for future research Qualitative research faces legitimacy, contestation and transparency problem. It “lacks a boilerplate” (Pratt, 2009) in qualitative data assessment and presentation. Thus, it often fails to achieve the status of other forms of research, such as quantitative (variance-based, experiment-based, simulation-based and mathematics-based) research (Van de Ven and Engleman, 2004; Yang and Chandra, 2013); moreover, qualitative research is not as well published as the quantitative research in top-tier marketing, psychology and management to political sciences journals. The purpose of this review and demonstration is to offer a means to enhance the transparency, validity and replicability of qualitative research by integrating a new CAQDAS tool called RQDA and the constructivist approach in qualitative research, which we called RQDA-based constructivist qualitative research. Despite the promise of RQDA to enhance the constructivist approach, there is a dearth of literature and “how to” guide on RQDA (ours is among the first). The very few published journal articles that cite RQDA tend to use it to perform only basic data analysis (Schwarzkopf et al., 2013; Vanwindekens et al., 2013; Lamprinakis, 2012). In this article, we propose and demonstrate how the RQDA-based constructivist approach can be implemented to develop a process model (as a means to make new discoveries) and how it adds a valuable tool to qualitative scholars’ methodological toolbox. We propose that the constructivist approach be used as a methodological prototype for future CAQDAS-based research. As we demonstrated, the power of the constructivist approach lies in how it derives “new concepts” and provides a “data structure” and a “process model”, which offers a systematic and transparent means to presenting qualitative research. In this way, the constructivist approach increases the legitimacy of CAQDAS-based qualitative research. Therefore, our study provides a new avenue for qualitative scholars to further integrate other CAQDAS software (e.g. MaxQDA, NVivo, ATLAS.ti) with the constructivist approach. Our RQDA-based constructivist methodology can be applied to various types of qualitative research, from grounded theory, ethnography, discourse analysis, to the verbal autopsy method, among others (Leech and Onwuegbuzie, 2011; Woods et al., 2015a). Going
Downloaded by CITY UNIVERSITY OF HONG KONG, Doctor Yanto Chandra At 17:42 09 January 2017 (PT)
forward, RQDA developers can consider extending its capabilities to handle multimedia files so it can analyze a broader set of social-economic-political phenomena. This is important given the rise of social media (e.g. Facebook, Twitter, YouTube, Instagram and cameras in smartphones and other handheld electronics) globally. One potential but under-used capability of RQDA is its support of netnography research, participant-observational research that uses computer-mediated communications to study the behavior of members of an online group (Kozinets et al., 2010) and visual sociology research, where observations of human and their social behavior relies on photos and videos capture (Harper, 2012). With a little inventiveness or “bricolage” [making use of what one has – existing tools, materials, skills (Denzin and Lincoln, 1994)], one can conduct netnography using RQDA and other supporting applications such as spreadsheets or drawing tools (e.g. Microsoft Visio or draw.io). Future research can also explore the integration of RQDA and the positivist approach to qualitative research (i.e. the deductive-coding approach), an approach that supports theory testing, refinement, replication and elimination of alternative explanations. RQDA enables users to perform simple and advanced statistical analysis on coded materials, and this offers a new avenue to extend and enrich the current Eisenhardt approach. In particular, when users are analyzing case studies with “embedded designs” [i.e. multiple observations per each unit of analysis (Yin, 2003)], and if there are hundreds or thousands of observations to analyze in a study, then an RQDA-based Eisenhardt approach is a good option. Another opportunity is to combine the inductive RQDA-based constructivist approach and quantitative content analysis (Krippendorff, 2013). This requires the researcher to inductively code qualitative data and derive new concepts to create a coding scheme with quantitative measures (e.g. metric, ordinal or categorical); independent coders then code the same (and or additional) data sets to quantitatively confirm (or disconfirm) the tentative qualitative findings. In a rather similar fashion, a recent trend among content analysts involves using computer-aided text analysis (CATA) tools that transform words into numbers for statistical analysis [e.g. multiple regression or analysis of variance using Linguistic Inquiry and Word Count, Chandra, 2016; or DICTION software (Short and Palmer, 2007)]. This presents a new opportunity to combine CATA with CAQDAS, particularly RQDA, to offer a more holistic analysis of large corpuses of textual data. RQDA offers researchers with some knowledge of statistical programming in R an effective and innovative means to conduct mixed method and qualitative research under a single R platform. It offers a new avenue for existing R users to “cross over” to analyzing textual data as a primary or secondary research tool. Likewise, it offers computer-savvy scholars, students and independent researchers an opportunity to join the “CAQDAS movement” and to carry out and publish high-quality qualitative research. We believe that the time is ripe for a wider adoption of RQDA either as a stand-alone tool or in combination with other analytical tool(s). Note 1. We conducted a systematic literature search using a combination of key words “qualitative”, “qualitative method*”, “positivis*” and “interprevis*” via Google Scholar, JSTOR, Web of Science and direct search on 10 marketing journals which are Journal of Marketing, Journal of Marketing Research, Journal of Consumer Research, Journal of Academy of Marketing Science, Marketing Science, Marketing Letters, Journal of Business Research, Journal of Marketing Management, Journal of Strategic Marketing and Industrial Marketing Management. Only 90 articles from these sources are directly relevant to the analysis, and we used the insights derived from these journal articles to form our understanding of the nature of qualitative research in the field.
Methodology for qualitative research
115
QMR 20,1
Downloaded by CITY UNIVERSITY OF HONG KONG, Doctor Yanto Chandra At 17:42 09 January 2017 (PT)
116
References Altman, D.G. and Moher, D. (2013), “Declaration of transparency for each research article”, British Medical Journal, Vol. 347, p. f4796, available at: www.bmj.com/content/347/bmj.f4796.short Alvesson, M. and Kärreman, D. (2007), “Constructing mystery: empirical matters in theory development”, Academy of Management Review, Vol. 32 No. 4, pp. 1265-1281. Anderson, S. (2012), “A quick introduction to plyr”, available at: http://seananderson.ca/courses/12plyr/plyr_2012.pdf (accessed 7 November 2016). Arnheim, R. (1969), Visual Thinking, University of California Press, London. Arnould, E.J. and Wallendorf, M. (1994), “Market-oriented ethnography: interpretation building and marketing strategy formulation”, Journal of Marketing Research, Vol. 31 No. 4, pp. 484-504. Austin, J.L. (1975), How to Do Things with Words, Oxford University Press, Oxford. Basit, T. (2003), “Manual or electronic? The role of coding in qualitative data analysis”, Educational Research, Vol. 45 No. 2, pp. 143-154. Bazeley, P. (2002), “The evolution of a project involving an integrated analysis of structured qualitative and quantitative data: from N3 to Nvivo”, International Journal of Social Research Methodology, Vol. 5 No. 3, pp. 229-243. Bazeley, P. (2007), Qualitative Data Analysis with NVivo, Sage, London. Bazeley, P. and Jackson, K. (Eds) ( 2013), Qualitative Data Analysis with NVivo, Sage Publications, London. Belk, R.W. (Ed.) ( 2007), Handbook of Qualitative Research Methods in Marketing, Edward Elgar Publishing, Cheltenham, Gloucestershire. Belk, R.W., Ger, G. and Askegaard, S. (2003), “The fire of desire: a multisited inquiry into consumer passion”, Journal of Consumer Research, Vol. 30 No. 3, pp. 326-351. Blei, D.M. (2012), “Probabilistic topic models”, Communications of the ACM, Vol. 55 No. 4, pp. 55-65. Bolton, R.N. and Drew, J.H. (1991), “A multistage model of customers’ assessments of service quality and value”, Journal of Consumer Research, Vol. 17 No. 4, pp. 375-384. Buhalis, D. and Law, R. (2008), “Progress in information technology and tourism management: 20 years on and 10 years after the internet – the state of eTourism research”, Tourism Management, Vol. 29 No. 4, pp. 609-623. Chandra, Y. (2016), “A rhetoric-orientation view of social entrepreneurship”, Social Enterprise Journal, Vol. 12 No. 2, pp. 161-200. Chandra, Y., Jiang, L.C. and Wang, C.J. (2016), “Mining social entrepreneurship strategies using topic modeling”, PLoS One, Vol. 11 No. 3, pp. e0151342. Chen, Y., Fay, S. and Wang, Q. (2011), “The role of marketing in social media: how online consumer reviews evolve”, Journal of Interactive Marketing, Vol. 25 No. 2, pp. 85-94. Chevalier, J.A. and Mayzlin, D. (2006), “The effect of word of mouth on sales: online book reviews”, Journal of Marketing Research, Vol. 43 No. 3, pp. 345-354. Choi, B. and La, S. (2013), “The impact of corporate social responsibility (CSR) and customer trust on the restoration of loyalty after service failure and recovery”, Journal of Services Marketing, Vol. 27 No. 3, pp. 223-233. Choi, N. and Majumdar, S. (2014), “Social entrepreneurship as an essentially contested concept: opening a new avenue for systematic future research”, Journal of Business Venturing, Vol. 29 No. 3, pp. 363-376. Commuri, S. (2009), “The impact of counterfeiting on genuine-item consumers’ brand relationships”, Journal of Marketing, Vol. 73 No. 3, pp. 86-98. Corbyn, Z. (2012), “Misconduct is the main cause of life-sciences retractions”, Nature, Vol. 490 No. 7418, p. 21.
Cornelissen, J.P. (2016), “Preserving theoretical divergence in management research: why the explanatory potential of qualitative research should be harnessed rather than suppressed”, Journal of Management Studies, forthcoming.
Downloaded by CITY UNIVERSITY OF HONG KONG, Doctor Yanto Chandra At 17:42 09 January 2017 (PT)
Coviello, N. (2014), “How to publish qualitative entrepreneurship research in top journals”, in Fayolle, A. and Wrightm, M. (Eds), How to Get Published in the Best Entrepreneurship Journals: A Guide to Steer Your Academic Career, Edward Elgar, Cheltenham, pp. 167-182. Coviello, N.E. and Joseph, R.M. (2012), “Creating major innovations with customers: insights from small and young technology firms”, Journal of Marketing, Vol. 76 No. 6, pp. 87-104. Dabholkar, P.A. and Spaid, B.I. (2012), “Service failure and recovery in using technology-based self-service: effects on user attributions and satisfaction”, The Service Industries Journal, Vol. 32 No. 9, pp. 1415-1432. Daniel, S. and Stewart, K. (2016), “Open source project success: resource access, flow, and integration”, The Journal of Strategic Information Systems, Vol. 25 No. 3, pp. 159-176. Davis, N.W. and Meyer, B.B. (2009), “Qualitative data analysis: a procedural comparison”, Journal of Applied Sport Psychology, Vol. 21 No. 1, pp. 116-124. Denzin, N.K. and Lincoln, Y.S. (Eds) (1994), Handbook of Qualitative Research, Sage Publications, Thousand Oaks, CA, pp. 1-32. Denzin, N.K. and Lincoln, Y.S. (2005), “Introduction: the discipline and practice of qualitative research”, in Denzin, N.K. and Lincoln, Y.S. (Eds), The Sage Handbook of Qualitative Research, 3rd ed., Sage, Thousand Oaks, CA, pp. 1-32. Dubé, L. and Paré, G. (2003), “Rigor in information systems positivist case research: current practices, trends, and recommendations”, MIS Quarterly, Vol. 27 No. 4, pp. 597-636. Easton, G. (2010), “Critical realism in case study research”, Industrial Marketing Management, Vol. 39 No. 1, pp. 118-128. Eisenhardt, K.M. (1989a), “Making fast strategic decisions in high-velocity environments”, Academy of Management Journal, Vol. 32 No. 3, pp. 543-576. Eisenhardt, K.M. (1989b), “Building theories from case study research”, Academy of Management Review, Vol. 14 No. 4, pp. 532-550. Eisenhardt, K.M. and Graebner, M.E. (2007), “Theory building from cases: opportunities and challenges”, Academy of Management Journal, Vol. 50 No. 1, pp. 25-32. Ekiz, E., Khoo-Lattimore, C. and Memarzadeh, F. (2012), “Air the anger: investigating online complaints on luxury hotels”, Journal of Hospitality and Tourism Technology, Vol. 3 No. 2, pp. 96-106. Fang, F.C., Steen, R.G. and Casadevall, A. (2012), “Misconduct accounts for the majority of retracted scientific publications”, Proceedings of the National Academy of Sciences, Vol. 109 No. 42, pp. 17028-17033. Fereday, J. and Muir-Cochrane, E. (2006), “Demonstrating rigor using thematic analysis: a hybrid approach of inductive and deductive coding and theme development”, International Journal of Qualitative Methods, Vol. 5 No. 1, pp. 80-92. Franzosi, R., Doyle, S., McClelland, L.E., Putnam Rankin, C. and Vicari, S. (2013), “Quantitative narrative analysis software options compared: PC-ACE and CAQDAS (ATLAS. Ti, MAXqda, and NVivo)”, Quality & Quantity, Vol. 47 No. 6, pp. 3219-3247. Friese, S. (2011), “Using ATLAS.ti for analyzing the financial crisis data”, Forum Qualitative Sozialforschung/Forum: Qualitative Social Research, Vol. 12 No. 1. Gallie, W.B. (1955), “Essentially contested concepts”, Proceedings of the Aristotelian Society, Aristotelian Society, Wiley, London, Vol. 56, pp. 167-198. Gallie, W.B. (1956), “Art as an essentially contested concept”, The Philosophical Quarterly (1950), Vol. 6 No. 23, pp. 97-114.
Methodology for qualitative research
117
QMR 20,1
García-Horta, J.B. and Guerra-Ramos, M.T. (2009), “The use of CAQDAS in educational research: some advantages, limitations and potential risks”, International Journal of Research & Method in Education, Vol. 32 No. 2, pp. 151-165. Garriga, E. and Melé, D. (2004), “Corporate social responsibility theories: mapping the territory”, Journal of Business Ethics, Vol. 53 Nos 1/2, pp. 51-71.
Downloaded by CITY UNIVERSITY OF HONG KONG, Doctor Yanto Chandra At 17:42 09 January 2017 (PT)
118
Gebhardt, G.F., Carpenter, G.S. and Sherry, J.F., Jr. (2006), “Creating a market orientation: a longitudinal, multifirm, grounded analysis of cultural transformation”, Journal of Marketing, Vol. 70 No. 4, pp. 37-55. Gewin, V. (2014), “Retractions: a clean slate”, Nature, Vol. 507 No. 7492, pp. 389-391. Giesler, M. and Thompson, C.J. (2016), “Process theorization in cultural consumer research”, Journal of Consumer Research, forthcoming. Gilbert, L.S. (2002), “Going the distance: ‘closeness’ in qualitative data analysis software”, International Journal of Social Research Methodology, Vol. 5 No. 3, pp. 215-228. Gioia, D.A. and Chittipeddi, K. (1991), “Sensemaking and sensegiving in strategic change initiation”, Strategic Management Journal, Vol. 12 No. 6, pp. 433-448. Gioia, D.A., Corley, K.G. and Hamilton, A.L. (2013), “Seeking qualitative rigor in inductive research: notes on the Gioia methodology”, Organizational Research Methods, Vol. 16 No. 1, pp. 15-31. Goulding, C. (2005), “Grounded theory, ethnography and phenomenology”, European Journal of Marketing, Vol. 39 Nos 3/4, pp. 294-308. Grayson, K. and Shulman, D. (2000), “Indexicality and the verification function of irreplaceable possessions: a semiotic analysis”, Journal of Consumer Research, Vol. 27 No. 1, pp. 17-30. Grothendieck, G. (2014), “sqldf: perform SQL selects on R data frames”, available at: http://CRAN.Rproject.org/package⫽sqldf (accessed 7 November 2016). Hanson, D. and Grimmer, M. (2007), “The mix of qualitative and quantitative research in major marketing journals, 1993-2002”, European Journal of Marketing, Vol. 41 Nos 1/2, pp. 58-70. Harper, D. (2012), Visual Sociology, Routledge, Oxon. Holtgraves, T.M. (2013), Language as Social Action: Social Psychology and Language Use, Psychology Press, Mahwah, NJ. Homburg, C., Wilczek, H. and Hahn, A. (2014), “Looking beyond the horizon: how to approach the customers’ customers in business-to-business markets”, Journal of Marketing, Vol. 78 No. 5, pp. 58-77. Huang, R.G. (2014), “RQDA: r-based qualitative data analysis: R package version 0.2-7”, available at: http://rqda.r-forge.r-project.org (accessed: 18 November 2015). Hunt, S.D. (1991), “Positivism and paradigm dominance in consumer research: toward critical pluralism and rapprochement”, Journal of Consumer Research, Vol. 18 No. 1, pp. 32-44. Hunt, S.D. (1994), “On rethinking marketing: our discipline, our practice, our methods”, European Journal of Marketing, Vol. 28 No. 3, pp. 13-25. Huq, F.A., Chowdhury, I.N. and Klassen, R.D. (2016), “Social management capabilities of multinational buying firms and their emerging market suppliers: an exploratory study of the clothing industry”, Journal of Operations Management, Vol. 49 (September), pp. 19-37. Ihaka, R. and Gentleman, R. (1996), “R: a language for data analysis and graphics”, Journal of Computational and Graphical Statistics, Vol. 5 No. 3, pp. 299-314. Jackson, J. (2014), “R programming language gaining ground on traditional statistics packages”, available at: www.pcworld.com/article/2480920/r-programming-language-gaining-ground-ontraditional-statistics-packages.html (accessed 30 October 2015). James, D.A. and Falcon, S. (2011), RSQLite: SQLite interface for R. R package version 0.11, 1, available at: http://cran.r-project.org/web/packages/RSQLite
Downloaded by CITY UNIVERSITY OF HONG KONG, Doctor Yanto Chandra At 17:42 09 January 2017 (PT)
Jaworski, B.J. and Kohli, A.K. (1993), “Market orientation: antecedents and consequences”, The Journal of Marketing, Vol. 57 No. 3, pp. 53-70. Joireman, J., Smith, D., Liu, R.L. and Arthurs, J. (2015), “It’s all good: corporate social responsibility reduces negative and promotes positive responses to service failures among value-aligned customers”, Journal of Public Policy & Marketing, Vol. 34 No. 1, pp. 32-49. Karabag, S.F. and Berggren, C. (2016), “Misconduct, marginality and editorial practices in management, business and economics journals”, PloS One, Vol. 11 No. 7, e0159492. Kozinets, R.V. (2002), “The field behind the screen: using netnography for marketing research in online communities”, Journal of Marketing Research, Vol. 39 No. 1, pp. 61-72. Kozinets, R.V., Wilner, S., Wojnicki, A. and de Valck, K. (2010), “Networks of narrativity: understanding word-of-mouth marketing in online communities”, Journal of Marketing, Vol. 74 No. 2, pp. 71-89. Krippendorff, K. (2013), Content Analysis: An Introduction to its Methodology, Sage, California. Lamprinakis, L. (2012), “Organizational innovation and institutional change: the case of valio in Finland”, International Journal on Food System Dynamics, Vol. 3 No. 2, pp. 95-105. Langley, A. (1999), “Strategies for theorizing from process data”, Academy of Management Review, Vol. 24 No. 4, pp. 691-710. Langley, A. and Abdallah, C. (2011), “Templates and turns in qualitative studies of strategy and management”, in Berg, D.D. and Ketchen, D.J. (Eds), Building Methodological Bridges, Research Methodology in Strategy and Management, Emerald Group Publishing, Bingley, pp. 201-235. Leech, N.L. and Onwuegbuzie, A.J. (2011), “Beyond constant comparison qualitative data analysis: using NVivo”, School Psychology Quarterly, Vol. 26 No. 1, pp. 70-84. Liao, H. (2007), “Do it right this time: the role of employee service recovery performance in customer-perceived justice and customer loyalty after service failures”, Journal of Applied Psychology, Vol. 92 No. 2, p. 475. Lin, A.C. (1998), “Bridging positivist and interpretivist approaches to qualitative methods”, Policy Studies Journal, Vol. 26 No. 1, pp. 162-180. MacMillan, K. (2005), “More than just coding? Evaluating CAQDAS in a discourse analysis of news texts”, FORUM: Qualitative Social Research, Vol. 6 No. 3, available at: www.qualitative-research. net/fqs/fqs-eng.htm Malshe, A. (2009), “Strategic sales organizations: transformation challenges and facilitators within the sales–marketing interface”, Journal of Strategic Marketing, Vol. 17 Nos 3/4, pp. 271-289. Malshe, A., Al-Habib, M., Al-Torkistani, H. and Al-Khatib, J.A. (2013), “Challenges to sales force transformation in emerging markets”, Journal of Strategic Marketing, Vol. 21 No. 4, pp. 347-367. Mattila, A.S. (2001), “The effectiveness of service recovery in a multi-industry setting”, Journal of Services Marketing, Vol. 15 No. 7, pp. 583-596. Mattila, A.S. and Mount, D.J. (2003), “The impact of selected customer characteristics and response time on e-complaint satisfaction and return intent”, International Journal of Hospitality Management, Vol. 22 No. 2, pp. 135-145. Morse, J.M. and Richards, L. (2002), Read Me First for a User’s Guide to Qualitative Methods, Sage, Thousand Oaks, CA. Muhr, T. (1991), “Atlas/ti – a prototype for the support of text interpretation”, Qualitative Sociology, Vol. 14 No. 4, pp. 349-371. Nag, R., Corley, K.G. and Gioia, D.A. (2007), “The intersection of organizational identity, knowledge, and practice: attempting strategic change via knowledge grafting”, Academy of Management Journal, Vol. 50 No. 4, pp. 821-847. Nimon, K.F. and Oswald, F.L. (2013), “Understanding the results of multiple linear regression beyond standardized regression coefficients”, Organizational Research Methods, Vol. 16 No. 4, pp. 650-674.
Methodology for qualitative research
119
QMR 20,1
Downloaded by CITY UNIVERSITY OF HONG KONG, Doctor Yanto Chandra At 17:42 09 January 2017 (PT)
120
Ocasio, W. (1997), “Towards an attention-based view of the firm”, Strategic Management Journal, Vol. 18 (Summer), pp. 187-206. Oliveira, P. and Roth, A.V. (2012), “The influence of service orientation on B2B e-Service capabilities: an empirical investigation”, Production and Operations Management, Vol. 21 No. 3, pp. 423-443. Parasuraman, A., Zeithaml, V.A. and Berry, L.L. (1985), “A conceptual model of service quality and its implications for future research”, Journal of Marketing, Vol. 49 No. 4, pp. 41-50. Paulus, T.M. and Lester, J.N. (2016), “ATLAS.ti for conversation and discourse analysis studies”, International Journal of Social Research Methodology, Vol. 19 No. 4, pp. 405-428. Peters, L.D., Pressey, A.D., Vanharanta, M. and Johnston, W.J. (2013), “Constructivism and critical realism as alternative approaches to the study of business networks: convergences and divergences in theory and in research practice”, Industrial Marketing Management, Vol. 42 No. 3, pp. 336-346. Phipps, S. (2015), “The rise and rise of open source”, available at: www.infoworld.com/article/2914643/ open-source-software/rise-and-rise-of-open-source.html (accessed 21 November 2016). Pratt, M.G. (2008), “Fitting oval pegs into round holes: tensions in evaluating and publishing qualitative research in top North American journals”, Organizational Research Methods, Vol. 11, pp. 481-509. Pratt, M.G. (2009), “From the editors: for the lack of a boilerplate: tips on writing up (and reviewing) qualitative research”, Academy of Management Journal, Vol. 52 No. 5, pp. 856-862. Ramoglou, S. and Tsang, E. (2015), “A realist perspective of entrepreneurship: opportunities as propensities”, Academy of Management Review, Vol. 41 No. 3, pp. 410-434. Reficco, E. and Jaén, M.H. (2015), “Case method use in shaping well-rounded Latin American MBAs”, Journal of Business Research, Vol. 68 No. 12, pp. 2540-2551. Robertson, N. (2012), “Self-service technology complaint channel choice: exploring consumers’ motives,” Managing Service Quality: An International Journal, Vol. 22 No. 2, pp. 145-164. Roschk, H. and Gelbrich, K. (2014), “Identifying appropriate compensation types for service failures a meta-analytic and experimental analysis”, Journal of Service Research, Vol. 17 No. 2, pp. 195-211. Saillard, E.K. (2011), “Systematic versus interpretive analysis with two CAQDAS packages: NVivo and MAXQDA”, Forum Qualitative Sozialforschung/Forum: Qualitative Social Research, Vol. 12 No. 1. Sarmah, S.P., Acharya, D. and Goyal, S.K. (2006), “Buyer vendor coordination models in supply chain management,” European Journal of Operational Research, Vol. 175 No. 1, pp. 1-15. Schmid, S., Grosche, P. and Mayrhofer, U. (2016), “Configuration and coordination of international marketing activities”, International Business Review, Vol. 25 No. 2, pp. 535-547. Schwarzkopf, D., Behrend, S., Skupin, H., Westermann, I., Riedemann, N.C., Pfeifer, R., Günther, A., Witte, O.W., Reinhart, K. and Hartog, C.S. (2013), “Family satisfaction in the intensive care unit: a quantitative and qualitative analysis”, Intensive Care Medicine, Vol. 39 No. 6, pp. 1071-1079. Short, J.C., and Palmer, T.B. (2007), “The application of DICTION to content analysis research in strategic management,” Organizational Research Methods, Vol. 11 No. 4, pp. 727-752. Short, J.C., Moss, T.W. and Lumpkin, G.T. (2009), “Research in social entrepreneurship: past contributions and future opportunities”, Strategic entrepreneurship journal, Vol. 3 No. 2, pp. 161-194. Sinkovics, R.R. and Alfoldi, E.A. (2012), “Progressive focusing and trustworthiness in qualitative research”, Management International Review, Vol. 52 No. 6, pp. 817-845. Sinkovics, R.R., Penz, E. and Ghauri, P.N. (2005), “Analysing textual data in international marketing research”, Qualitative Market Research: an International Journal, Vol. 8 No. 1, pp. 9-38. Sinkovics, R.R., Penz, E. and Ghauri, P.N. (2008), “Enhancing the trustworthiness of qualitative research in international business”, Management International Review, Vol. 48 No. 6, pp. 689-714.
Sobh, R. and Perry, C. (2006), “Research design and data analysis in realism research”, European Journal of Marketing, Vol. 40 Nos 11/12, pp. 1194-1209. Sotiriadou, P., Brouwers, J. and Le, T.A. (2014), “Choosing a qualitative data analysis tool: a comparison of NVivo and Leximancer”, Annals of Leisure Research, Vol. 17 No. 2, pp. 218-234.
Methodology for qualitative research
Downloaded by CITY UNIVERSITY OF HONG KONG, Doctor Yanto Chandra At 17:42 09 January 2017 (PT)
Strauss, A. and Corbin, J. (1990), Basics of Qualitative Research, Vol. 15, Sage, Newbury Park, CA. Thompson, C.J. (1997), “Interpreting consumers: a hermeneutical framework for deriving marketing insights from the texts of consumers’ consumption stories”, Journal of Marketing Research, Vol. 34 No. 4, pp. 438-455. Tsang, E.W. (2014), “Case studies and generalization in information systems research: a critical realist perspective”, The Journal of Strategic Information Systems, Vol. 23 No. 2, pp. 174-186. Tsoukas, H. (2016), “Don’t simplify, complexify: from disjunctive to conjunctive theorizing in organization and management studies”, Journal of Management Studies, forthcoming. Vaccaro, A. and Palazzo, G. (2015), “Values against violence: institutional change in societies dominated by organized crime”, Academy of Management Journal, Vol. 58 No. 4, pp. 1075-1101. Van de Ven, A.H. and Engleman, R.M. (2004), “Event and outcome-driven explanations of entrepreneurship”, Journal of Business Venturing, Vol. 19 No. 3, pp. 343-358. Vance, A. (2009a), “R you ready for R?”, NY Times Blog, available at: http://bits.blogs.nytimes.com/ 2009/01/08/r-you-ready-for-r/ (accessed: 8 September 2016). Vance, A. (2009b), “Data analysts captivated by R’s power”, New York Times, available at: www. nytimes.com/2009/01/07/technology/business-computing/07program.html?pagewanted⫽all&_ r⫽0 (accessed: 21 November 2015). Vanwindekens, F.M., Stilmant, D. and Baret, P.V. (2013), “Development of a broadened cognitive mapping approach for analysing systems of practices in social – ecological systems”, Ecological Modelling, Vol. 250 (February), pp. 352-362. Wang, D., Yan, K.K., Rozowsky, J., Pan, E. and Gerstein, M. (2016), “Temporal dynamics of collaborative networks in large scientific consortia”, Trends in Genetics, Vol. 32 No. 5, pp. 251-253. Weller, M. (2011), The Digital Scholar: How Technology is Transforming Scholarly Practice, Bloomsbury Academic, London. Woods, M., Paulus, T., Atkins, D.P. and Macklin, R. (2015a), “Advancing qualitative research using qualitative data analysis software (QDAS)? Reviewing potential versus practice in published studies using ATLAS.ti and NVivo, 1994-2013”, Social Science Computer Review, Vol. 34 No. 5, doi: 0894439315596311. Woods, M., Macklin, R. and Lewis, G.K. (2015b), “Researcher reflexivity: exploring the impacts of CAQDAS use”, International Journal of Social Research Methodology, Vol. 19 No. 4, pp. 1-19. Yang, S.S.J. and Chandra, Y. (2013), “Growing artificial entrepreneurs: advancing entrepreneurship research using agent-based simulation approach”, International Journal of Entrepreneurial Behavior & Research, Vol. 19 No. 2, pp. 210-237. Ye, B. (2010), “Using RQDAtm and tm to do text-mining”, available at: http://rqda.r-forge.r-project.org/ Using_RQDA2tm.pdf (accessed 19 November 2015). Ye, Q., Law, R., Gu, B. and Chen, W. (2011), “The influence of user-generated content on traveler behavior: an empirical investigation on the effects of e-word-of-mouth to hotel online bookings”, Computers in Human Behavior, Vol. 27 No. 2, pp. 634-639. Yin, R. (2003), Case Study Research: Design and Methods, Sage Publications, California. Further reading Friese, S. (2013), ATLAS.ti User Guide and Reference, Atlas GmbH, Berlin. Friese, S. (2014), Qualitative Data Analysis with ATLAS.ti, Sage, London.
121
QMR 20,1
Downloaded by CITY UNIVERSITY OF HONG KONG, Doctor Yanto Chandra At 17:42 09 January 2017 (PT)
122
Graebner, M.E. and Eisenhardt, K.M. (2004), “The seller’s side of the story: acquisition as courtship and governance as syndicate in entrepreneurial firms”, Administrative Science Quarterly, Vol. 49 No. 3, pp. 366-403. Nag, R. and Gioia, D.A. (2012), “From common to uncommon knowledge: foundations of firm-specific use of knowledge as a resource”, Academy of Management Journal, Vol. 55 No. 2, pp. 421-457. Ozcan, P. and Eisenhardt, K.M. (2009), “Origin of alliance portfolios: entrepreneurs, network strategies, and firm performance”, Academy of Management Journal, Vol. 52 No. 2, pp. 246-279. Tracey, P., Phillips, N. and Jarvis, O. (2011), “Bridging institutional entrepreneurship and the creation of new organizational forms: a multilevel model”, Organization Science, Vol. 22 No. 1, pp. 60-80. About the authors Yanto Chandra, PhD, is an Assistant Professor at the Department of Public Policy at the City University of Hong Kong. His research interests include social, sustainable, developmental entrepreneurship, social investment and entrepreneurship, in general. Methods of interest: computer-aided text analysis, corpus linguistics, text mining, scientometrics; qualitative and visual methods. He serves on the editorial board of the Journal of Social Entrepreneurship, Social Enterprise Journal, Journal of International Marketing and Journal of Data Mining & Digital Humanities. He has published in Journal of Social Entrepreneurship, Social Enterprise Journal, PLos ONE, Asia Pacific Journal of Management, Journal of World Business, Journal of International Marketing, Technovation, among others. Previously, he was an Assistant Professor at the University of Amsterdam and University of Leeds, and has 7 years of work experience in large multinational companies. Yanto Chandra is the corresponding author and can be contacted at:
[email protected] Liang Shang is a PhD candidate in Public Policy and Management at the Department of Public Policy, at the City University of Hong Kong, after completing a degree in Social Policy and Administration at the Hong Kong Polytechnic University. Her research focuses on social entrepreneurship, non-profit organizations and civil society, in general. She is an experienced RQDA user.
For instructions on how to order reprints of this article, please visit our website: www.emeraldgrouppublishing.com/licensing/reprints.htm Or contact us for further details:
[email protected]