nodes that know their absolute coordinates, called anchor nodes. While many .... anchors. Here, we explore the effect of anchor node placement within the network. 1 ...... http://www.mathworks.com/help/toolbox/stats/procrustes.html,. 2010.
Anchor Node Placement for Localization in Wireless Sensor Networks
by
Benjamin Tatham
A Dissertation submitted to the Faculty of Graduate Studies and Research in partial fulfilment of the requirements for the degree of Master of Applied Science
Ottawa-Carleton Institute for Electrical and Computer Engineering
Department of Systems and Computer Engineering Carleton University Ottawa, Ontario, Canada November 2010
c Copyright 2010 - Benjamin Tatham
ii
The undersigned recommend to the Faculty of Graduate Studies and Research acceptance of the Dissertation
Anchor Node Placement for Localization in Wireless Sensor Networks
Submitted by Benjamin Tatham in partial fulfilment of the requirements for the degree of Master of Applied Science
Dr. Thomas Kunz, Supervisor
Dr. H.M. Schwartz, Department Chair
Carleton University 2010
iii
Abstract Applications of wireless sensor network (WSN) often expect knowledge of the precise location of the nodes. One class of localization protocols patches together relativecoordinate, local maps into a global-coordinate map. These protocols require some nodes that know their absolute coordinates, called anchor nodes. While many factors influence the node position errors, in this class of protocols, the placement of the anchor nodes can significantly impacts the error. Through simulation, using the Curvilinear Component Analysis (CCA-MAP) protocol, we show the impact of anchor node placement and a set of rules to ensure the best possible outcome, while using the smallest number of anchor nodes possible. Scientists and researchers are thus enabled to focus on the sensed data with confidence in the node localization results.
iv
Dedicated to my wife and children who supported me through the long process of this research.
v
Acknowledgments I would like to thank Professor Thomas Kunz for his guidance and encouragement that made this research possible. Further, I would like to thank Li Li whom, along with Professor Kunz, performed the initial CCA research and wrote the basis for the Matlab simulations used in this thesis. Finally, my colleagues Shafagh Alikhani and Ben Gardiner who provided a tireless ear to listen to ideas throughout the process.
vi
Table of Contents
Abstract
iv
Acknowledgments
vi
Table of Contents
vii
1 Introduction
1
1.1
Motivation . . . . . . . . . . . . . . . . . . . . . . . . . . . . . . . . .
2
1.2
Thesis Contribution . . . . . . . . . . . . . . . . . . . . . . . . . . . .
4
1.3
Methodology . . . . . . . . . . . . . . . . . . . . . . . . . . . . . . .
5
1.4
Thesis Organization . . . . . . . . . . . . . . . . . . . . . . . . . . . .
5
2 Overview of Wireless Sensor Networks and Localization
6
2.1
Wireless Sensor Networks . . . . . . . . . . . . . . . . . . . . . . . .
6
2.2
Localization Protocols . . . . . . . . . . . . . . . . . . . . . . . . . .
7
2.2.1
Ad Hoc Positioning System . . . . . . . . . . . . . . . . . . .
8
2.2.2
MDS-MAP . . . . . . . . . . . . . . . . . . . . . . . . . . . .
9
2.2.3
CCA-MAP . . . . . . . . . . . . . . . . . . . . . . . . . . . .
9
3 Related Work on Anchor Node Placement
11
3.1
Empirical Evidence . . . . . . . . . . . . . . . . . . . . . . . . . . . .
11
3.2
Explicit Studies of Anchor Node Placement . . . . . . . . . . . . . . .
12
vii
4 Optimal Anchor Node Placements
14
4.1
Measuring Location Error . . . . . . . . . . . . . . . . . . . . . . . .
14
4.2
Coordinate Transformation . . . . . . . . . . . . . . . . . . . . . . . .
15
4.3
Methodology . . . . . . . . . . . . . . . . . . . . . . . . . . . . . . .
17
4.4
Sequence of Hypotheses . . . . . . . . . . . . . . . . . . . . . . . . .
17
4.4.1
Anchor Node Error . . . . . . . . . . . . . . . . . . . . . . . .
17
4.4.2
Network Area Coverage . . . . . . . . . . . . . . . . . . . . .
21
4.4.3
Anchor Node Triangle . . . . . . . . . . . . . . . . . . . . . .
23
Best Anchor Node Placement . . . . . . . . . . . . . . . . . . . . . .
23
4.5
5 The Outlier Anchor Node Placements
26
5.1
The Cause . . . . . . . . . . . . . . . . . . . . . . . . . . . . . . . . .
26
5.2
Avoid Outliers . . . . . . . . . . . . . . . . . . . . . . . . . . . . . . .
26
5.3
Outlier Indicators . . . . . . . . . . . . . . . . . . . . . . . . . . . . .
29
6 Other Factors 6.1
31
Evidence of Other factors . . . . . . . . . . . . . . . . . . . . . . . .
31
List of References
34
c Appendix A Matlab Simulation Code
37
viii
List of Figures
ix
Chapter 1
Introduction Scientists, engineers, and researchers use wireless sensor networks (WSN) for a wide array of applications. Many of these applications rely on knowledge of the precise position of each node. While some may only require relative coordinates within the network, most biological, geophysical, and other scientific applications require coordinates on a global coordinate system. Perhaps the obvious solution is for each node in the network to be equipped with GPS or other location positioning services. However, constraints on cost, power consumption, as well as visibility of satellites dictate the need for an alternative solution. Many protocols have been proposed [1–3] to calculate relative positions amongst the nodes of a network. They vary in the required network functionality in terms of radio ranging or range-free. Radio ranging involves specialized hardware to measure the distance between nodes based on physical data like signal strength or transmission delays. In order to convert from relative to global coordinates, some of the nodes require a local source of global coordinates. This can be achieved by operators recording the global coordinates during network deployment, by embedding a GPS receiver in a subset of the nodes, or some other source. We call these enhanced nodes anchors. Here, we explore the effect of anchor node placement within the network
1
2 on the overall localization errors, on a network-wide basis. This provides network planners with a set of general rules to minimize the number of anchor nodes required while avoiding poor node localization, allowing scientists to assume a maximum position error during their own research. Further, based on application requirements of location accuracy, planners can minimize the cost of the network associated with anchor nodes by using the minimum number and best position.
1.1
Motivation
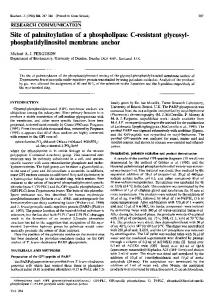
During previous work designing localization protocols [4, p. 11] [2, p.2 ], authors often choose anchors at random within the network. Frequently, they simulate the network multiple times with different anchors in order to statistically exclude anchor node placement from their results. Our initial investigations and simulations demonstrate that indeed the placement of anchor nodes in the network did have an often dramatic effect on the location error. The four plots shown in Figure 1.1 graphically establish that anchor node position does make a difference. Each plot is the same network with a different choice of three anchors. A line is drawn between the actual and calculated position of each node. The circles show the radio range of each anchor, and a triangle is drawn between the three anchors for clarity. The four plots shown are taken from a set of 100 randomly chosen anchor sets. While the first two choices have reasonable errors, the the third more than twice the mean error of the first. Further, the fourth choice has an extremely poor performance more than ten times that of the first. The four anchor set triangles shown do not immediately show an obvious progression that could explain this dramatic change in error. We find it interesting that there is an incremental increase in error between
3
10
10
9
9
8
8
7
7
6
6
5
5
4
4
3
3
2
2
1
1
0
0
1
2
3
4
5
6
7
8
9
10
0
9
8
8
7
7
6
6
5
5
4
4
3
3
2
2
1
1
2
3
4
5
6
7
(b) Anchor Set 2
9
1
2
(a) Anchor Set 1 10
0
1
Max error: 0.586r Mean error: 0.239r
10
0
0
Max error: 0.587r Mean error: 0.193r
3
4
5
6
7
8
9
10
0
0
1
2
3
4
5
6
7
Max error: 1.061r Mean error: 0.462r
Max error: 6.835r Mean error: 2.613r
(c) Anchor Set 3
(d) Anchor Set 4
8
9
10
8
9
10
Figure 1.1: Location error for 100 anchor set choices in the same network
4 these four anchor sets resulting in a full order of magnitude difference between good and bad cases, and thus requires the further investigation presented in this thesis. In practical applications, scientists and engineers do not have the luxury of running their localization protocols multiple times to determine the best location. In fact, this would defeat the purpose of the localization protocol in the first place. Therefore, it is critical to be able to assign a maximum location error to all the nodes in a network so that data processing that relies on location can effectively take the location error into account.
1.2
Thesis Contribution
We establish that by avoiding certain poor anchor node placements, extremely poor location errors can be avoided. Further, we demonstrate that other than these edge cases, the location error falls within a statistically insignificant range, where the range is a function of network connectivity and topology. Specifically, we show that the probability of extremely high location error result from anchor nodes being roughly in a geographically straight line. As the anchor nodes are spread out from a straight line, the probability of high errors decreases, leaving network designers a relatively simple chore when choosing anchor nodes locations. While some papers have touched upon anchor node placement, we have yet to come across a comprehensive study of the optimal anchor node placement. This paper provides a comprehensive study of possible anchor node placements and their differing effects on overall network localization accuracy. While this paper is a comprehensive study of anchor node placements, we focus on specific set of network design assumptions. First, we assume the network planners want to minimize the number of anchors since they consume more power and cost
5 more. Therefore, we assume the minimum number of anchors of three to provide twodimensional coordinates. Further, we assume that range-free algorithms are preferred to avoid dealing with multi-path and other radio effects as well as to limit the required hardware and power requirements on each node in the network.
1.3
Methodology
Many localization protocols and algorithms provide a set of relative coordinates that are then transformed into global coordinates.
For the purpose of this research,
we chose CCA-MAP [3, 4] as the algorithm to provide simulation results. A Matc lab simulation of this algorithm already existed from Li Li [3], and was modified to provide the necessary output statistics presented here. CCA-MAP is described in more detail in 2.2.3 on page 9.
1.4
Thesis Organization
A brief background of Wireless Sensor Networks and localization protocols in general are presented in Chapter 2. Chapter 3 presents the limited related work in anchor node placement. Chapter 4 contains the various anchor node placements and summaries of how they perform. The cause of the extreme edge cases comes to light in Chapter 5, along with a discussion of the Procrustes algorithm. Chapter 6 presents conclusions and future work.
Chapter 2
Overview of Wireless Sensor Networks and Localization
2.1
Wireless Sensor Networks
A wireless sensor network (WSN) consists of a set of nodes tasked with sensing environmental phenomenon at or near each node. Nodes communicate via radios to send their data back to a central acquisition system. Nodes are typically small, cheap devices and are designed with power efficiency in mind to prolong the lifetime of the network’s ability to collect data. Nodes are often distributed in the field of interest randomly, sometimes even by dropping them from the air, as on a military battlefield. Other times, they are placed in specific, but unknown a priori, locations, as in placing them in bird nests [5]. Or, they may be rolled into a transportation tunnel to give firefighters and emergency crews current information about heat and oxygen levels [6]. The list of applications goes on and on. A number of issues arise when designing a WSN. Each node must be able to communicate with each other and send data to a central collection site. Each node must know what time it is, for purposes of data sampling, and often for routing
6
7 protocols as well. Further, each node must know where it is so spatial data can be properly correlated. Location can also be useful for geographic routing protocols. This thesis focuses on determining the location of each node as accurately as possible.
2.2
Localization Protocols
There are two general classes of localization protocols: ranging and range-free. Ranging protocols rely on information from the radio. With this information, a fairly accurate network topology can be built. Ranging techniques can use a variety of metrics to build the network topology. These include Time-of-Arrival (TOA), like GPS [7], Time-Differential-of-Arrival (TDOA) [8], Angle-of-Arrival (AOA) [9], or Received-Signal-Strength-Indicator (RSSI) [10]. However, the special hardware and power requirement to perform these ranging techniques is counter to the goal of low-cost, low-power nodes, and thus we exclude ranging protocols from our study. Regardless, if a ranging protocol does build a relative map, and then does a post processing step by mapping this relative map to a global map based on a subset of anchor nodes, the results of this thesis apply to ranging as well as range-free protocols. Range-free protocols do not rely on any specialized hardware for additional information. Rather, they rely solely on network connectivity, specifically knowledge of their direct neighbors. Often, a node will collect information about their direct neighbors’ neighbors as well, known as two-hop information. Knowledge of each further node requires more information to be shared and there transmitted between nodes, thus requiring more power for radio transmission. It is for this reason that only one-hop or possibly two-hop knowledge is preferred.
8
2.2.1
Ad Hoc Positioning System
Niculesu, et al. propose a distributed localization algorithm known as Ad Hoc Positioning System (APS) [1]. It is similar to GPS in that is uses triangulation to determine node position. In APS, each node maintains a table of distances to each anchor. The distance can be represented as a hop count, estimated distance using RSSI, or Euclidean distance. As a distributed algorithm, each node determines its own position based on the distances to the anchor nodes. Thus, APS does not perform well in anisotropic network, that is networks with holes or ”C” shapes in the topology, because the communication distance can be far greater than the geometric distance between two nodes. In its simplest form, APS uses a propagation technique called DV-HOP to determine distances between nodes. DV-HOP is based on classical distance vector exchange from general network protocols like TCP/IP. Each node maintains a table of hop counts between all known nodes. Each node exchanges this table only with its direct neighbors. When an anchor has discovered a hop count to another anchor, the anchor estimates the average distance for each hop since it knows the absolute location of itself and the other anchor. This correction factor is sent to the entire network. DV-HOP thus minimizes the amount of data that must be transmitted in the network. Further, APS can employ a propagation technique called DV-distance.
DV-
distance is similar to DV-hop except that it uses RSSI to determine each hop distance and sends this distance instead of hop count. This difference allows DV-distance to effectively detect holes and curves in the network as each anchor can see that the transmission path between them is larger than the Euclidean distance.
9
2.2.2
MDS-MAP
Shang, et al. attempt to correct the errors introduced by APS and other distributed algorithms through a centralized localization algorithm called MDS-MAP(C) [2]. MDS-MAP(C) is divided into three phases. In phase one, shortest path distances or hop counts are exchanged via distance vector exchange, similar to APS. This provides a rough estimate of the distance between each pair of sensors. In phase two, multi-dimensional scaling (MDS) is applied, resulting in a relative map. MDS is a general data analysis tool originating from psychophysics to transform data from many to few dimensions. In simple terms, MDS takes a set of distances between points and creates a structure that fits those distances. Often, it is used for general data visualization. In this case, the relative map conforms closely to the pair-wise distances provided. In phase three of MDS-MAP(C), the relative map is transformed into a global coordinate system using at least three anchors using the Procrustes algorithm. Procrustes is described in more detail in Section 4.2. The authors provided a modified, distributed version, MDS-MAP(P) [11]. This variation simply divides the network into smaller, more manageable sections to the algorithm can be performed locally, with the limited node resources available. Each local map is then merged together, although this part of the algorithm is not distributed. Local map merging begins at a randomly selected node’s local map, and chooses the local map with the most overlapping nodes. The process continues until all the local maps are merged together.
2.2.3
CCA-MAP
Li, et al, propose a similar style algorithm to MDS-MAP called CCA-MAP [3, 4]. It is similar in that it generates relative, local maps of sections of the network and then patches them together into a global coordinate system. CCA-MAP improves
10 on MDS-MAP in that the algorithm is more efficient. MDS is a non-linear reduction algorithm and has a computational cost of O(n3 ). CCA [12] on the other hand, is a self-organized neural network performing quantization and non-linear projection. CCA-MAP has a total computational cost of O(n2 ). CCA runs in a series of iterations, where each iteration has a computational cost of O(n). CCA-MAP has four phases. In the first phase, each node builds a local map of nodes within R hops. For that local map, the shortest distance matrix is accumulated, as in APS and MDS-MAP. The second phase involves performing the CCA algorithm itself on each local map, generating relative coordinates for each node in the local map. In phase three, the local maps are merged together, as in MDS-MAP(P), and finally, in phase four, the relative coordinates are transformed into absolute coordinates based on the known coordinates of the anchor nodes, as described in Section 4.2. Phase four can only be performed with a minimum of three anchors for 2D space or four anchors for 3D space. CCA-MAP is flexible as to where computations can be performed. Local map calculations can be performed at the nodes themselves, if computing resources allow, or outsourced to more powerful gateway nodes or a central server. Local map merging can be performed in parallel at selected nodes in the network, or again at a central server. Further, if in any sub-map sufficient anchors are found, then absolute coordinates can be calculated.
Chapter 3
Related Work on Anchor Node Placement While much attention has been paid to localization accuracy and computational effort, anchor node placement is often recognized, but dismissed as future study.
3.1
Empirical Evidence
Often, authors will come across anchor placement by accident and discuss it based on their own empirical evidence. Shang, et al. [2, p. 964] and Li, et al. [3, p. 11] both choose anchors at random within the network. Although, Shang does mention that a co-linear set of anchors chosen in one example ”represents a rather unlucky selection”, without supporting evidence of why this is unlucky. Earlier work by Doherty, et al. [13] requires anchor nodes to be placed at the edges, and ideally at the corners of the network. In this case, however, the algorithm is a simple constraint problem. One constraint requires that all the unknown nodes be places within the convex hull of the anchors, and therefore, better results are obtained when anchors are at the corners.
11
12
3.2
Explicit Studies of Anchor Node Placement
While few, there have been a some explicit studies of anchor node placement. Hara, et al. [14] propose a method of choosing anchor node locations to achieve a specific accuracy target. The proposal, however, only applies to rectangular network areas and that anchor nodes must be placed at the center of a sub-rectangle of the original rectangle when divided into equal sized rectangles. Further, it assumes simple RSSIbased localization. Ash, et al. [15] provide analytical proof that placing anchor nodes uniformly around the perimeter of a network proves the best results, in the absence of any other information about the sensor node positions. However, again this assumes a rectangular network, and more importantly a simple localization algorithm like [13] or other multi-lateration techniques. When using all inter-node distances at once, as in MDS-MAP and CCA-MAP, this analysis breaks down. Karl and Willig dedicate an, albeit short, sub-chapter to the Impact of anchor placement in their book [16, p. 247-248]. Referencing [13] and [17], again they defer to perimeter anchor placement as the optimal choice. Unfortunately, the technique proposed involves adaptive deployment, whereby a mobile node with absolute positioning available, like GPS, wanders through the network and attempts to determine the optimal anchor placements as it travels. For the purposes of a priori planning, this technique is not feasible. Cheng, et all. [18] present a novel technique to handle the effects of adverse anchor placement, specifically in clumps. The algorithm, HyBloc, is a hybrid of MDS and proximity-distance map (PDM) [19]. It works by using MDS to add artificial, secondary anchor nodes using MDS to improve the performance of PDM, since on its own, MDS can adequately and efficiently determine the position of a few nodes based on arbitrarily place primary anchor nodes. PDM is shown to a be good choice
13 for anisotropic networks. Other studies also focus on the effect of indoor conditions and anchor placement as it relates to RSSI and other radio propagation measurements [20].
Chapter 4
Optimal Anchor Node Placements
4.1
Measuring Location Error
Before searching for the best anchor node placement we must first define what best means, in terms of location error. First of all, location error is measured as a factor of radio radius (or range). Since this study addresses range-free networks, and thus relies solely on network connectivity, the actual units of distance do not matter for general study. What is important to the protocol is how many other nodes in the network fall within the radio radius of a given node. The average numbers of nodes within range of a each node is known as connectivity. Every network has its own application requirements, and thus there are many options for what statistics to examine for accessing the quality of locations. The simplest criteria is to look at the mean location error across all nodes in the network. For the most part, this is the basis for the results in this study. However, this assumes that all nodes in the network must be used in the final results. If the network designers know which nodes have poor locations, they may wish to exclude these nodes from the final results. Therefore, if the economics of the network deployment allow, it may be beneficial to look at the best, for example, 80% of nodes in the network. In practice,
14
15 the designers do not know which nodes to exclude, so this study also attempts to identify the worst areas of a network for location accuracy, depending on the anchor node placement.
4.2
Coordinate Transformation
To understand the various hypotheses for the best anchor placement, a basic understanding of how the transformation from local to global coordinate systems must be explained. After the local networks have been calculated and patched together into a single cohesive network, the anchor nodes are then used. Using Procrustes [21] analysis, a linear transformation of translation, reflection, orthogonal rotation, and scaling is determined for the anchor nodes from the calculated to known coordinates. The transformation is chosen my minimizing the sum of squared errors for the resulting coordinates. Specifically, given X real points and Y mapped points for the anchors, Procrustes gives a transformation as shown in Equation 4.1 that minimizes the difference between Y and the transformed points Z.
Z =b∗Y ∗T +c
(4.1) where b is a scalar,
T is the rotation/reflection component, and c is the translation component. For example, take a random anchor set, as shown in Figure 4.1.
16 20 Real Points Mapped Points 18
16
14
12
10
8
6
4
2
0
0
2
4
6
8
10
12
14
16
18
20
Figure 4.1: The sample network used in this chapter, showing connectivity between nodes
2.5714 14.6615 " # −0.6621 −0.7494 16.7334 7.7612 = 1.5887 + (4.2) 14.6277 0.7151 Y . . 0.7494 −0.6621 .. .. 4.9257 2.8442 The transformation is then applied to all nodes in the network. Therefore, how well the anchor nodes represent the overall calculated network variability, the better the final locations will be.
17
4.3
Methodology
For the purposes of testing each hypothesis, randomly generated networks of varying sizes are used. Unless otherwise specified, all nodes are randomly placed within a square area with an overall density of one node per unit area. For example, a ten by ten square area will have 100 randomly placed nodes. Anchor sets are chosen by identifying all possible sets via n choose k, where n is the number of nodes in the network and k is the number of nodes per anchor set. From the total set of possible anchor sets, a random selection is made. This method excludes the possibility of choosing the same anchor set more than once. c To view all the Matlab code for simulations and plots see Appendix A.
4.4
Sequence of Hypotheses
Almost as important as knowing which factors effect localization is knowing which factors to ignore. The following is a summary of hypotheses of anchor node placement factors that show no or little significant correlation to location error. The data in the following graphs is taken from a random selection of 1000 anchor sets of three nodes each for the network shown in Figure 4.2. The node placement is random within the 20 by 20 square unit area, and all nodes have a radio range of 2.5 units, providing a completely connected network.
4.4.1
Anchor Node Error
The first hypothesis is to choose nodes as anchors that we expect to have high location accuracy. Because we are trying to provide an a priori design technique for network planners, the information chosen to reach the goal must be something the network planner can determine before any localization has been performed. For this purpose
18
Random 20x20 Square with 400 nodes Radio Range: 2.5
20 18 16 14 12 10 8 6 4 2 0
0
2
4
6
8
10
12
14
16
18
20
Figure 4.2: The sample network used in this chapter, showing connectivity between nodes
19 we choose the number of one-hop neighbors. Since the range-free algorithms depend heavily on network connectivity, the theory is that nodes with more neighbors will have lower location errors. The lower error in the anchors themselves should then translate into a more accurate transformation of the entire network. Figure 4.3a plots the sum of unique one-hop neighbors for all anchor nodes versus mean localization error. The irregularity of the curve disproves the hypothesis. Further, the correlation coefficient, with 95% confidence intervals, is extremely low, less than 0.1. The corresponding low p-value of 0.03 tells us that the confidence in the lack of correlation is extremely high. Specifically, the p-value is the probability of getting a correlation as large as the measured value 0.07 by random chance, when the true correlation is zero. Having more neighbors means that the error of the anchor node itself has a better calculated location accuracy, but this does not translate into better network-wide accuracy. Further, Figure 4.3c shows the mean error of the three anchor nodes versus the mean error for all nodes in the network. Again, we have an erratic plot which disproves even the foundation of this hypothesis, namely that the location of the anchor node itself has absolutely no bearing on the overall network error. And again, the correlation coefficient is low at less than 0.15, proving again the lack of correlation, statistically. In both plots, it is clear that a small subset of the anchor placements lead to far greater error than the norm. Later, we will explore the cause of these outliers, but for the time being, we exclude them from the analysis as shown in Figure 4.3b and Figure 4.3d. Determining which points are outliers is quite obvious since the gap between the normal case and the small set of outliers is distinct. Therefore, rather then using a statistical calculation for the exclusion, all anchor sets with mean location error greater than two are excluded.
20
Network Random 20x20 Square with 400 nodes Excluding errors >2.0
Network Random 20x20 Square with 400 nodes 8 Number of Anchors Unique Neighbors Correlation Coefficient=−0.07 p−value=0.03
1
2
Line of best fit, 1st order (r : 0.00)
Number of Anchors Unique Neighbors Correlation Coefficient=−0.13 p−value=0.00
0.9
6
Mean Location Error (factor of radio radius)
Mean Location Error (factor of radio radius)
7
5
4
3
2
1
Line of best fit, 1st order (r2: 0.02)
0.8
0.7
0.6
0.5
0.4
0.3
0.2
0 20
30
40
50 60 70 Number of Anchors Unique Neighbors
80
0.1 20
90
30
40
50 60 70 Number of Anchors Unique Neighbors
80
90
(a) Number of Anchor Neighbors vs Location Error(b) Number of Anchor Neighbors vs Location Error Excluding Outliers Network Random 20x20 Square with 400 nodes Excluding errors >2.0
Network Random 20x20 Square with 400 nodes 8 Mean of Anchor Node Error Correlation Coefficient=−0.06 p−value=0.07
7
1
2
Line of best fit, 1st order (r : 0.00)
Mean of Anchor Node Error Correlation Coefficient=0.01 p−value=0.86
0.9
2
6
Mean Location Error (factor of radio radius)
Mean Location Error (factor of radio radius)
Line of best fit, 1st order (r : 0.00)
5
4
3
2
1
0
0.8
0.7
0.6
0.5
0.4
0.3
0.2
0
0.1
0.2
0.3 0.4 0.5 Mean of Anchor Node Error
0.6
0.7
(c) Mean Anchor Error vs Location Error
0.8
0.1
0
0.1
0.2
0.3 0.4 0.5 Mean of Anchor Node Error
0.6
0.7
0.8
(d) Mean Anchor Error vs Location Error Excluding Outliers
Figure 4.3
21 Even after the outliers are excluded, no pattern emerges and the correlation coefficients remain extremely low. Further, the line of best fit has a low r-squared value of 0.02. Higher order best fits also show no clear correlation.
4.4.2
Network Area Coverage
Another seemingly obvious optimal anchor placement is to have the anchors as far apart as possible. The rationale behind this hypothesis is that if a wider area of the network is covered by the anchor nodes, then the resulting calculated transformation will take into account more network variations. Figure 4.4a shows the sum of distances between each anchors versus mean localization error for that anchor set. I describe this as the sum of distances of the anchors instead of the perimeter of the triangle formed because this hypothesis investigates if the further apart the anchors are from each makes a difference. Further, the sum of distances scales for the case of more than three anchor nodes, whereas the meaning of perimeter will change the desired description. Regardless, the plot shows that again there is low correlation between the distance between anchors and the location calculation. Further, the outliers are spread relatively evenly regardless of distance between anchor nodes, and thus this is not a good indicator of an outlier. When the outliers are excluded, as shown in Figure 4.4b, a moderate level of correlation is seen, with a much clear line of best fit. The only moderate, 0.48, correlation coefficient can be explained by the lower bound for location error. Clearly, at any distance between anchors, the lower bound can be reached as there is a virtually straight line across the bottom of the data. However, as the distance increases between the anchor nodes, the probability of getting a high location error decreases. Even if the sum of distances of the anchors is high, it is possible for two anchors to be very close together and far from the third. Therefore, the minimum distance
22
Network Random 20x20 Square with 400 nodes Excluding errors >2.0
Network Random 20x20 Square with 400 nodes 8 Sum Distance between Anchors Correlation Coefficient=−0.17 p−value=0.00
7
1
Line of best fit, 1st order (r2: 0.03)
Sum Distance between Anchors Correlation Coefficient=−0.48 p−value=0.00
0.9
2
Mean Location Error (factor of radio radius)
Mean Location Error (factor of radio radius)
Line of best fit, 1st order (r : 0.23)
6
5
4
3
2
1
0
0.8
0.7
0.6
0.5
0.4
0.3
0.2
0
10
20 30 40 Sum Distance between Anchors
50
0.1
60
0
(a) Sum of Distance
10
1
Minimum Distance between Anchors Correlation Coefficient=−0.20 p−value=0.00
Minimum Distance between Anchors Correlation Coefficient=−0.32 p−value=0.00
0.9
Line of best fit, 1st order (r2: 0.04)
2
Line of best fit, 1st order (r : 0.10)
6 Mean Location Error (factor of radio radius)
Mean Location Error (factor of radio radius)
60
Network Random 20x20 Square with 400 nodes Excluding errors >2.0
Network Random 20x20 Square with 400 nodes
5
4
3
2
1
0
−1
50
(b) Sum of Distance, Excluding Outliers
8
7
20 30 40 Sum Distance between Anchors
0.8
0.7
0.6
0.5
0.4
0.3
0.2
0
2
4
6 8 10 12 Minimum Distance between Anchors
(c) Minimum Distance
14
16
18
0.1
0
2
4
6 8 10 12 Minimum Distance between Anchors
14
16
(d) Minimum Distance, Excluding Outliers
Figure 4.4: Distance Between Anchors
18
23 between a pair of anchors is shown in Figure 4.4c. Again, the correlation coefficient is low at 0.20. However, it does appear that the outliers are slightly more likely to appear when the minimum distance between a pair of anchors is low. Further, when outliers are excluded, as shown in Figure 4.4d, the coefficient is 0.32, slightly lower than that of the sum of the distances.
4.4.3
Anchor Node Triangle
Continuing the trend of trying to show some increased correlation between the anchor coverage and location error, Figure 4.5 plots the area of the triangle formed by the three anchor nodes versus mean location error. Figure 4.6 does the same for the shortest triangle height, or in other words, a measure of the collinearity of the three anchor nodes. While the correlation coefficients remain low, it is clear that the flatter the triangle, or the more collinear the anchor nodes, the higher chance of seeing outliers in the data with an extremely high location error. Further, after removing outliers, the slope of the best fit line is has a moderate r-squared value, giving an indication that network planners should make the anchor node triangle as spread apart as possible, or more generally, make sure the points are not collinear.
4.5
Best Anchor Node Placement
Analyzing all the metrics discusses above, the best indicator of a good anchor placement is the sum of the distance between anchor nodes, once the outliers are excluded. How to avoid the outlier case is discussed in Chapter 5. Practically speaking, this means that network planners can choose between proposed anchor placements and use the measured distance between them to provide guidance about which placement
24
Network Random 20x20 Square with 400 nodes Excluding errors >2.0
Network Random 20x20 Square with 400 nodes 8 1
Area of Anchor Triangle Correlation Coefficient=−0.19 p−value=0.00
7
Mean Location Error (factor of radio radius)
Mean Location Error (factor of radio radius)
6
5
4
3
2
1
0
−1
Area of Anchor Triangle Correlation Coefficient=−0.28 p−value=0.00
0.9
2
Line of best fit, 1st order (r : 0.04)
Line of best fit, 1st order (r2: 0.08)
0.8
0.7
0.6
0.5
0.4
0.3
0.2
0
20
40
60 80 100 Area of Anchor Triangle
120
140
0.1
160
0
20
(a) All points
40
60 80 100 Area of Anchor Triangle
120
140
160
(b) Excluding outliers
Figure 4.5: Area of Anchor Triangle vs Location Error
Network Random 20x20 Square with 400 nodes Excluding errors >2.0
Network Random 20x20 Square with 400 nodes 8 1
Minimum Anchor Height Correlation Coefficient=−0.21 p−value=0.00
7
Mean Location Error (factor of radio radius)
Mean Location Error (factor of radio radius)
6
5
4
3
2
1
0
−1
Minimum Anchor Height Correlation Coefficient=−0.23 p−value=0.00
0.9
2
Line of best fit, 1st order (r : 0.04)
Line of best fit, 1st order (r2: 0.05)
0.8
0.7
0.6
0.5
0.4
0.3
0.2
0
2
4
6 8 10 Minimum Anchor Height
(a) All points
12
14
16
0.1
0
2
4
6 8 10 Minimum Anchor Height
12
(b) Excluding outliers
Figure 4.6: Minimum Height of Anchor Triangle vs Location Error
14
16
25 will result in the least amount of error.
Chapter 5
The Outlier Anchor Node Placements As seen in the previous chapter, there are some anchor node placements that are significantly worse than the average case. In this chapter, we explore in more detail the cause of these outliers and more importantly, is this condition detectable in the real world.
5.1
The Cause
Figure 5.1a shows a network difference plot of an example outlier anchor node placement for a random network. A line is drawn between the real location and the calculated location. For comparison, Figure 5.1b is a randomly chosen normal case. This representation gives a clear indication that the reflection component of the final linear transformation is to blame for the extremely poor results.
5.2
Avoid Outliers
Unfortunately, simply disabling the reflection component of the Procrustes transformation algorithm does not solve the problem. The output of the Procrustes algorithm
26
27 10
20
9
18
8
16
7
14
6
12
5
10
4
8
3
6
2
4
1
2
0
0
1
2
3
4
5
6
7
8
9
10
0
0
Max error: 7.241r Mean error: 2.898r, Reflection: 62.01°
(a) An outlier network difference
2
4
6
8
10
12
14
16
18
Max error: 0.601r Mean error: 0.230r, Reflection: 55.86°
(b) A normal network difference
Figure 5.1 is a linear transformation which includes a rotation or reflection matrix. If the determinant of that matrix is +1, then the resulting transformation has rotation, with an angle as in Equation 5.1.
cos θ − sin θ det (T ) = +1 ⇒ Rotation with T = sin θ cos θ
(5.1)
If the determinant is -1, then the resulting transformation has reflection component, across a line at angle as shown in Equation 5.2.
cos 2θ sin 2θ det (T ) = −1 ⇒ Ref lection with T = sin 2θ − cos 2θ
(5.2)
Figure 5.2 shows the rotation and reflection distributions of two different networks, for a random of set of anchor sets for each network. In both networks, and with consistency across others, the bulk of the data points have the same angle of
20
28 Network Random 20x20 Square with 400 nodes
Network Random 20x20 Square with 400 nodes
8
7 Rotation Reflection
Rotation Reflection 6 Mean Location Error (factor of radio radius)
Mean Location Error (factor of radio radius)
7
6
5
4
3
2
4
3
2
1
1
0
5
0
20
40
60 80 100 120 Angle of Rotation or Reflection (degrees)
140
160
180
0
0
20
(a)
40 60 80 100 Angle of Rotation or Reflection (degrees)
120
140
(b)
Figure 5.2: Rotation and Reflection versus Mean Location Error either rotation or reflection, while the outliers have the opposite property with a wide variance in the angle. However, between networks, it is not consistently wither rotation or reflection. Therefore, relying on the determinant of the transformation is not a sufficient indicator of a network planner knowing that an outlier case has been hit and thus the localization results are essentially useless. Further, the Procrustes algorithm itself provides a measure of the dissimilarity. Specifically, it is the minimized value of sum of squared errors [21]. As shown in Figure 5.3, it is not a good indicator of the transformation as it pertains to the entire network. This is because the Procrustes algorithm is only performed on the anchor nodes themselves and for those nodes themselves, the transformation is good. As shown in Figure 5.2, each network has a natural rotation or reflection angle to provide accurate localization. As the linear transformation moves away from that angle, the errors increase. Unfortunately, there is no direct indicator that a particular anchor set generates a transformation with an incorrect angle. Therefore, network planners must avoid all anchor sets that could potentially generate such an angle. As
29 Network Random 20x20 Square with 400 nodes 7 Dissimilarity measure Correlation Coefficient=0.04 p−value=0.21 Line of best fit, 1st order (r2: 0.00)
Mean Location Error (factor of radio radius)
6
5
4
3
2
1
0
0
0.01
0.02
0.03 0.04 0.05 Dissimilarity measure
0.06
0.07
0.08
Figure 5.3: Procrustes dissimilarity measure shown in the Section 4.4.3, the minimum height of the triangle formed by the anchor nodes are a good indicator of the possibility of a poor transformation angle.
5.3
Outlier Indicators
This section proves that the minimum height of the anchor node triangle is a good indicator of the outlier case more rigorously then previously shown. Further, we provide a good metric for how flat of a triangle is too flat.
30
7
6
Mean Location Error (factor of radio radius)
5
4
3
2
1
0 −3 10
−2
10
−1
10 Minimum Anchor Triangle Height (factor of radio radius)
0
10
1
10
Figure 5.4: Minimum anchor triangle heights, with confidence intervals grouped in intervals of 0.1r
Chapter 6
Other Factors
6.1
Evidence of Other factors
In the following example, the same anchor set is used in four different random networks. Figure 6.1, shows two non-outlier cases. Figures 6.1a and 6.1c plot a line between the real and calculated location of each node, giving a visual representation of the error. That same data is interpolated into a contour plot in Figures 6.1b and 6.1b. Not surprisingly, the mean error for each network, despite have the same anchor set, is different. What is surprising in the degree to which they are different: 37%. While it is clear that anchor placement does play a role, there are significant other factors affecting the localization error. Further, Figure 6.2 shows two more random networks, using the same anchor set as above. As seen in the Chapter 5, some short anchor node triangles can cause extremely poor localization. In this case, we see that even the same anchor set does not necessarily mean that the resulting localization results will so poor.
31
32
10
Interpolated Mean Error 10
1.6
9
9 1.4
8
8 7
1.2 7
6
1
6 5
5
0.8
4
4 3
0.6 3
2
0.4 2 1
1 0
0
1
2
3
4
5
6
7
8
9
0.2
10
Max error: 0.705r Mean error: 0.266r, Rotation: 60.13°
0
0
1
2
3
(a) Network A
4
5
6
7
8
9
10
(b) Network A
10
10
9
9
8
8
7
7
6
6
5
5
4
4
3
3
2
2
1
1
1.6
1.4
1.2
1
0.8
0.6
0
0.4
0
1
2
3
4
5
6
7
8
9
Max error: 0.725r Mean error: 0.193r, Reflection: 52.55°
(c) Network B
10
0
0.2
0
1
2
3
4 5 6 Interpolated Mean Error
7
(d) Network B
Figure 6.1: 2 different networks with the same anchor set
8
9
10
33
10
10
18
9
9
16
8
8
7
7
6
6
5
5
4
4
3
3
2
2
4
1
1
2
14
12
10
8
0
0
1
2
3
4
5
6
7
8
9
10
0
Max error: 7.241r Mean error: 2.898r, Reflection: 62.01°
6
0
1
2
3
(a) Network C
4 5 6 Interpolated Mean Error
7
8
9
10
(b) Network C
10
10
9
9
8
8
7
7
6
6
5
5
4
4
3
3
2
2
1
1
16
14
12
10
8
6
4
0
0
1
2
3
4
5
6
7
8
9
Max error: 7.055r Mean error: 3.190r, Reflection: 51.78°
(c) Network D
10
0
2
0
1
2
3
4 5 6 Interpolated Mean Error
7
8
(d) Network D
Figure 6.2: 2 more different networks with the same anchor set
9
10
List of References [1] D. Nicelescu and B. Nath, “Ad Hoc Positioning System (APS),” in Global Telecommunications Conference (GLOBECOM 2001), vol. 5, (San Antonio, Texas), pp. 2926–2931, November 2001. [2] Y. Shang, W. Rumi, Y. Zhang, and M. Fromherz, “Localization from connectivity in sensor networks,” Parallel and Distributed Systems, IEEE Transactions on, vol. 15, pp. 961 – 974, nov. 2004. [3] L. Li and T. Kunz, “Localization applying an efficient neural network mapping,” in Proceedings of the 1st international conference on Autonomic computing and communication systems (Autonomics 2007), vol. 302, (Rome, Italy), 2007. [4] L. Li and T. Kunz, “Cooperative node localization using nonlinear data projection,” ACM Transactions on Sensor Networks (TOSN), vol. 5, February 2009. [5] J. Kumagai, “The secret life of birds,” IEEE Spectrum, vol. 41, pp. 42–48, April 2004. This is the article that originally piqued my interest in WSN, and inspired me to pursue thesis research in this area. [6] “RUNES (Reconfigurable Ubiquitous Networked Embedded Systems) IST Project.” http://www.ist-runes.org, 2004-2006. [7] B. Wellenhoff, H. Lictenegger, and J. Collins, Global Positioning System: Theory and Practice. Berlin, Germany: Springer, 4th ed., 1997. [8] A. Savvides, C. Han, and M. Strivastava, “Dynamic finegrained localization in ad-hoc networks of sensors,” in Proceedings of the 7th Annual International Conference on Mobile Computing and Networking (MobiCom’01, (Rome, Italy), pp. 166–169, July 2001.
34
35 [9] D. Nicelescu and B. Nath, “Ad hoc positioning system (APS) using AOA,” in Twenty-Second Annual Joint Conference of the IEEE Computer and Communications (INFOCOM 2003), vol. 3, (San Francisco, California), pp. 1734–1743, April 2003. [10] N. Patwari, A. Hero, M. Perkins, N. Correal, and R. O’Dea, “Relative location estimation in wireless sensor networks,” IEEE Transactions on Signal Processing, vol. 51, no. 8, pp. 2137–2148, 2003. [11] Y. Shang and W. Ruml, “Improved mds-based localization,” in INFOCOM 2004. Twenty-third AnnualJoint Conference of the IEEE Computer and Communications Societies, vol. 4, pp. 2640 – 2651 vol.4, 7-11 2004. [12] P. Demartines and J. Herault, “Curvilinear component analysis: a self-organizing neural network for nonlinear mapping of data sets,” Neural Networks, IEEE Transactions on, vol. 8, pp. 148 –154, jan 1997. [13] L. Doherty, K. Pister, and L. El Ghaoui, “Convex position estimation in wireless sensor networks,” in INFOCOM 2001. Twentieth Annual Joint Conference of the IEEE Computer and Communications Societies. Proceedings. IEEE, vol. 3, pp. 1655 –1663 vol.3, 2001. [14] S. Hara and T. Fukumura, “Determination of the placement of anchor nodes satisfying a required localization accuracy,” in Wireless Communication Systems. 2008. ISWCS ’08. IEEE International Symposium on, pp. 128 –132, 21-24 2008. [15] J. Ash and R. Moses, “On optimal anchor node placement in sensor localization by optimization of subspace principal angles,” in Acoustics, Speech and Signal Processing, 2008. ICASSP 2008. IEEE International Conference on, pp. 2289 –2292, march 2008. [16] H. Karl and A. Willig, Protocols and Architectures for Wireless Sensor Networks. John Wiley & Sons, Ltd, 2005. [17] C. Savarese, J. M. Rabaey, and K. Langendoen, “Robust positioning algorithms for distributed ad-hoc wireless sensor networks,” in ATEC ’02: Proceedings of the General Track of the annual conference on USENIX Annual Technical Conference, (Berkeley, CA, USA), pp. 317–327, USENIX Association, 2002. [18] K.-Y. Cheng, K.-S. Lui, and V. Tam, “Hybloc: Localization in sensor networks with adverse anchor placement,” Sensors, vol. 9, no. 1, pp. 253–280, 2009.
36 [19] H. Lim and J. Hou, “Localization for anisotropic sensor networks,” vol. 1, pp. 138 – 149 vol. 1, mar. 2005. [20] R. Zemek, M. Takashima, S. Hara, K. Yanagihara, K. Fukui, S. Fukunaga, and K. Kitayama, “An effect of anchor nodes placement on a target location estimation performance,” in TENCON 2006. 2006 IEEE Region 10 Conference, pp. 1 –4, 14-17 2006. [21] “Procrustes analysis.” http://www.mathworks.com/help/toolbox/stats/procrustes.html, 2010.
Appendix A
c Matlab Simulation Code All source code used to simulate CCA-MAP and generate resulting data can be found c in Google Code. The code was originally written by Li Li and modified for the purposes of readability and different output data and plots. See http://code.google.com/p/sim4j/source/browse/#svn/trunk/thesis/matlab for details.
37