Communicated by George Feher, January 10, 1994 (receivedfor review September 10, 1993) ..... J., Griffin, R. G. & Singel, D. J. (1993) J. Am. Chem. Soc. 115,.
Proc. Nati. Acad. Sci. USA Vol. 91, pp. 5262-5266, June 1994 Biophysics
Angular orientation of the stable tyrosyl radical within photosystem II by high-field 245-GHz electron paramagnetic resonance SUN UN*, LOUIS-CLAUDE BRUNELt, THILO M. BRILL*, JEAN-LUC ZIMMERMANN*, RUTHERFORD*§
AND A. WILLIAM
*Section de Biodnergetique, Centre National de la Recherche Scientifique Unite de Recherche Associ6e 1290, Department Biologie Cellulaire et Moleculaire, Centre d'Etudes de Saclay, F-91191 Gif-sur- Yvette, France; tService National des Champs Intenses, Centre National de la Recherche Scientifique, B.P. 166, F-38042 Grenoble, France; and *Mac-Planck-Institut fOr Festk6rperforschung, B.P. 166, F-38042 Grenoble, France
Communicated by George Feher, January 10, 1994 (received for review September 10, 1993)
ABSTRACT The 4 K 245-GHz/8.7-T electron paramagnetic resonance spectrum of the stable tyrosyl radical in photosystem I, known as TyrD, has been measured. Illumination at 200 K enhances the signal Intensity of TyrD" by a factor of >40 compared to the signal obtained from darkadapted samples. This signal ehncement and the unusual ine shape of the TyrD' resonance result from the magnetic dipolar coupling of the radical to the manganese duster involved in oxygen evolution. The relative alar orientation of the m _ cluster with respect to TyrD- has been determined from line-shape analysis. The resonance arising from TyrD' in Tris-washed nsfree photosystem U sample is also distorted. This effect probably originates from the influence of aon of the tyrosyl radical. the nonheme iron on the spin The relative angular orientation of the nonheme iron has also been determined. Oriented samples were used to determine the angular orientation of TyrD with respect to the membrane plane. Combining angular data with pubilshed distances, we have constructed a three-dimensional picture of the relative positions of TyrD', the manganese cluster, and the noneme iron. The data suggest a more symmetrical placement of the manganese relative to TyrD- and TyrZ, the tyrosine involved in eleco transfer, than is usually assumed in current models of photosystem H.
possible orientations ofthe radical with respect to the applied magnetic field contribute to a given field position on the TyrD spectrum. Thus, the determination ofthe orientation of an external relaxer is difficult. However, at magnetic fields much larger than those conventionally used, the anisotropic g interaction dominates the spectrum. The orientation dependence of this interaction is purely determined by the orientation of the entire tyrosyl molecule with respect to the applied magnetic field. We have studied the EPR spectrum of the tyrosyl radical from PSII at 8.7 T and 245 GHz. This field strength is a factor of -30 greater than that used for conventional EPR spectroscopy. Other high-field studies have been carried out on various biological radicals (14-17). The tyrosyl radical has been studied in PSII by Gulin et al. (16) at 135 GHz and in ribonucleotide reductase by Gerfen et al. (15) at 140 GHz. These studies showed that the spectrum of the tyrosyl radical at high fields is clearly dominated by the anisotropy in the g value. This anisotropy, in conjunction with the influence of the manganese cluster and the nonheme iron of PSII on the spin relaxation of the tyrosyl radical, has enabled us to determine the orientation of the tyrosyl radical relative to these components. By combining these angular data with existing 0.35-T (9 GHz) time-domain relaxation measurements, we have obtained a partial three-dimensional picture of PSII with the positions of the tyrosyl radical, the manganese cluster, and nonheme iron.
At low temperatures, the electron paramagnetic resonance (EPR) signal of the stable tyrosyl radical, known as TyrD- (1, 2), from plant photosystem II (PSIT) is known to be "relaxation enhanced" when the sample is illuminated at 200 K (3, 4). This enhancement has been attributed to the presence of a second paramagnetic species that is capable of increasing the relaxation rates of the tyrosyl radical through a dipolar interaction. The second paramagnet is thought to be the manganese cluster that is involved in charge storage and probably acts as the active site for oxygen evolution (5, 6).
MATERIALS AND METHODS Samples. PSII-enriched membranes were prepared from spinach by the method of Berthold et al. (18) with minor modifications. Samples (300 jl) at =5 mg of chlorophyll per ml in 400 mM sucrose/20 mM Mes, pH 6.5/5 mM MgCl2 were put into a Teflon cup (10 mm in height and 7 mm in internal diameter that acted as the sample holder), dark-adapted for a minimum of 30 min, then placed into the cryostat, and
The dipolar spin-relaxation mechanism has been thoroughly studied (7-9). The strength of the dipolar interaction is determined by the distance between the two spins and the angle between the interspin vector and the applied magnetic field. Previous work on PSII has concentrated on the determination of the interspin distance (10-13). No attempts have been made to obtain the angular orientation of the two spins. At magnetic field strengths used in conventional EPR spectroscopy, the spectrum of the tyrosyl radical is dominated by the hyperfine interactions between the electron spin and its neighboring protons. The inhomogeneous line width of the spectrum is determined by the anisotropic parts of these hyperfine interactions and the g anisotropy, each of which has its own particular orientation dependence relative to the molecular frame. A good approximation is that all
frozen at zero magnetic field. Illumination of these samples was carried out at 200 K by using a small helium/neon laser for a minimum of 30 min. For some experiments, the PSII membranes were exposed to 1 M Tris-HCl (pH 8.8) in room light to remove the manganese cluster. The membranes were washed two or three times with Mes, pH 6.5/10 mM EDTA and resuspended in the buffer described above. For orientation experiments, Tris-washed membranes were resuspended in 5 mM Mes (pH 6.5) and partially dried on Mylar sheets under 90% humidity in an argon atmosphere for 48 hr at 00C in the dark. The sheets were mounted
The publication costs of this article were defrayed in part by page charge payment. This article must therefore be hereby marked "advertisement" in accordance with 18 U.S.C. §1734 solely to indicate this fact.
Abbreviations: EPR, electron paramagnetic resonance; PSII, photosystem II. §To whom reprint requests should be addressed.
5262
Proc. Natl. Acad. Sci. USA 91 (1994)
Biophysics: Un et al. perpendicular and parallel to the magnetic field in the sample holder described above. 245-GHz/8.7-T EPR Spectrometer. The spectrometer used for these experiments has been described (19). The 245-GHz (A = 1.22 mm) methanol-d (CH302H) emission from the far-infrared laser was used for these experiments. The maximum microwave power at the sample was 10 ,uW. A Golay cell was used to monitor the relative microwave power. The spectrometer was equipped with an Oxford helium flow cyrostat and temperature controller. Dipolar Relaxation. The influence of a paramagnetic spin (spin S) on the spin relaxation of another spin (spin 1), under conditions of high magnetic field and low temperatures is given by 1
1 -+ _= -T6 T11 T11i
1
12S
1
-=-
T2,
+
"Z)2 T2 2
02
(1 - 3
cos20)2
1 1 + -DTS(l-3 Cos20)2, T21j 3
1
[1]
[2]
where D = y2ysh2S(S + 1)/4ir2r6 and TIi, where x is 1 or 2, are the intrinsic relaxation times in the absence of the dipolar interaction (7, 9, 13), wi is the precession frequency of spin i, r is the distance between the spin s, 6 is the angle subtended by the vector connecting the two spins and the external magnetic field, y' is the magnetogyric ration of spin i, and h is Planck's constant. We assume the influence of scalar exchange interactions are negligible. The orientation dependence of the dipolar interaction relative to the principal axis system of the g anisotropy is given by cos 0 = sin a sin q cos(,8- ) + cos a cos
4f,
[3]
where a and (3 are the angles that indicate the direction of the relaxer relative to the C-O bond (or gx, see Fig. 1) and the direction perpendicular to the phenyl ring plane (or ge), respectively, and 4i and p give the direction of the magnetic field with respect to the C-O bond and the direction perpendicular to the phenyl ring plane, respectively. Calculations. Spectrum simulations that incorporate g anisotropy, hyperfine interactions, and relaxation effects were calculated by using a random sampling technique (20). Additional calculations were carried out using the program MATHEMATICA (Wolfram Research, Champaign, IL).
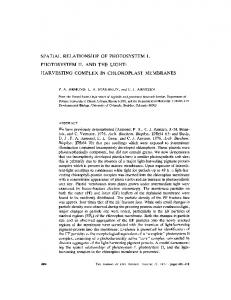
RESULTS We present in Fig. 1 a calculated derivative spectrum based on the TyrD' hyperfine data of Hoganson and Babcock (21) and g values determined at 245 GHz (see below). The orientation of the principal axis system of the g anisotropy and hyperfine tensor for protons at positions 3 and 5 are also shown on Fig. 1 (21). The 2.5-G gaussian line width (1 G = 0.1 mT) used in the calculation was intentionally chosen so that the hyperfine structure could be easily seen. The overall envelope of the spectrum is determined by g anisotropy. The 200K Illumination ofIntact Samples. The 4 K spectrum of tyrosyl radical after 200 K illumination of the intact PSII sample is shown in Fig. 2A. The g values are 2.00745, 2.00422, and 2.00212 with an error of ±2 x 10⁻⁴. These values are in good agreement with previous low-frequency measurements (21-23). We specify a relatively large error range to account for systematic errors due to magnet calibration and control. In fact, simulations were sensitive to changes as small as ±2 x 10⁻⁵. In contrast to 140-GHz measurements made on ribonucleotide reductase (15), we were unable to detect any hyperfine structure on the three turning points of
9z1
gy
5263
A
0
A
\H~A
7-r
8.73
IIIIR
H2
[T]
FIG. 1. Calculated 245-GHz derivative EPR spectrum of the TyrD' and orientation of the hyperfine tensor and g anisotropy. The simulation is based on hyperfine parameters taken from ref. 20 and g values from the present work. The orientation of the g anisotropy was also taken from ref. 20. The calculated spectrum was convolved with a narrow 2.5-G gaussian function.
the spectrum, even on the gx edge where the hyperfine anisotropy is expected to be the largest (see Fig. 1). This apparent low resolution of the spectrum is due to a large field modulation amplitude of 15 G. Spectra obtained with a 10 ms), we would expect to see a reduction in intensities due to fast passage effects (10, 29). This would have the effect of scaling the amplitude of the spectrum by T1. Technical limitations did not permit us to vary the modulation frequency sufficiently enough to test directly for the presence of fast passage. The spectra were fit with the following equation
(H)
=
K[T()]{[l-xT()]/2}F(g, H),
[4]
where S is the signal amplitude at a field value H and K is a proportionality constant. Eq. 4 incorporates a Tj71 factor that accounts for the fast passage effect, a power saturation term (30), and F(g, H), the form factor determined by the Zeeman and hyperfine interactions and the magnetic field value. T1(O) is given by Eq. 1 and 0 is given by Eq. 3. The parameter x,
estimated independently from a study of the The orientation of the principal axis system of the g anisotropy was taken from the literature (21, 31) and the g values were adjusted to give the best fit. Using Eq. 4, we could fit spectra taken over a 20-db power range from below to well above saturation. The low-power fits are shown on Fig. 2 A and B. At high powers, the fits were comparable. Interestingly, it was not necessary to invoke an anisotropic T2. This could arise from the fact that Eq. 2 is not valid, because T21 < T1s, which leads to an isotropic T2I (9). There are eight symmetry-related solutions, one in each octant. The angular position of the manganese cluster relative to the tyrosyl radical was determined to be 1520 from the C-O bond or gx direction (a in Eq. 3) and 64° from the phenyl ring perpendicular or g, direction (( in Eq. 3 and Fig. 1). The angular position of the nonheme iron was found to be 620 from the g. direction and 150 from the g, direction. In each case, the estimated error is about ±+100. These angular data are pictorially summarized in Fig. 3 A and B. Of the eight symmetry-related angles, these particular angles were chosen because they most closely resemble the predicted structure based on the bacterial reaction centers (32, 33). The values found for the nonheme iron are quite similar to those predicted based on analogy to the bacterial system. in Eq. 4,
was
power saturation of the tyrosyl radical.
Orientation of the Tyrosyl Radical Relative to the Membrane Plane. When preparations of PSII are dried on plastic films under controlled humidity conditions, the membranes orient with the membrane plane parallel to plane of the film (34). We
Proc. Natl. Acad. Sci. USA 91 (1994)
Biophysics: Un et al.
A
5265
C
B e.-
Fe
I
T
X -Z
1, ., 'I.
7n"
1 52
gy
I,:25
-40
Mn
~ ~ ~ ~ ~ ~ ~ ~ ~ ~ I-,~_
Fe
FIG. 3. Relative orientation of TyrD', the manganese cluster, and the nonheme iron. (A and B) Two views of the angular data obtained from this study. (A) The view looking down the g, axis (the direction perpendicular to the phenyl ring). (B) The view down the g. direction (the C-O bond direction). (C) The relative positions of the components of PSII determined from orientation data and distances described in the text. The dotted line represents the C2 axis, which is perpendicular to the membrane plane and runs through the nonheme iron. TyrZ has been placed in a position symmetrical to TyrD as predicted by most models. The TyrD'-to-manganese cluster distance shown is 32 A with a phenyl-ring tilt of 650 relative to the membrane plane. At the distance and angle shown, the manganese cluster is approximately equidistant to the two tyrosines.
used such samples, which were also Tris-washed, to obtain the orientation of the principal axis system of the g anisotropy and, therefore, the molecular orientation relative to the membrane plane. The EPR spectra of two mutually orthogonal orientations of the PSII sample are shown in Fig. 4. Simulations show that the phenyl ring plane is oriented 650 to 750 with respect to membrane plane (Fig. 3C). The results are in agreement with previous studies at low fields (21, 22, 34). Role of Mn2+. In aged samples where the Mn2+ from the degradation of the manganese cluster was clearly observed at 4 K, the EPR signal of the tyrosyl radical lost all evidence of anisotropic relaxation enhancement (Fig. 2C). The calculated residual exhibits four of the six hyperfine lines of the Mn2+ (the remaining two hyperfines lines are outside of the field range of the spectrum shown). This would imply that Mn2+ still exerted a relaxation effect and were distributed in such a way as to average the orientation dependence. BA.
A.f1
8.72
8.73 [T]
8.74
FIG. 4. The 245-GHz EPR spectrum of oriented Tris-washed PSHI samples. The sample is oriented with the membrane plane parallel (A) and perpendicular (B) to the applied magnetic field. Superimposed on each spectra are the calculated spectra based on a 65° tilt of the phenyl ring with respect to the membrane plane. The remaining calculation parameters were the same as for Fig. 2B.
DISCUSSION At high magnetic field, the manganese cluster of PSII is a potent relaxer. Since dipolar relaxation is anisotropic, the relaxation enhancement by the manganese cluster observed for the tyrosyl radical at 4 K after 200 K illumination must also be anisotropic. This conclusion is supported by the observation that for Tris-washed samples, which are devoid of manganese, the EPR signal of the tyrosyl radical saturates much more readily and the intensity distribution is different from that observed for intact samples and those calculated neglecting relaxation effects. Furthermore, in samples where the manganese cluster has been damaged and the manganese released is present as Mn2+, the intensity distribution more closely resembles calculated spectra that neglect relaxation effects. The angular dependence of the dipolar spin relaxation observed at 245 GHz also affects measurements made at 9 GHz. In general, the effect is observed as a biphasic response in both the saturation recovery and inversion recovery experiments (refs. 13 and 28 and unpublished data). Using the published relaxation data obtained for pulse-EPR experiments on the S2 multiline signal and TyrD' (10, 35, 36), we calculated the interspin distance using Eq. 1. The spin-lattice relaxation time of the tyrosyl radical in the absence of the manganese cluster, T11I in Eq. 1, was assumed to be 14-28 ms. This range corresponds to the spin-lattice relaxation time of the tyrosyl radical in manganese-free PSII and in UVirradiated tyrosine samples (10, 13). The T2 of the multiline signal was estimated to be -0.7 ps from published electron spin echo envelope modulation data (35, 36). T1 recovery curves were calculated and then compared to published data (10). These calculations yielded a manganese cluster-toTyrD' distance of 25-35 A. At distances >40 A, the biphasic character of the calculated T1 recovery curves was lost and resembled simple exponential decays. The distance between the tyrosyl radical and the nonheme iron has been determined to be 38 A by Hirsch et al. (13), which is in good agreement with existing models. By combining these distances with the relative angular orientations measured using high-field EPR, we constructed a three-dimensional diagram, shown in Fig. 3C. The positions of the components relative to the thylakoid surfaces are in reasonable agreement with the work of Innes and Brudvig (11). If TyrZ is assumed to be located on a twofold axis opposite to TyrD', then our results are consis-
5266
Biophysics: Un et A
tent with a more symmetric placement of the manganese cluster with respect to the two tyrosines. If an asymmetry exists, it is less marked than is drawn in some models (2, 5, 37, 38). Fig. 3C shows the specific case where the TyrD--tomanganese cluster distance is 32 A and the phenyl ring plane is tilted 650 with respect to the membrane plane. At this distance and angle, the two tyrosines are approximately equidistant to the manganese cluster. At shorter distances or larger angles, the manganese cluster is closer to TyrD' than to TyrZ and at larger distances and smaller angles the opposite is true. We note that the positions are particularly sensitive to the angular orientation of TyrD' with respect to the membrane plane. The symmetric position of the manganese cluster relative to the two tyrosines is in apparent contradiction with current models (e.g., refs. 2, 5, 37, and 38). Earlier EPR data indicated that TyrD' is more readily saturated than TyrZ, which lead to the conclusion that the latter was closer to the
cluster (2). Close inspection of the published saturation data shows that the difference in the saturation factors, defined by y2HMTiT2, between the tyrosines could be as small as a factor of 4. If this were so and the Ti and T2 of the tyrosyl radical were dominated by the dipolar coupling to the manganese, the ratio of tyrosine distances to the manganese cluster could be as small as 1.1-1.3 (see Eqs. 1 and 2). Given the magnitude of the uncertainty in the distance calculations and in our orientation measurements, a slight asymmetric placement in favor of TyrZT would certainly be possible and would be consistent with the published saturation data (2). Electroluminescence measurements showed that TyrZT reduction by the S states was exposed to 5% of the membrane potential (39). It is not clear, however, how this translates into the positioning of the components since the donor is likely situated in protein that protrudes into the lumen and since proton movements may also occur on the time scale of the experiment. From mutagenesis studies, Asp-170 of the D1 polypeptide has been suggested to be a ligand to the manganese cluster (40). Computer modeling places Asp-170 6-7 A from TyrZT (38). Thus these results clearly do not agree with the model presented here. However, they also contradict earlier EPR measurements that place the manganese cluster at a distance >15 A from Tyrz- (2, 41), a distance that is consistent with our model. Finally, we note that at a distance of 32 A, the electron transfer rate is expected to be extremely slow (42). The measured rates are on the order of 30-1200 ps (43, 44). Thus, if TyrZ is as far from the manganese cluster as our data suggest, then one must consider the possibility that the manganese cluster-to-TyrZ electron transfer occurs through an intermediate. We thank Klaus Brettel for useful discussions. S.U. thanks Jean-Michel Neumann for the use of computer resources and the High Magnetic Field Laboratory for partial financial support. 1. Barry, B. A. (1993) Photochem. Photobiol. 57, 179-188. 2. Babcock, G. T., Barry, B. A., Debus, R. J., Hoganson, C. W., Atamian, M., McIntosh, L., Sithole, I. & Yocum, C. F. (1989) Biochemistry 28, 9557-9565. 3. de Groot, A., Plijter, J. J., Evelo, R., Babcock, G. T. & Hoff, A. J. (1986) Biochim. Biophys. Acta 8S, 8-15. 4. Styring, S. & Rutherford, A. W. (1988) Biochemistry 27, 49154923. 5. Debus, R. J. (1992) Biochim. Biophys. Acta 1102, 269-352. 6. Rutherford, A. W., Zimmermann, J.-L. & Boussac, A. (1992)
Proc. Natl. Acad. Sci. USA 91 (1994)
7. 8. 9. 10. 11. 12.
13. 14. 15. 16.
17. 18. 19. 20. 21. 22. 23.
24. 25. 26.
27. 28. 29. 30. 31. 32.
33. 34. 35. 36. 37. 38. 39. 40. 41. 42.
43. 44.
in The Photosystems: Structure, Function and Molecular Biology, ed. Barber, J. (Elsevier, Amsterdam), pp. 125-158. Bloembergen, N. (1948) Physica 15, 386-426. Leigh, J. S. (1970) J. Chem. Phys. 52, 2608-2612. Goodman, G. & Leigh, J. S. (1985) Biochemistry 24, 23102317. Evelo, R., Styring, S., Rutherford, A. W. & Hoff, A. J. (1989) Biochim. Biophys. Acta 973, 428-442. Innes, J. B. & Brudvig, G. W. (1989) Biochemistry 28, 11161125. Kodera, Y., Takura, K. & Kawamori, A. (1992) Biochim. Biophys. Acta 1101, 23-32. Hirsch, D. J., Beck, W. F., Innes, J. B. & Brudvig, G. W. (1992) Biochemistry 31, 532-541. Prisner, T. F., McDermott, A. E., Un, S., Norris, J. R., Thurnaur, M. C. & Griffin, R. G. (1993) Proc. Natl. Acad. Sci. USA 90, 9485-9488. Gerfen, G. J., Bellew, B. F., Un, S., Bollinger, J. M., Stubbe, J., Griffin, R. G. & Singel, D. J. (1993) J. Am. Chem. Soc. 115, 6420-6421. Gulin, V. I., Dikanov, S. A., Tsvetko, Y. U., Evelo, R. G. & Hoff, A. (1992) J. Pure Appl. Chem. 64, 903-906. Burghaus, O., Plato, M., Bumann, D., Neumann, B., Lubitz, W. & Mobius, K. (1991) Chem. Phys. Lett. 185, 381-386. Berthold, D. A., Babcock, G. T. & Yocum, C. F. (1981) FEBS Lett. 134, 231-234. Muller, F., Hopkins, M. A., Coron, N., Grynberg, M., Brunel, L.-C. & Martinez, G. (1989) Rev. Sci. Instr. 60, 3681-3684. Marsaglia, G. (1972) Ann. Math. Stat. 43, 645-646. Hoganson, C. W. & Babcock, G. T. (1992) Biochemistry 31, 11874-11880. Brok, M., Horikx, J. T. G. & Hoff, A. J. (1986) FEBS Lett. 203, 36-40. Brok, M., Ebskamp, F. C. R. & Hoff, A. J. (1985) Biochim. Biophys. Acta 809, 421-428. Styring, S. & Rutherford, A. W. (1988) Biochim. Biophys. Acta 933, 378-387. Koulougliotis, D., Hirsh, D. J. & Brudvig, G. W. (1992) J. Am. Chem. Soc. 114, 8322-8323. Dismukes, G. C. & Siderer, Y. (1981) Proc. Natl. Acad. Sci. USA 78, 274-278. Brudvig, G. W., Casey, J. L. & Sauer, K. (1983) Biochim. Biophys. Acta 723, 366-371. Beck, W. F., Innes, J. B. & Brudvig, G. W. (1990) in Current Research in Photosynthesis, ed. Baltscheffsky, M. (Kluwer, Dordrecht, The Netherlands), pp. 817-820. Salpeter, E. E. (1950) Proc. Phys. Soc. 63A, 337-349. Portis, A. M. (1953) Phys. Rev. 91, 1071-1078. Fasanella, E. L. & Gordy, W. (1969) Proc. Natl. Acad. Sci. USA 62, 299-304. Diesenhofer, J., Epp, O., Miki, K., Huber, R. & Michel, H. (1985) Nature (London) 318, 618-624. Allen, J. P., Feher, G., Yeates, T. O., Komiya, H. & Rees, D. C. (1987) Proc. Natl. Acad. Sci. USA 84, 5730-5734. Rutherford, A. W. (1985) Biochim. Biophys. Acta 807, 189-201. Zimmermann, J.-L., Boussac, A. & Rutherford, A. W. (1993) Biochemistry 32, 4831-4841. Britt, R. D., Lorigan, G. A., Sauer, K., Klein, M. P. & Zimmermann, J.-L. (1992) Biochim. Biophys. Acta 1040, 95-101. Svenson, B., Vass, I., Cedergren, E. & Strying, S. (1990) EMBO J. 9, 2051-2059. Svenson, B. & Strying, S. (1991) Z. Naturforsch. 46c, 765-776. Vos, M. H., van Gorkom, H. J. & van Leeuwen, P. J. (1991) Biochim. Biophys. Acta 1056, 27-39. Nixon, P. J. & Diner, B. A. (1992) Biochemistry 31, 942-948. Hoganson, C. W. & Babcock, G. T. (1988) Biochemistry 27, 5848-5855. Moser, C. C., Keske, J. M., Warncke, K., Farid, R. S. & Dutton, P. L. (1992) Nature (London) 355, 796-802. Babcock, G. T., Blankenship, R. E. & Sauer, K. (1976) FEBS Lett. 84, 286-289. Dekker, J. P., Plijter, J. J., Ouwehand, L. & van Gorkom, H. J. (1984) Biochim. Biophys. Acta 767, 176-179.